

Genetic Mimicry Analysis Reveals the Specific Lipases Targeted by the ANGPTL3-ANGPTL8 Complex and ANGPTL4
- PMID: 36372100
- PMCID: PMC9852701
- DOI: 10.1016/j.jlr.2022.100313
Genetic Mimicry Analysis Reveals the Specific Lipases Targeted by the ANGPTL3-ANGPTL8 Complex and ANGPTL4
Abstract
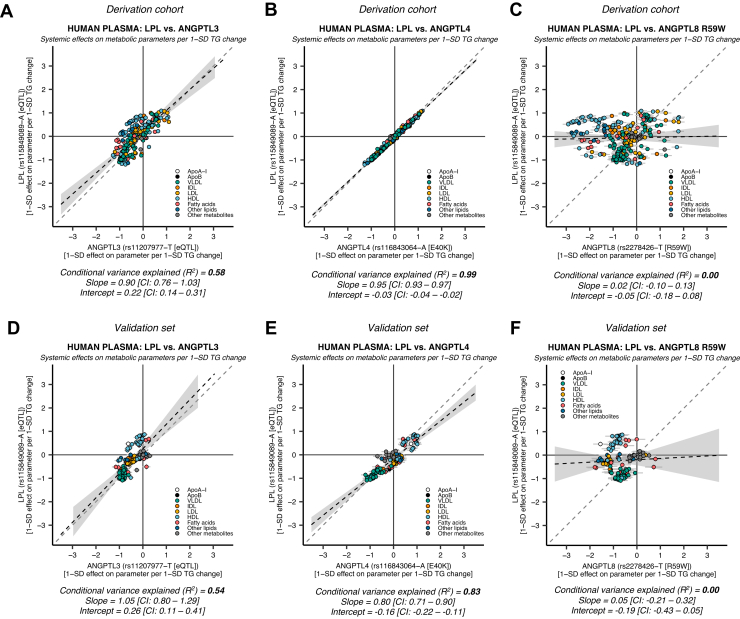
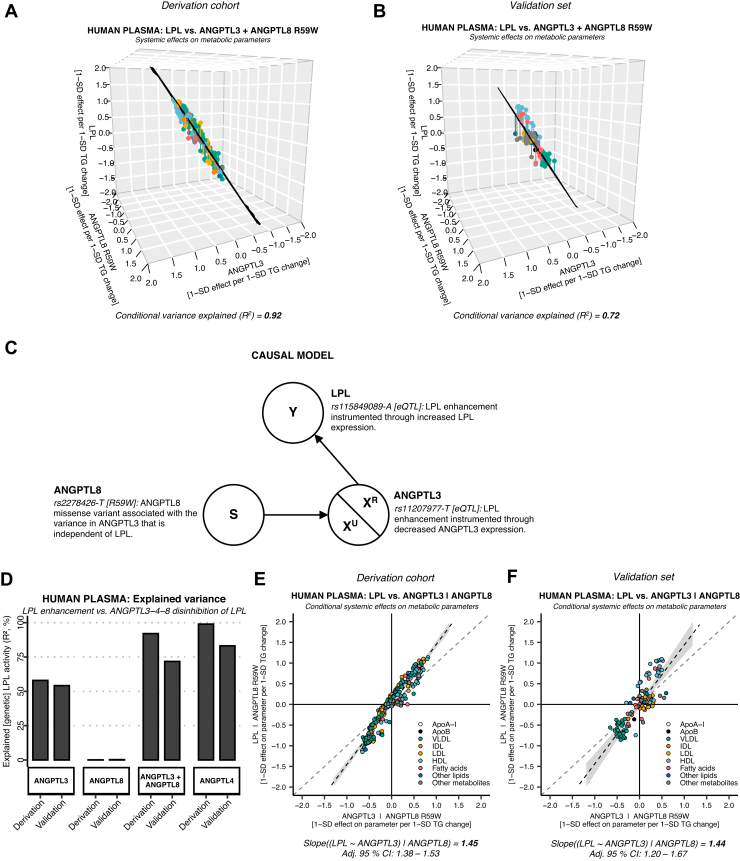
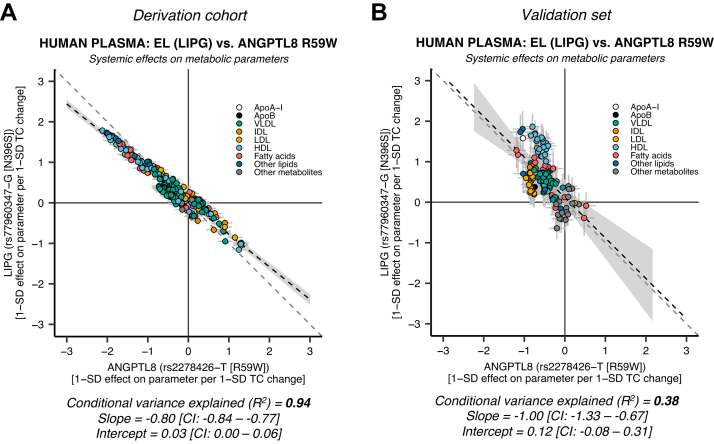
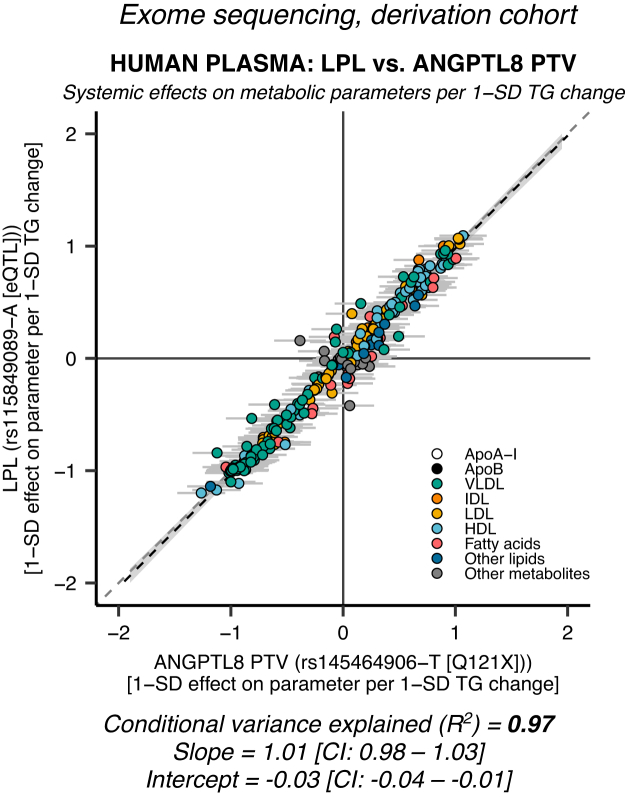
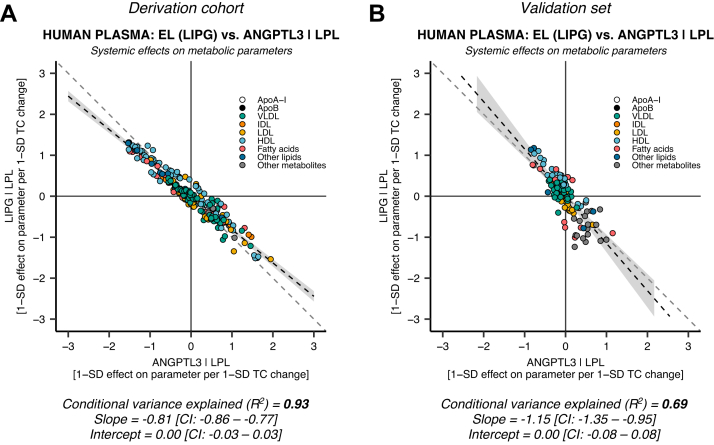
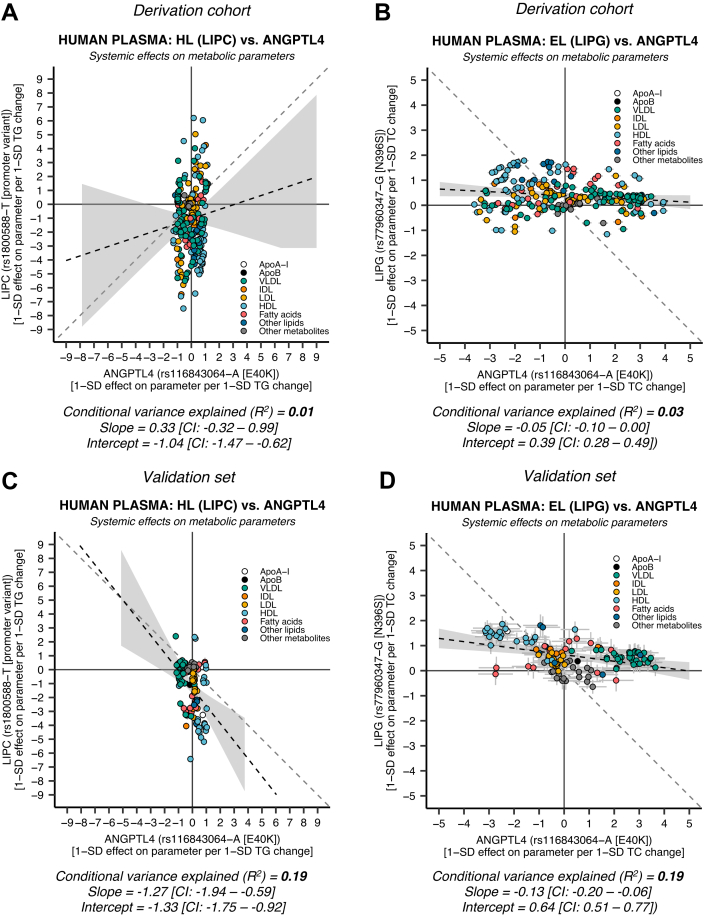
Angiopoietin-like proteins, ANGPTL3, ANGPTL4, and ANGPTL8, are involved in regulating plasma lipids. In vitro and animal-based studies point to LPL and endothelial lipase (EL, LIPG) as key targets of ANGPTLs. To examine the ANGPTL mechanisms for plasma lipid modulation in humans, we pursued a genetic mimicry analysis of enhancing or suppressing variants in the LPL, LIPG, lipase C hepatic type (LIPC), ANGPTL3, ANGPTL4, and ANGPTL8 genes using data on 248 metabolic parameters derived from over 110,000 nonfasted individuals in the UK Biobank and validated in over 13,000 overnight fasted individuals from 11 other European populations. ANGPTL4 suppression was highly concordant with LPL enhancement but not HL or EL, suggesting ANGPTL4 impacts plasma metabolic parameters exclusively via LPL. The LPL-independent effects of ANGPTL3 suppression on plasma metabolic parameters showed a striking inverse resemblance with EL suppression, suggesting ANGPTL3 not only targets LPL but also targets EL. Investigation of the impact of the ANGPTL3-ANGPTL8 complex on plasma metabolite traits via the ANGPTL8 R59W substitution as an instrumental variable showed a much higher concordance between R59W and EL activity than between R59W and LPL activity, suggesting the R59W substitution more strongly affects EL inhibition than LPL inhibition. Meanwhile, when using a rare and deleterious protein-truncating ANGPTL8 variant as an instrumental variable, the ANGPTL3-ANGPTL8 complex was very LPL specific. In conclusion, our analysis provides strong human genetic evidence that the ANGPTL3-ANGPTL8 complex regulates plasma metabolic parameters, which is achieved by impacting LPL and EL. By contrast, ANGPTL4 influences plasma metabolic parameters exclusively via LPL.
Keywords: angiopoietin-like proteins; cardiovascular disease; dyslipidemias; lipase/endothelial; lipase/hepatic; lipidomics; lipids; lipolysis and fatty acid metabolism; lipoprotein/metabolism; triglycerides.
Copyright © 2022 The Authors. Published by Elsevier Inc. All rights reserved.
Conflict of interest statement
Conflict of interest The authors declare that they have no conflicts of interest with the contents of this article.
Figures
Similar articles
-
Angiopoietin-like 3 inhibition of endothelial lipase is not modulated by angiopoietin-like 8.J Lipid Res. 2021;62:100112. doi: 10.1016/j.jlr.2021.100112. Epub 2021 Aug 27. J Lipid Res. 2021. PMID: 34461133 Free PMC article.
-
On the mechanism of angiopoietin-like protein 8 for control of lipoprotein lipase activity.J Lipid Res. 2019 Apr;60(4):783-793. doi: 10.1194/jlr.M088807. Epub 2019 Jan 27. J Lipid Res. 2019. PMID: 30686789 Free PMC article.
-
ANGPTL8 promotes the ability of ANGPTL3 to bind and inhibit lipoprotein lipase.Mol Metab. 2017 Oct;6(10):1137-1149. doi: 10.1016/j.molmet.2017.06.014. Epub 2017 Jun 29. Mol Metab. 2017. PMID: 29031715 Free PMC article.
-
Angiopoietin-like protein 8: a multifaceted protein instrumental in regulating triglyceride metabolism.Curr Opin Lipidol. 2024 Apr 1;35(2):58-65. doi: 10.1097/MOL.0000000000000910. Epub 2023 Nov 14. Curr Opin Lipidol. 2024. PMID: 37962908 Review.
-
Regulation of lipoprotein metabolism by ANGPTL3, ANGPTL4, and ANGPTL8.Am J Physiol Endocrinol Metab. 2021 Oct 1;321(4):E493-E508. doi: 10.1152/ajpendo.00195.2021. Epub 2021 Aug 2. Am J Physiol Endocrinol Metab. 2021. PMID: 34338039 Free PMC article. Review.
Cited by
-
Drug-target Mendelian randomization analysis supports lowering plasma ANGPTL3, ANGPTL4, and APOC3 levels as strategies for reducing cardiovascular disease risk.Eur Heart J Open. 2024 Apr 30;4(3):oeae035. doi: 10.1093/ehjopen/oeae035. eCollection 2024 May. Eur Heart J Open. 2024. PMID: 38895109 Free PMC article.
-
Evaluating the Cardiometabolic Efficacy and Safety of Lipoprotein Lipase Pathway Targets in Combination With Approved Lipid-Lowering Targets: A Drug Target Mendelian Randomization Study.Circ Genom Precis Med. 2025 Apr;18(2):e004933. doi: 10.1161/CIRCGEN.124.004933. Epub 2025 Mar 7. Circ Genom Precis Med. 2025. PMID: 40052268 Free PMC article.
-
Transcriptomics characteristics and differentiation of subcutaneous adipose tissue among Huainan pigs and its hybrid genetic populations.Front Vet Sci. 2025 May 22;12:1545694. doi: 10.3389/fvets.2025.1545694. eCollection 2025. Front Vet Sci. 2025. PMID: 40475027 Free PMC article.
-
Hyperlipidaemia treatment and gut microbiology.Front Microbiol. 2025 Jan 10;15:1520252. doi: 10.3389/fmicb.2024.1520252. eCollection 2024. Front Microbiol. 2025. PMID: 39867495 Free PMC article. Review.
-
Effect of complete, lifelong ANGPTL3 deficiency on triglyceride-rich lipoprotein kinetics.Cell Rep Med. 2025 Jun 17;6(6):102152. doi: 10.1016/j.xcrm.2025.102152. Epub 2025 May 29. Cell Rep Med. 2025. PMID: 40446802 Free PMC article.
References
-
- Ginsberg H.N., Packard C.J., Chapman M.J., Boren J., Aguilar-Salinas C.A., Averna M., et al. Triglyceride-rich lipoproteins and their remnants: metabolic insights, role in atherosclerotic cardiovascular disease, and emerging therapeutic strategies-a consensus statement from the European Atherosclerosis Society. Eur. Heart J. 2021;42:4791–4806. - PMC - PubMed
-
- Kersten S. Physiological regulation of lipoprotein lipase. Biochim. Biophys. Acta. 2014;1841:919–933. - PubMed
-
- Kersten S. New insights into angiopoietin-like proteins in lipid metabolism and cardiovascular disease risk. Curr. Opin. Lipidol. 2019;30:205–211. - PubMed
-
- Kersten S., Mandard S., Tan N.S., Escher P., Metzger D., Chambon P., et al. Characterization of the fasting-induced adipose factor FIAF, a novel peroxisome proliferator-activated receptor target gene. J. Biol. Chem. 2000;275:28488–28493. - PubMed
Publication types
MeSH terms
Substances
Grants and funding
LinkOut - more resources
Full Text Sources
Miscellaneous
