

Exercise training after myocardial infarction increases survival but does not prevent adverse left ventricle remodeling and dysfunction in high-fat diet fed mice
- PMID: 36372212
- PMCID: PMC9712172
- DOI: 10.1016/j.lfs.2022.121181
Exercise training after myocardial infarction increases survival but does not prevent adverse left ventricle remodeling and dysfunction in high-fat diet fed mice
Abstract
Aims: Aerobic exercise is an important component of rehabilitation after cardiovascular injuries including myocardial infarction (MI). In human studies, the beneficial effects of exercise after an MI are blunted in patients who are obese or glucose intolerant. Here, we investigated the effects of exercise on MI-induced cardiac dysfunction and remodeling in mice chronically fed a high-fat diet (HFD).
Main methods: C57Bl/6 male mice were fed either a standard (Chow; 21% kcal/fat) or HFD (60% kcal/fat) for 36 weeks. After 24 weeks of diet, the HFD mice were randomly subjected to an MI (MI) or a sham surgery (Sham). Following the MI or sham surgery, a subset of mice were subjected to treadmill exercise.
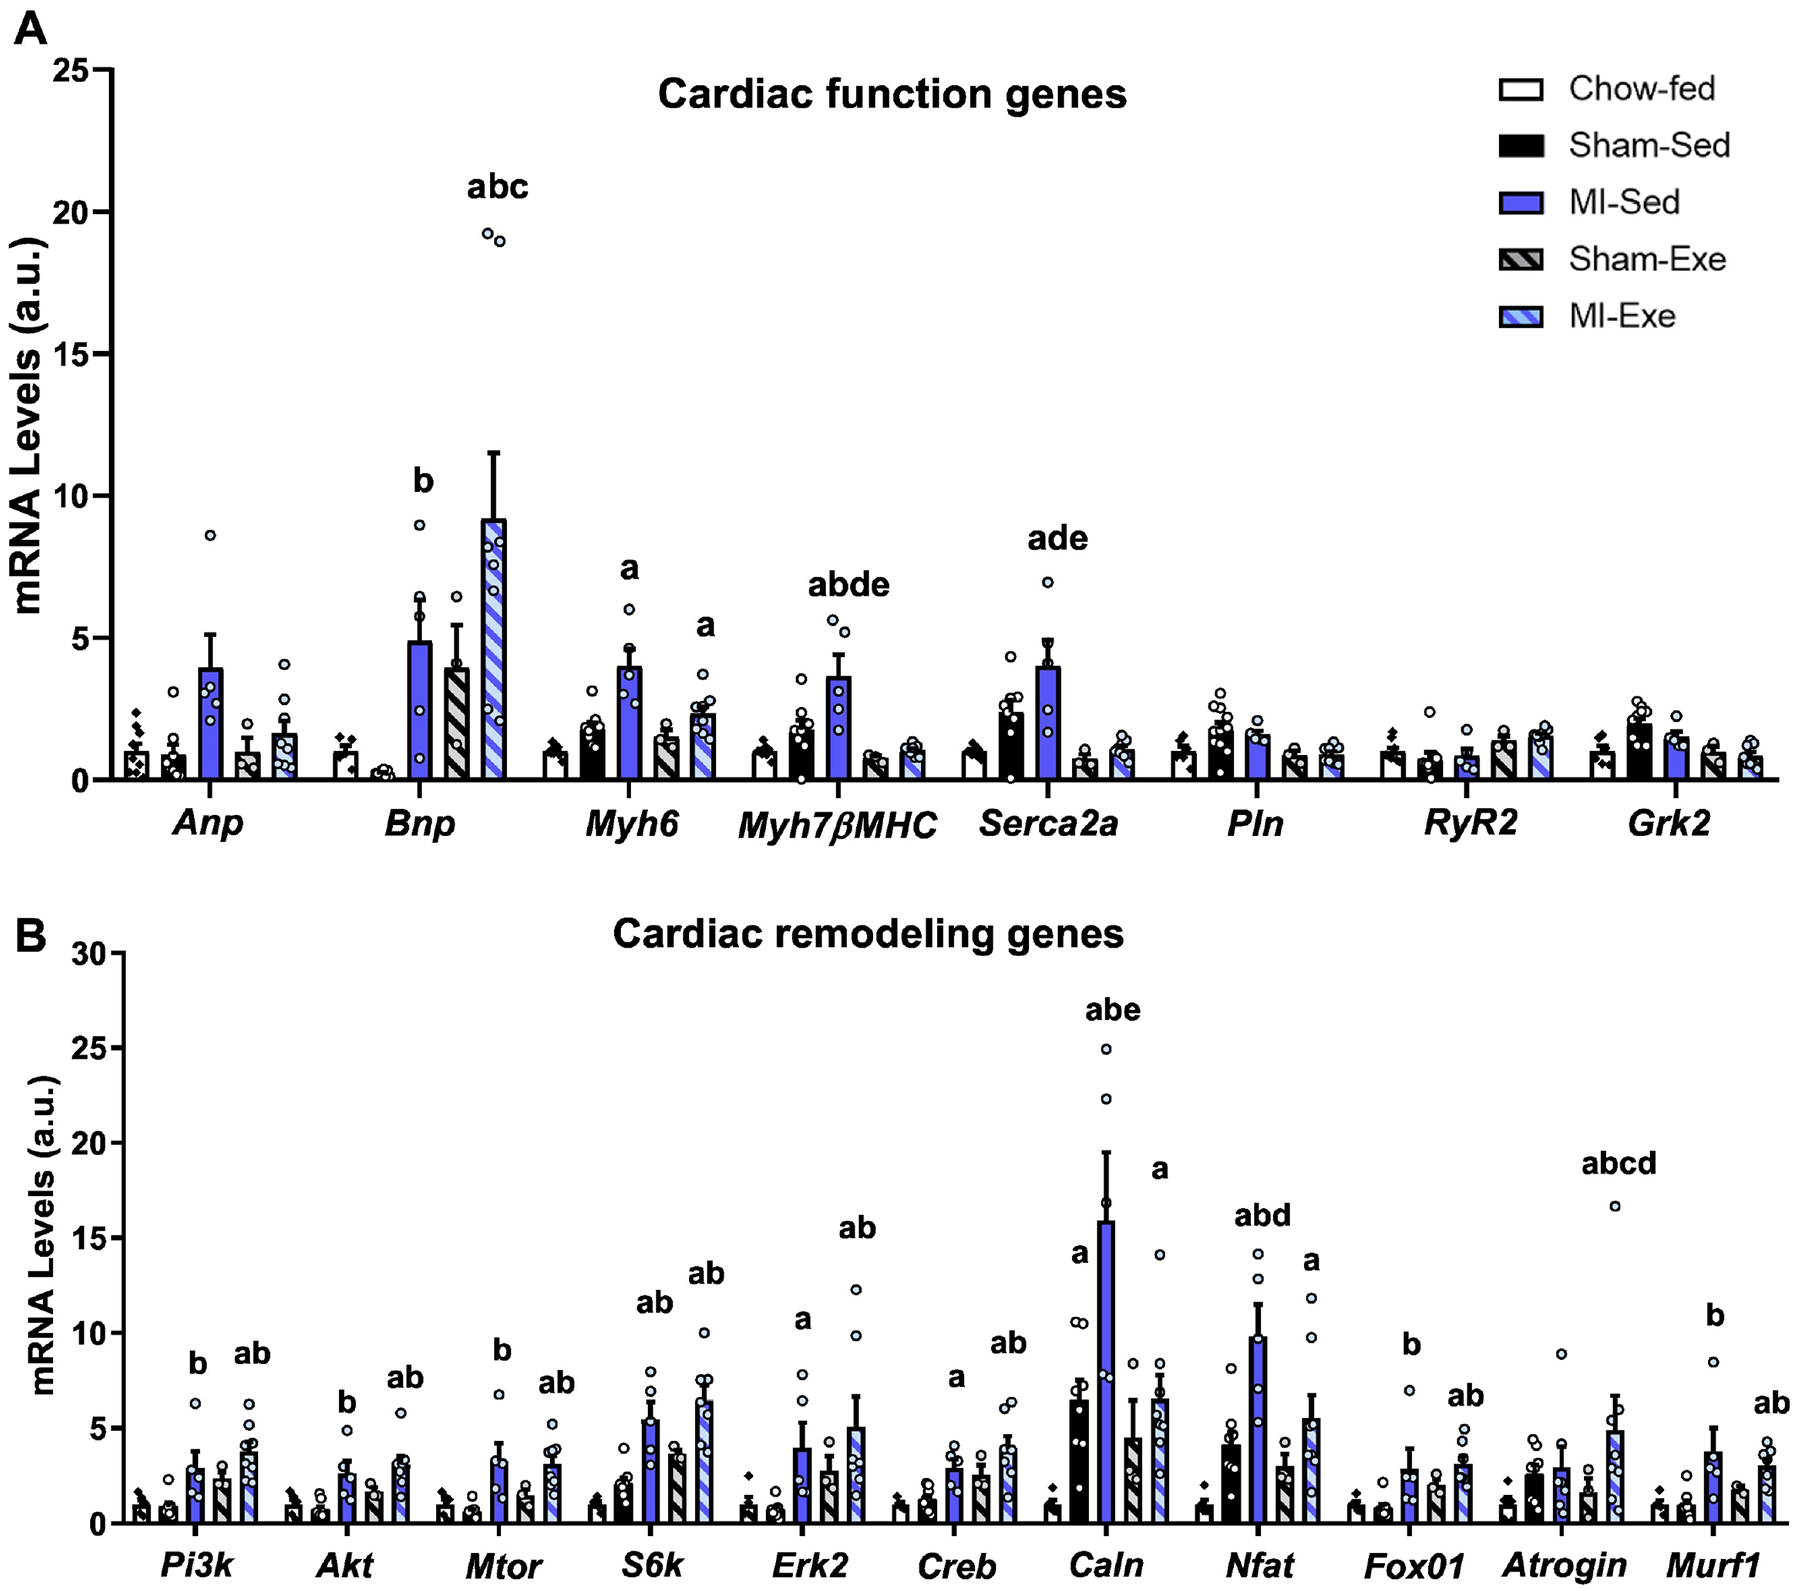
Key findings: HFD resulted in obesity and glucose intolerance, and this was not altered by exercise or MI. MI resulted in decreased ejection fraction, increased left ventricle mass, increased end systolic and diastolic diameters, increased cardiac fibrosis, and increased expression of genes involved in cardiac hypertrophy and heart failure in the MI-Sed and MI-Exe mice. Exercise prevented HFD-induced cardiac fibrosis in Sham mice (Sham-Exe) but not in MI-Exe mice. Exercise did, however, reduce post-MI mortality.
Significance: These data indicate that exercise significantly increased survival after MI in a model of diet-induced obesity independent of effects on cardiac function. These data have important translational ramifications because they demonstrate that environmental interventions, including diet, need to be carefully evaluated and taken into consideration to support the effects of exercise in the cardiac rehabilitation of patients who are obese.
Keywords: Exercise; Glucose intolerance; High-fat diet; Myocardial infarction; Obesity.
Copyright © 2022 The Authors. Published by Elsevier Inc. All rights reserved.
Conflict of interest statement
Declaration of competing interest The authors declare no conflicts of interest.
Figures


Similar articles
-
Brown adipose tissue prevents glucose intolerance and cardiac remodeling in high-fat-fed mice after a mild myocardial infarction.Int J Obes (Lond). 2022 Feb;46(2):350-358. doi: 10.1038/s41366-021-00999-9. Epub 2021 Oct 29. Int J Obes (Lond). 2022. PMID: 34716427 Free PMC article.
-
Aerobic exercise reduced the amount of CHRONO bound to BMAL1 and ameliorated glucose metabolic dysfunction in skeletal muscle of high-fat diet-fed mice.Life Sci. 2023 Jul 1;324:121696. doi: 10.1016/j.lfs.2023.121696. Epub 2023 Apr 13. Life Sci. 2023. PMID: 37061124
-
Interaction of Obesity and Hypertension on Cardiac Metabolic Remodeling and Survival Following Myocardial Infarction.J Am Heart Assoc. 2021 Mar 16;10(6):e018212. doi: 10.1161/JAHA.120.018212. Epub 2021 Mar 5. J Am Heart Assoc. 2021. PMID: 33666098 Free PMC article.
-
Clinical aspects of left ventricular diastolic function assessed by Doppler echocardiography following acute myocardial infarction.Dan Med Bull. 2001 Nov;48(4):199-210. Dan Med Bull. 2001. PMID: 11767125 Review.
-
The effects of different initiation time of exercise training on left ventricular remodeling and cardiopulmonary rehabilitation in patients with left ventricular dysfunction after myocardial infarction.Disabil Rehabil. 2016;38(3):268-76. doi: 10.3109/09638288.2015.1036174. Epub 2015 Apr 17. Disabil Rehabil. 2016. PMID: 25885667 Review.
Cited by
-
Post-myocardial infarction fibrosis: Pathophysiology, examination, and intervention.Front Pharmacol. 2023 Mar 28;14:1070973. doi: 10.3389/fphar.2023.1070973. eCollection 2023. Front Pharmacol. 2023. PMID: 37056987 Free PMC article. Review.
-
Gestational Intermittent Hypoxia Impairs AT2R-Mediated Vascular Protection in Female Offspring on a High-Fat, High-Sucrose Diet.J Biotechnol Biomed. 2024;7(2):264-276. doi: 10.26502/jbb.2642-91280150. Epub 2024 Jun 14. J Biotechnol Biomed. 2024. PMID: 39036336 Free PMC article.
-
12,13-diHOME protects against the age-related decline in cardiovascular function via attenuation of CaMKII.Nat Commun. 2025 Aug 2;16(1):7088. doi: 10.1038/s41467-025-62474-7. Nat Commun. 2025. PMID: 40751044 Free PMC article.
References
-
- Hales CM, Carroll MD, Fryar CD, Ogden CL. Prevalence of Obesity and Severe Obesity Among Adults: United States, 2017–2018. NCHS Data Brief. 2020(360):1–8. - PubMed
-
- Kragelund C, Hassager C, Hildebrandt P, Torp-Pedersen C, Køber L. Impact of obesity on long-term prognosis following acute myocardial infarction. Int J Cardiol. 2005;98(1):123–31. - PubMed
-
- Haffner SM, Lehto S, Rönnemaa T, Pyörälä K, Laakso M. Mortality from coronary heart disease in subjects with type 2 diabetes and in nondiabetic subjects with and without prior myocardial infarction. N Engl J Med. 1998;339(4):229–34. - PubMed
Publication types
MeSH terms
Grants and funding
LinkOut - more resources
Full Text Sources
Medical
