. 2022 Dec;298(12):102663.
doi: 10.1016/j.jbc.2022.102663. Epub 2022 Nov 11.

Role of the membrane anchor in the regulation of Lck activity

Affiliations

Role of the membrane anchor in the regulation of Lck activity

Nicla Porciello et al. J Biol Chem. 2022 Dec.

Abstract

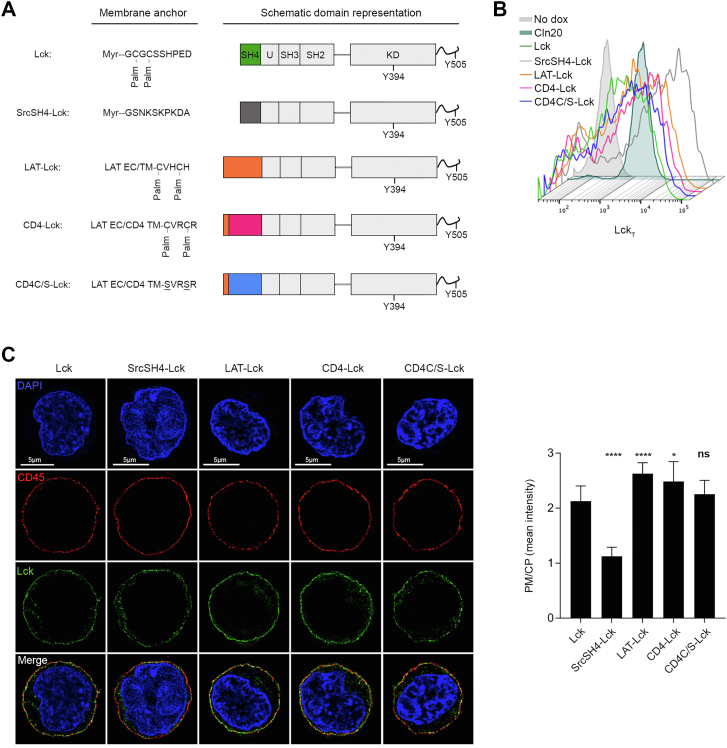
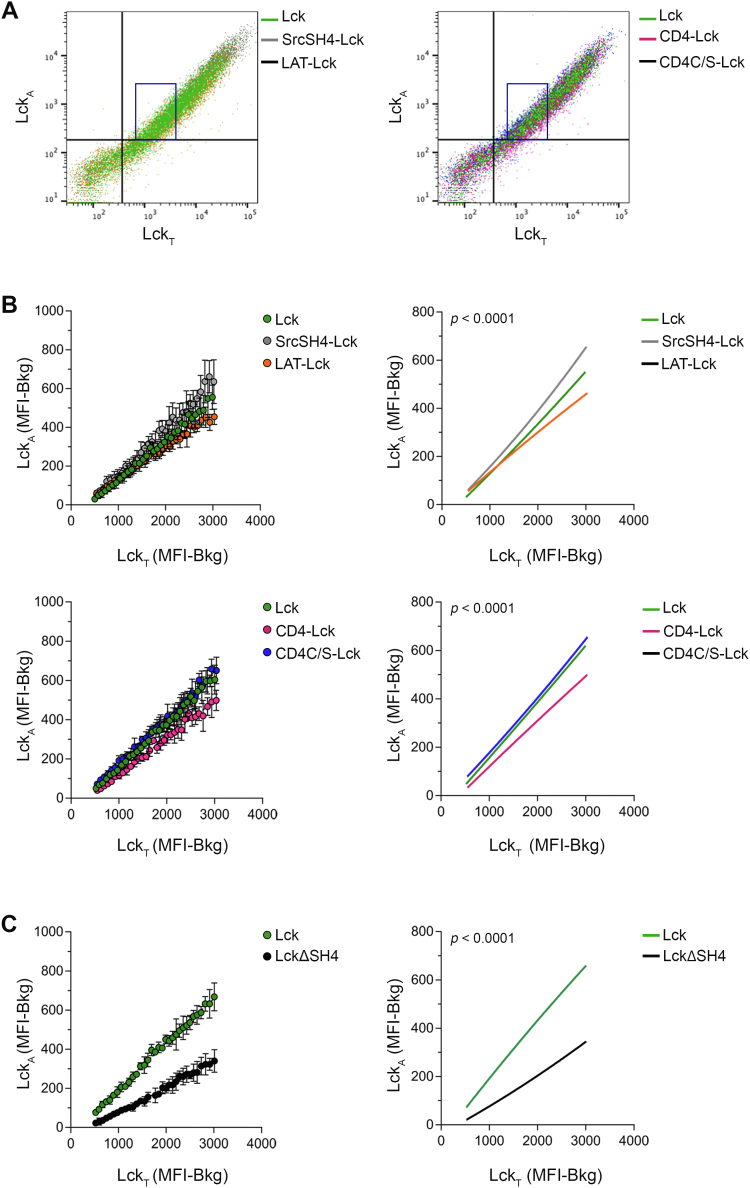
Theoretical work suggests that collective spatiotemporal behavior of integral membrane proteins should be modulated by boundary lipids sheathing their membrane anchors. Here, we show evidence for this prediction while investigating the mechanism for maintaining a steady amount of the active form of integral membrane protein Lck kinase (LckA) by Lck trans-autophosphorylation regulated by the phosphatase CD45. We used super-resolution microscopy, flow cytometry, and pharmacological and genetic perturbation to gain insight into the spatiotemporal context of this process. We found that LckA is generated exclusively at the plasma membrane, where CD45 maintains it in a ceaseless dynamic equilibrium with its unphosphorylated precursor. Steady LckA shows linear dependence, after an initial threshold, over a considerable range of Lck expression levels. This behavior fits a phenomenological model of trans-autophosphorylation that becomes more efficient with increasing LckA. We then challenged steady LckA formation by genetically swapping the Lck membrane anchor with structurally divergent ones, such as that of Src or the transmembrane domains of LAT, CD4, palmitoylation-defective CD4 and CD45 that were expected to drastically modify Lck boundary lipids. We observed small but significant changes in LckA generation, except for the CD45 transmembrane domain that drastically reduced LckA due to its excessive lateral proximity to CD45. Comprehensively, LckA formation and maintenance can be best explained by lipid bilayer critical density fluctuations rather than liquid-ordered phase-separated nanodomains, as previously thought, with "like/unlike" boundary lipids driving dynamical proximity and remoteness of Lck with itself and with CD45.

Keywords: CD45; Lck; boundary lipids; membrane anchor; membrane lateral organization.


Conflict of interest statement

Conflict of interest The authors declare no competing interests.

Figures

Figure 1
Figure 1
Dynamic maintenance of the LckApool. A, schematics of the generation and maintenance of Lck isoforms at the PM. From left to right: inactive (LckI), primed (LckP), active (LckA), active-double phosphorylated (LckADP). CD45 is in large stoichiometric excess (>>) over Lck. B, Left, 3D-SIM of Lck (green) in CD4+ T cells or JCaM1.6 cells expressing Lck or LckΔSH4. Scale bars (white). PM and nucleus are neatly defined by CD45 (red) and DAPI staining (blue), respectively. Right, histograms of the ratio of Lck or LckΔSH4 amounts detected at PM and in CP (PM/CP). Error bars: SD for n ≥ 10 cells of three or more independent experiments. Unpaired t test: p > 0.5 (non-significant, ns) for CD4+ T cells versus JCaM1.6-Lck; ∗∗∗∗ p < 0.0001 for CD4+ T cells versus LckΔSH4. CLeft, 3D-SIM of pY394-Lck (green) in CD4+ T cells or in JCaM1.6 expressing Lck. Right, histograms of PM/CP ratio of pY394 in CD4+ T cells or in JCaM1.6 expressing Lck. Error bars: SD for n ≥ 10 cells from three or more independent experiments. Unpaired t test, ∗∗∗∗ p < 0.0001. D, Left, representative FCM of LckA in Cln20 cells treated (red) with 2 μM A770041 or carrier (DMSO, blue) at 37 °C for 30 s or 5 min. JCaM1.6 (gray), negative control to set pY416 antibody (Ab) background. Right, histogram of mean ± SD of LckA (% of inhibition), n = 3. Unpaired t test, ∗∗∗∗ p < 0.0001. E, Left, representative FCM of LckA in Clone 20 cells reacted (green) or not (blue) with 100 μM catalase-treated pervanadate (PV) at 37 °C for 1 min. JCaM1.6 (gray), negative control for pY416 Ab background. Right, histogram of mean ± SEM of LckA n = 2, unpaired t test, ∗∗ p < 0.01. F, Left, representative FCM of pY505-Lck in Jurkat cells treated (red) with 5 μM A770041 or carrier (DMSO, blue) at 37 °C for 5 min. JCaM1.6 (gray) negative control for pY505-Lck Ab background. Right, histogram of mean ± SD of LckA (% of inhibition), n = 4, unpaired t test, ∗∗∗∗ p < 0.0001. G, Left, 3D-SIM of pY505-Lck (green) in CD4+ T cells or in JCaM1.6 expressing Lck or LckΔSH4. Right, histogram of PM/CP ratio for pY505 in CD4+ T cells or in JCaM1.6 expressing Lck or LckΔSH4. Error bars: SD for n ≥ 10 cells from three or more independent experiments, p > 0.5 (non-significant, ns). 3D-SIM, 3D structured illumination microscopy; CP, cytoplasmic; FCM, flow cytometry; LckA, active form of Lck; PM, plasma membrane; LckΔSH4, Lck-lacking SH4.
Figure 2
Figure 2
LckAdependence on LckT. A, schematics of simultaneous detection of LckT and LckA by anti-Lck (73A5) Ab (red) and anti-pY416 Ab (blue), respectively by FCM. 73A5 Ab recognizes an epitope at Lck C-terminal sequence (Fig. S2A) displayed by LckI, LckP, and LckA (Fig. S2, B and C). Note that 73A5 and anti-pY416 Abs do not hinder each other’s binding (Fig. S2D). B, flow chart of the experimental procedure for assessing LckA dependence on LckT. Left, representative 2D FCM plot of Cln20 stained with LckA and LckT. Middle, Conversion of × (LckT) and y (LckA) axes from a logarithmic to a linear scale and a dense binning (n = 73) applied to LckT values in the LckT axes. Geometric median for LckA and LckT in each bin were calculated. Right, background-subtracted values of the geometric median for LckA and LckT in each bin were subjected to nonlinear regression analysis. Nonlinear regression fit of LckA (MFI - Bkg) versus LckT (MFI - Bkg), n = 2, R2 = 0.99; F-test p < 0.0001. C, reactions considered for the probabilistic model of LckA formation. The model refers to PM-resident Lck. Reaction (1) indicates the dominant effect of CD45 over Csk (as deduced by our data) to maintain low steady levels of LckP. PPA and PAA are the probabilities of generating LckA from the reactions: LckP + LckP and LckP + LckA, respectively. See Main Text and Experimental procedures for further details on the basis of the empirical model. D, the increase of LckA as a function of LckT obtained by changing at random PPA and PAA for reactions (2) and (3) showed in (C). The line of best fit of the empirical model of the experimental data was obtained for the values of PPA and PAA indicated in the inset. F-test p < 0.00001. E, schematics of the “Lck cycle” at the PM, where LckA is generated and maintained by the antagonism between CD45 and Lck for phosphorylation at Y394. LckI is rapidly dephosphorylated at Y505 by CD45 and converted into LckP. LckP in turn generates LckA by two independent reactions: LckP + LckP or LckA + LckP pair, as suggested in (C). The likelihood of LckA to be dephosphorylated or not by CD45 depends on the membrane lipid environment in which LckA dynamically resides. The gray halo represents a- Lo membrane nanodomain (or raft). Abs, antibodies; FCM, flow cytometry; Csk, C-terminal Src kinase; LckA, active form of Lck; MFI, median fluorescence intensity; PM, plasma membrane.
Figure 3
Figure 3
Subcellular distribution of Lck with nonnative membrane anchors. A, schematics of Lck or Lck chimeras employed in this investigation. B, representative FCM of LckT in Cln20 and JCaM1.6 cells conditionally expressing Lck or the indicated Lck chimeras. Uninduced cells were used to assess Ab background. C, Left, representative 3D-SIM imaging of Lck (green) in JCaM1.6 cells expressing the constructs showed in (A). CD45 (red) and DAPI (blue). Note that representative imaging for Lck is the same shown in Figure 1B, as it originates from the same independent experiment, see also Experimental procedures. Right, histograms PM/CP of Lck and Lck chimeras. Error bars: SD for n ≥ 10 cells from three or more independent experiments, unpaired t test: ∗∗∗∗ p < 0.0001 (Lck vs. SrcSH4-Lck); ∗∗∗∗ p < 0.0001 (Lck vs. LAT-Lck); ∗, p < 0.05 (Lck vs. CD4-Lck); p > 0.05; (non-significant, ns, Lck vs. CD4C/S-Lck). 3D-SIM, 3D structured illumination microscopy; CP, cytoplasmic; FCM, flow cytometry; PM, plasma membrane.
Figure 4
Figure 4
Moderate impact of different membrane anchors on LckAformation. A, representative 2D FCM plot of JCaM1.6 expressing Lck or Lck chimeras stained for LckA and LckT. The blue box represents the limits for LckA and LckT in Cln20. Left, FCM 2D plot of JCaM1.6 expressing Lck (green), SrcSH4-Lck (gray), or LAT-Lck (orange). Right, FCM 2D plot of JCaM1.6 expressing Lck (green), CD4-Lck (magenta), CD4C/S-Lck (blue). B, LckA formation depending on LckT of JCaM1.6 expressing Lck (green), SrcSH4-Lck (gray), LAT-Lck (orange), CD4-Lck (magenta), CD4C/S-Lck (blue). The indicated cells were labeled or not with two different concentrations of CellTrace violet, mixed 1:1:1, induced for Lck expression by dox and, 16 to 18 h after, concomitantly analyzed by FACS for LckA and LckT. A dense binning within a physiological concentration range of LckT set by using Cln20 was applied and the values of the geometric median for LckA and LckT in each bin were extracted. Upper left, 2D plot of the extracted experimental values of the geometric median for LckA and LckT in each bin in JCaM1.6 cells expressing Lck or the indicated Lck chimera. Upper right, nonlinear regression fit of LckA (MFI-Bkg) versus LckT (MFI-Bkg), n = 3, R2 = 0.99 (Lck), 0.99 (SrcSH4-Lck), 0.99 (LAT-Lck); F-test p < 0.0001. Bottom left, 2D plot of the extracted experimental values of the geometric median for LckA and LckT in each bin in JCaM1.6 cells expressing Lck or the indicated Lck chimera. Bottom right, nonlinear regression fit of LckA (MFI-Bkg) versus LckT (MFI-Bkg), n = 3, R 2= 0.99 (Lck), 0.99 (CD4-Lck), 0.99 (CD4C/S-Lck); F-test p < 0.0001. See also Fig. S4C. C, LckA formation depending on LckT of JCaM1.6 expressing Lck (green) or LckΔSH4 (black). Cells were treated and data processed as in (B). Left, 2D plot of the extracted experimental values of the geometric median for LckA and LckT in each bin in JCaM1.6 cells expressing Lck or or LckΔSH4. Right, nonlinear regression fit of LckA (MFI-Bkg) versus LckT (MFI-Bkg), n = 3, R2 = 0.99 (Lck), 0.99 (LckΔSH4); F-test p < 0.0001. See also Fig. S4D. FCM, flow cytometry; LckA, active form of Lck; LckΔSH4, Lck-lacking SH4; MFI, median fluorescence intensity.
Figure 5
Figure 5
Impact of Lck membrane anchor on lateral interactions. A, schematic representation of CD45-Lck chimera compared to Lck. B, Left, representative 3D-SIM imaging of Lck (green) in JCaM1.6 cells expressing Lck or CD45-Lck. CD45 (red), DAPI (blue). Please note that representative imaging for Lck is the same shown in Figure 1B, as it originates from the same independent experiment, see also Experimental procedures. Right, PM/CP for Lck of the indicated Lck constructs. Error bars: SD for n ≥ 10 cells from three or more independent experiments, unpaired t test: ∗∗∗ p < 0.001 (Lck vs. CD45-Lck). C, LckA formation depending on LckT of JCaM1.6 expressing Lck (green), CD45-Lck (cyan), or LckΔSH4 (black). The indicated cells were labeled or not with two different concentrations of CellTrace violet, mixed 1:1:1, induced for Lck expression by dox and, 16 to 18 h after, concomitantly analyzed by FACS for LckA and LckT. A dense binning within a physiological concentration range of LckT set on Cln20 (blue box) was applied and the values of the geometric median for LckA and LckT in each bin were extracted. Left, 2D plot of the extracted experimental values of the geometric median for LckA and LckT in each bin in JCaM1.6 cells expressing Lck or the indicated Lck chimera or mutant. Right, Nonlinear regression fit of LckA (MFI - Bkg) versus LckT (MFI - Bkg), n = 3, R2 = 0.99 (Lck), 0.99 (CD45-Lck), 0.99 (LckΔSH4); F-test, p < 0.0001. See also Fig. S5B. Note that 2D plot and relative nonlinear regression fit for Lck and LckΔSH4 are the same shown in Figure 4C, as they originate from the same experiments where the three cell lines (JCaM1.6 expressing Lck, CD45-Lck, or LckΔSH4) where barcoded and analyzed together. D, increase of LckA of JCaM1.6 expressing Lck, CD45-Lck, or LckΔSH4 treated or not with 100 μM pervanadate (PV) at 37 °C for 3 min. Bars indicate mean ± SEM of LckA/LckT, n = 2, unpaired t test, ∗ p < 0.05 (Lck vs. CD45-Lck) and ∗∗ p < 0.01 (Lck vs. LckΔSH4). E, schematic representation of CD45 dephosphorylation ability of LckA for native Lck or CD45-Lck. (I) LckA generated by trans-autophosphorylation at the PM is partially reverted to LckP by CD45. (II) Inhibiting CD45 enzymatic activity by PV results in higher level of LckA. (III) CD45-Lck chimera shares the same anchoring of the CD45 phosphatase and experiences augmented proximity to CD45 resulting in dramatic reduction of LckA (thicker arrow of LckA reversion to Lckp). Note that Y394 trans-autophosphorylation should remain intact. (IV) PV rescues LckA upkeep to WT level indicating that CD45-Lck can form LckA with similar capacity as native Lck. 3D-SIM, 3D structured illumination microscopy; CP, cytoplasmic; PM, plasma membrane; MFI, median fluorescence intensity; LckΔSH4, Lck-lacking SH4; LckA, active form of Lck.
Figure 6
Figure 6
Schematic depiction of lateral proximity of Lck and CD45 dependent on lipid fingerprint. Specific boundary lipids codiffusing with the membrane anchor the “lipid fingerprint” of each protein. Different boundary lipids create energetic barriers that reduce the probability of lateral proximity. Bottom, Identical boundary lipids (light gray circle surrounding Lck - green) favor. Lck ⇔ Lck interaction. Different annular lipids (dark gray squares surrounding CD45 - black) do not veto CD45 ⇔ Lck interaction but make it less favorable. CD45 ⇔ CD45 interaction may be functionally inconsequential. (Top) “Lipid fingerprints” for CD45 and Lck are idealized by lipids of different aliphatic chain length and/or saturation but can be further diversified by hydrophobic mismatch and charged lipid heads.

Similar articles

Cited by

References

    1. Lee A.G. Biological membranes: the importance of molecular detail. Trends Biochem. Sci. 2011;36:493–500. - PubMed
    1. Marsh D. Protein modulation of lipids, and vice-versa, in membranes. Biochim. Biophys. Acta. 2008;1778:1545–1575. - PubMed
    1. Gupta K., Li J., Liko I., Gault J., Bechara C., Wu D., et al. Identifying key membrane protein lipid interactions using mass spectrometry. Nat. Protoc. 2018;13:1106–1120. - PMC - PubMed
    1. Marrink S.J., Corradi V., Souza P.C.T., Ingolfsson H.I., Tieleman D.P., Sansom M.S.P. Computational modeling of realistic cell membranes. Chem. Rev. 2019;119:6184–6226. - PMC - PubMed
    1. Mouritsen O.G., Bloom M. Mattress model of lipid-protein interactions in membranes. Biophys. J. 1984;46:141–153. - PMC - PubMed

Publication types

MeSH terms

Substances