

Dispersion of free-falling saliva droplets by two-dimensional vortical flows
- PMID: 36373071
- PMCID: PMC9638496
- DOI: 10.1007/s00162-022-00633-y
Dispersion of free-falling saliva droplets by two-dimensional vortical flows
Abstract
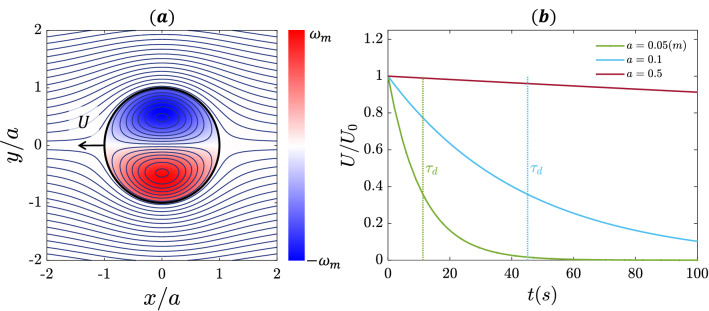
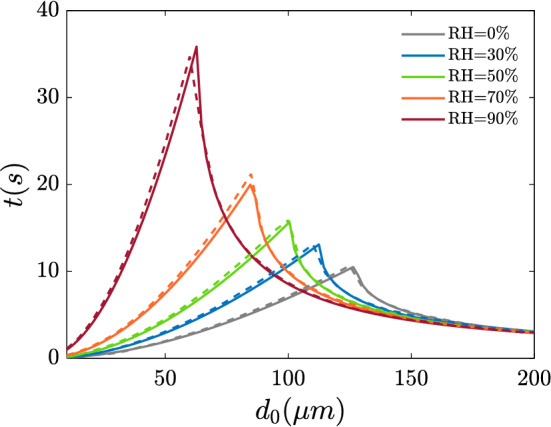
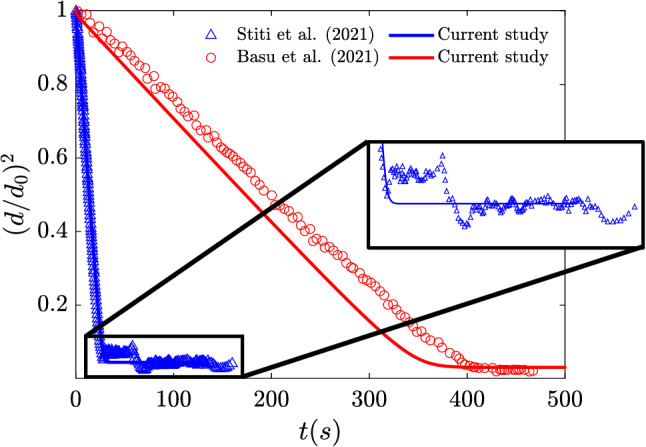
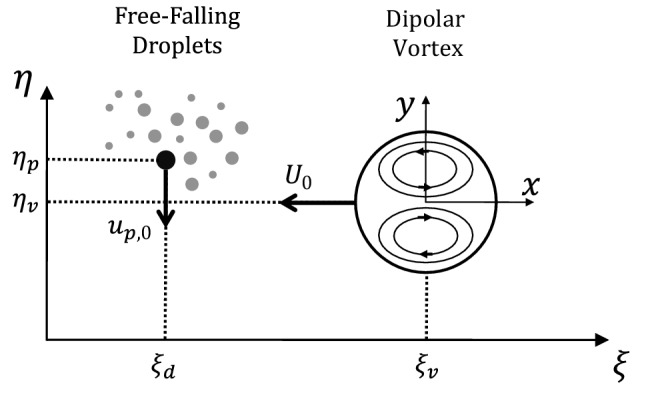
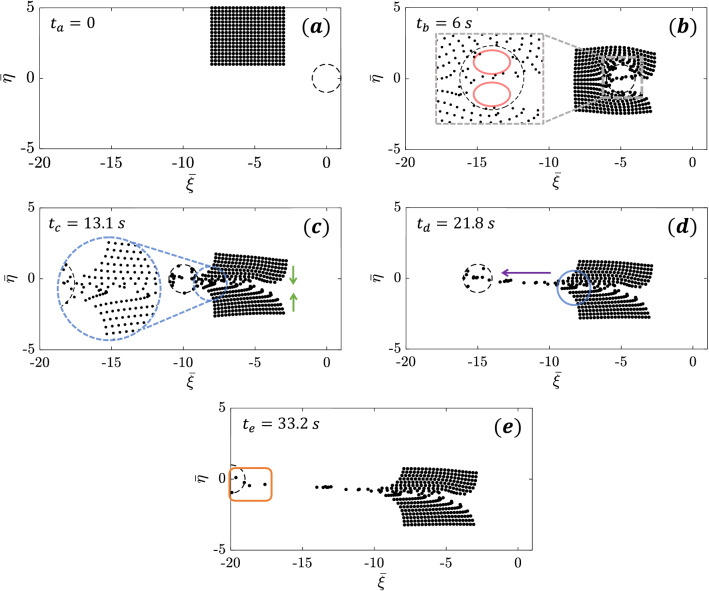
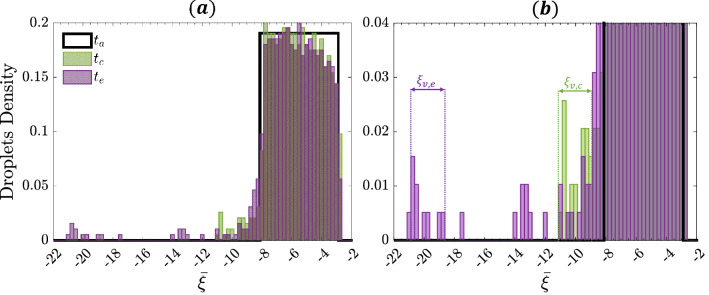
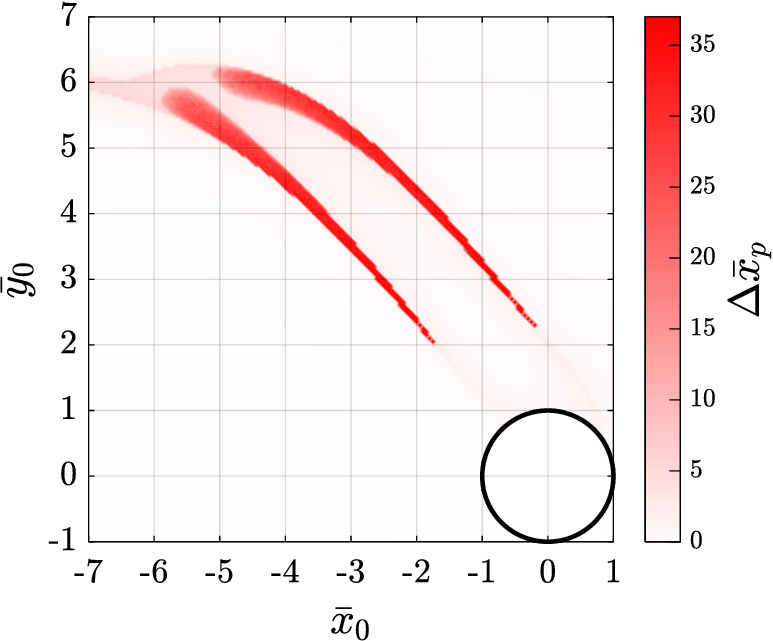
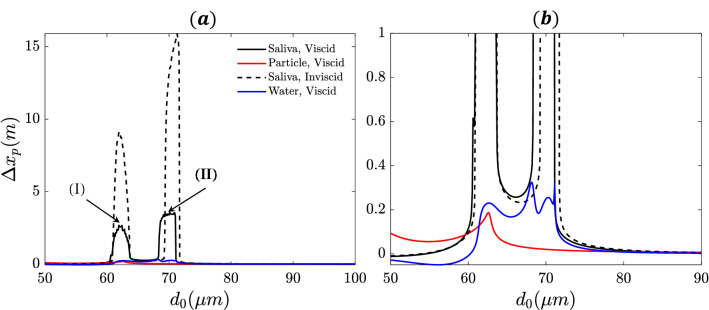
Abstract: The dispersion of respiratory saliva droplets by indoor wake structures may enhance the transmission of various infectious diseases, as the wake spreads virus-laden droplets across the room. Thus, this study analyzes the interaction between vortical wake structures and exhaled multi-component saliva droplets. A self-propelling analytically described dipolar vortex is chosen as a model wake flow, passing through a cloud of micron-sized evaporating saliva droplets. The droplets' spatial location, velocity, diameter, and temperature are traced, coupled to their local flow field. For the first time, the wake structure decay is incorporated and analyzed, which is proved essential for accurately predicting the settling distances of the dispersed droplets. The model also considers the nonvolatile saliva components, adequately capturing the essence of droplet-aerosol transition and predicting the equilibrium diameter of the residual aerosols. Our analytic model reveals non-intuitive interactions between wake flows, droplet relaxation time, gravity, and transport phenomena. We reveal that given the right conditions, a virus-laden saliva droplet might translate to distances two orders of magnitude larger than the carrier-flow characteristic size. Moreover, accounting for the nonvolatile contents inside the droplet may lead to fundamentally different dispersion and settling behavior compared to non-evaporating particles or pure water droplets. Ergo, we suggest that the implementation of more complex evaporation models might be critical in high-fidelity simulations aspiring to assess the spread of airborne respiratory droplets.
Keywords: Droplet evaporation; Lamb–Chaplygin dipole; Wake flows.
© The Author(s), under exclusive licence to Springer-Verlag GmbH Germany, part of Springer Nature 2022, Springer Nature or its licensor (e.g. a society or other partner) holds exclusive rights to this article under a publishing agreement with the author(s) or other rightsholder(s); author self-archiving of the accepted manuscript version of this article is solely governed by the terms of such publishing agreement and applicable law.
Conflict of interest statement
Conflict of interestThe authors declare that they have no conflict of interest.
Figures
Similar articles
-
Insights into the evaporation characteristics of saliva droplets and aerosols: Levitation experiments and numerical modeling.J Aerosol Sci. 2021 May;154:105760. doi: 10.1016/j.jaerosci.2021.105760. Epub 2021 Jan 22. J Aerosol Sci. 2021. PMID: 33518792 Free PMC article.
-
How far droplets can move in indoor environments--revisiting the Wells evaporation-falling curve.Indoor Air. 2007 Jun;17(3):211-25. doi: 10.1111/j.1600-0668.2007.00469.x. Indoor Air. 2007. PMID: 17542834
-
Some questions on dispersion of human exhaled droplets in ventilation room: answers from numerical investigation.Indoor Air. 2010 Apr;20(2):95-111. doi: 10.1111/j.1600-0668.2009.00626.x. Epub 2009 Sep 24. Indoor Air. 2010. PMID: 20002792
-
Virus-laden droplet nuclei in vortical structures associated with recirculation zones in indoor environments: A possible airborne transmission of SARS-CoV-2.Environ Adv. 2023 Jul;12:100376. doi: 10.1016/j.envadv.2023.100376. Epub 2023 May 6. Environ Adv. 2023. PMID: 37193349 Free PMC article. Review.
-
Mechanisms controlling the transport and evaporation of human exhaled respiratory droplets containing the severe acute respiratory syndrome coronavirus: a review.Environ Chem Lett. 2023;21(3):1701-1727. doi: 10.1007/s10311-023-01579-1. Epub 2023 Feb 22. Environ Chem Lett. 2023. PMID: 36846189 Free PMC article. Review.
Cited by
-
Investigation of bimodal characteristics of the droplet size distribution in condensation spray.Sci Rep. 2023 Jul 25;13(1):12006. doi: 10.1038/s41598-023-39087-5. Sci Rep. 2023. PMID: 37491517 Free PMC article.
References
-
- Organization, W.H.: Roadmap to improve and ensure good indoor ventilation in the context of COVID-19
-
- Chen W, Zhang N, Wei J, Yen HL, Li Y. Short-range airborne route dominates exposure of respiratory infection during close contact. Build. Environ. 2020;176:106859. doi: 10.1016/j.buildenv.2020.106859. - DOI
LinkOut - more resources
Full Text Sources