. 2022 Dec 22;25(12):105507.
doi: 10.1016/j.isci.2022.105507. Epub 2022 Nov 5.

Enhanced virulence and waning vaccine-elicited antibodies account for breakthrough infections caused by SARS-CoV-2 delta and beyond

Affiliations

Enhanced virulence and waning vaccine-elicited antibodies account for breakthrough infections caused by SARS-CoV-2 delta and beyond

Hyung-Joon Kwon et al. iScience. .

Abstract

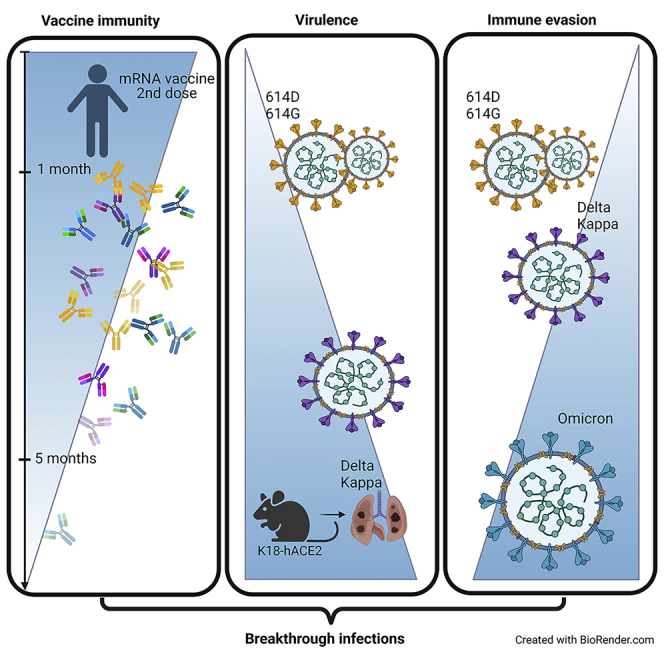
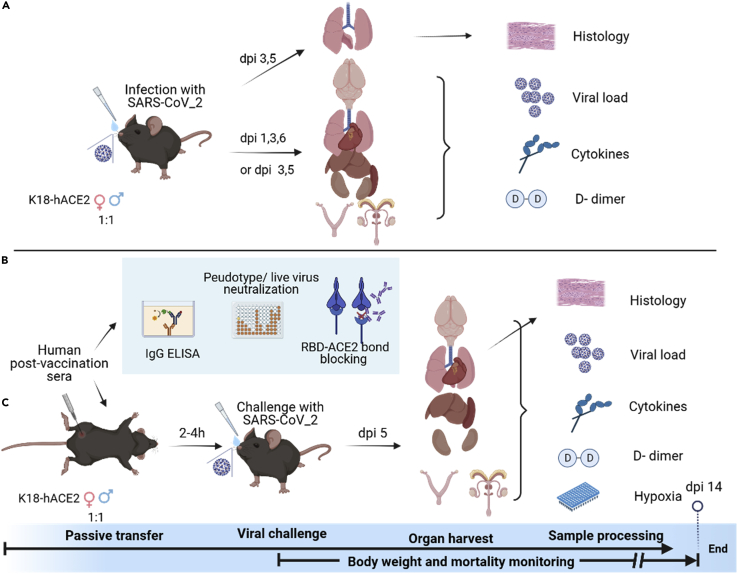
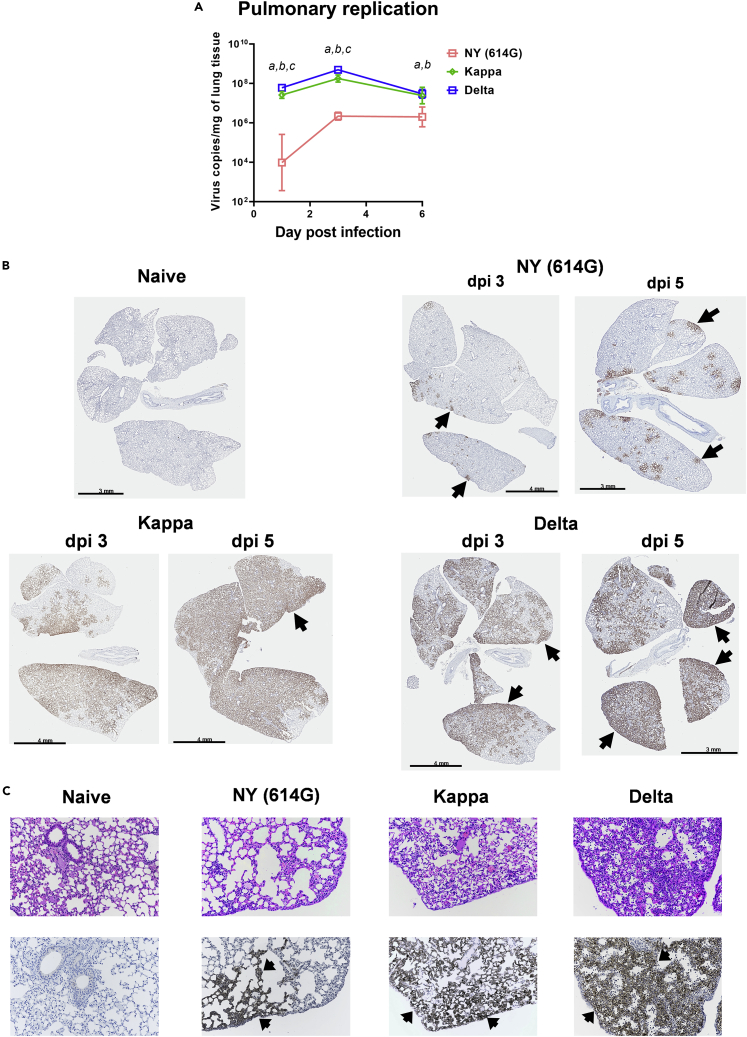
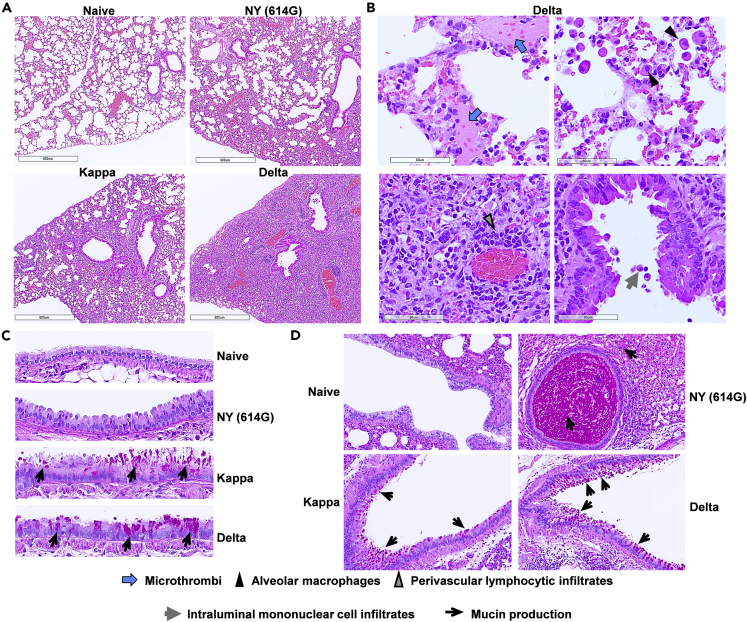
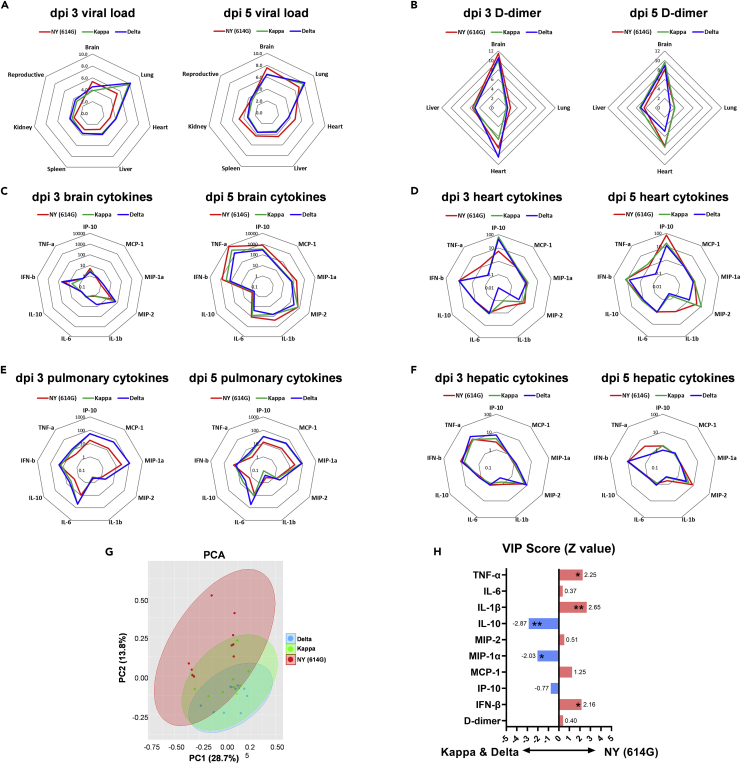
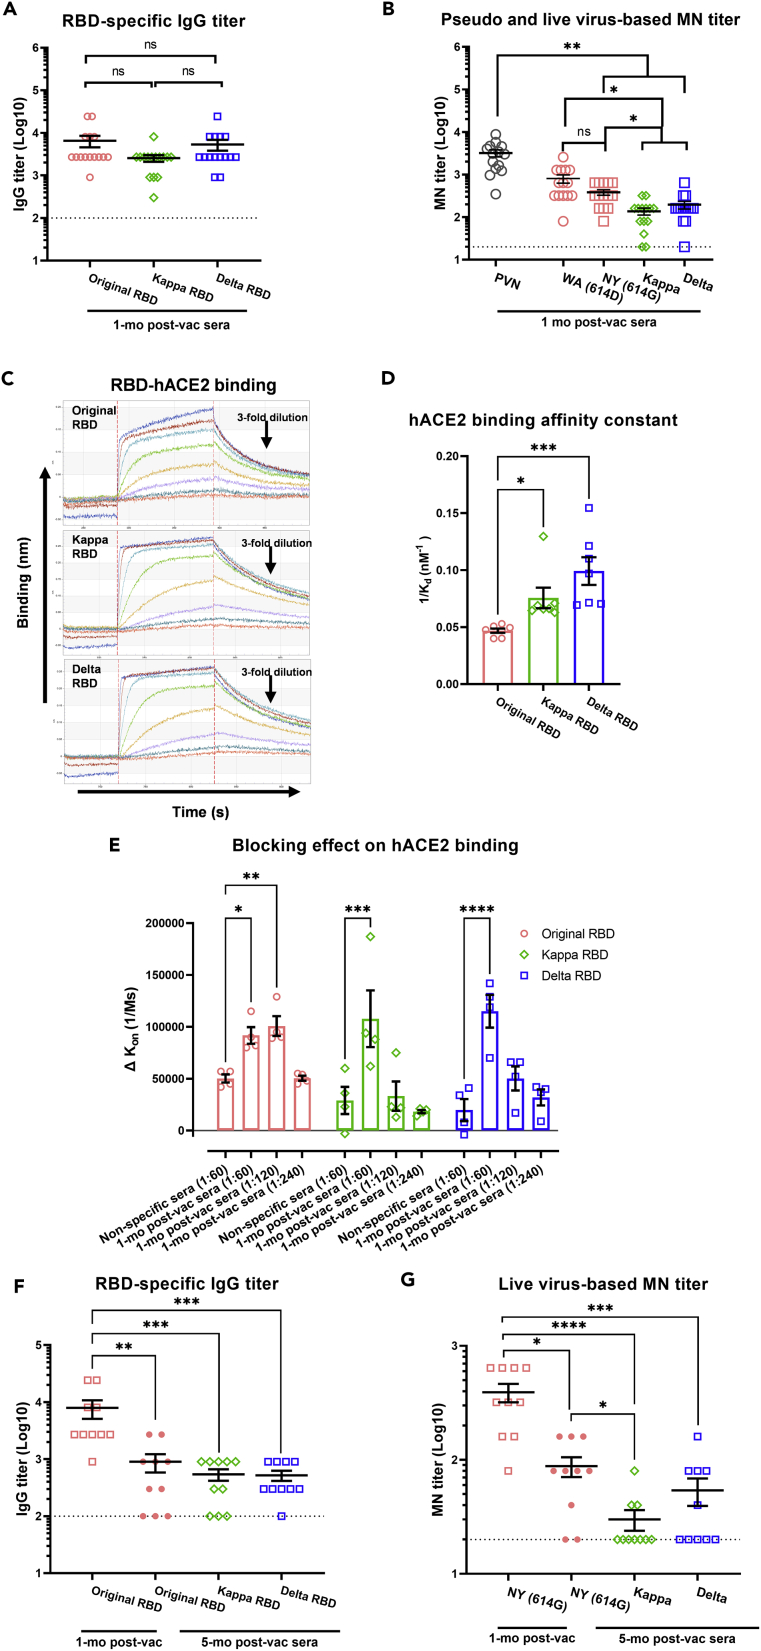
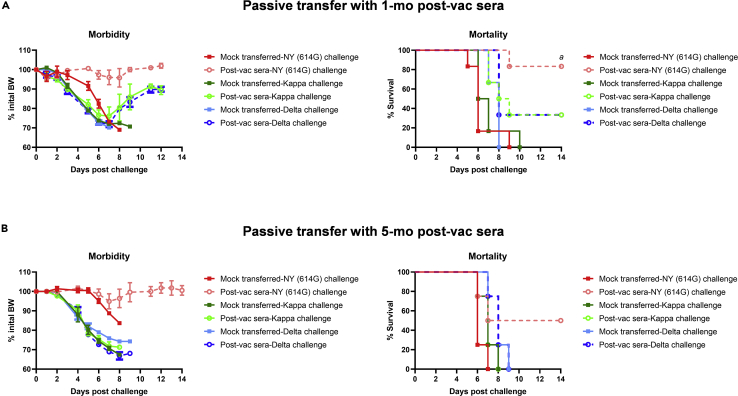
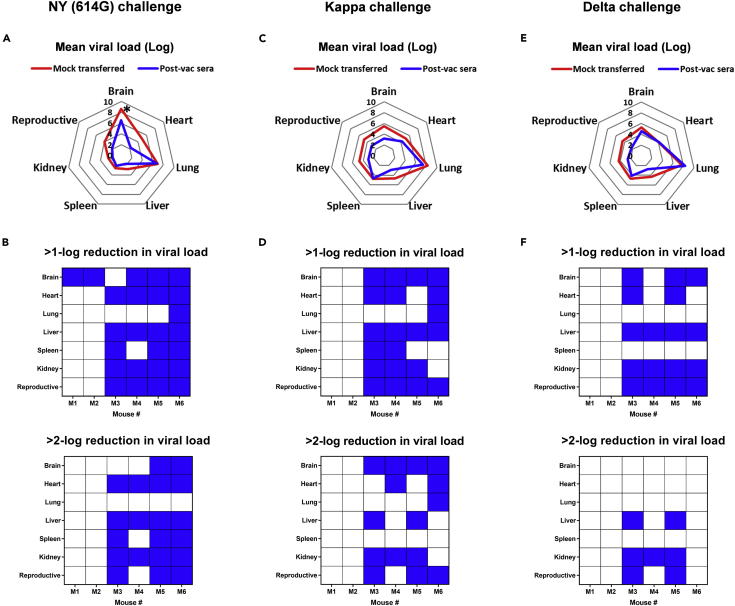
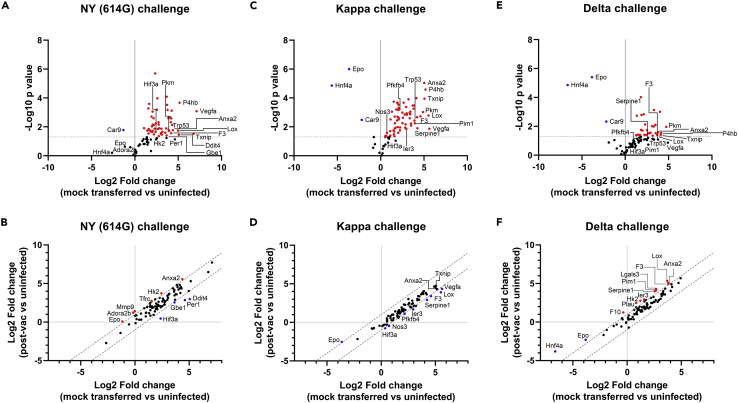
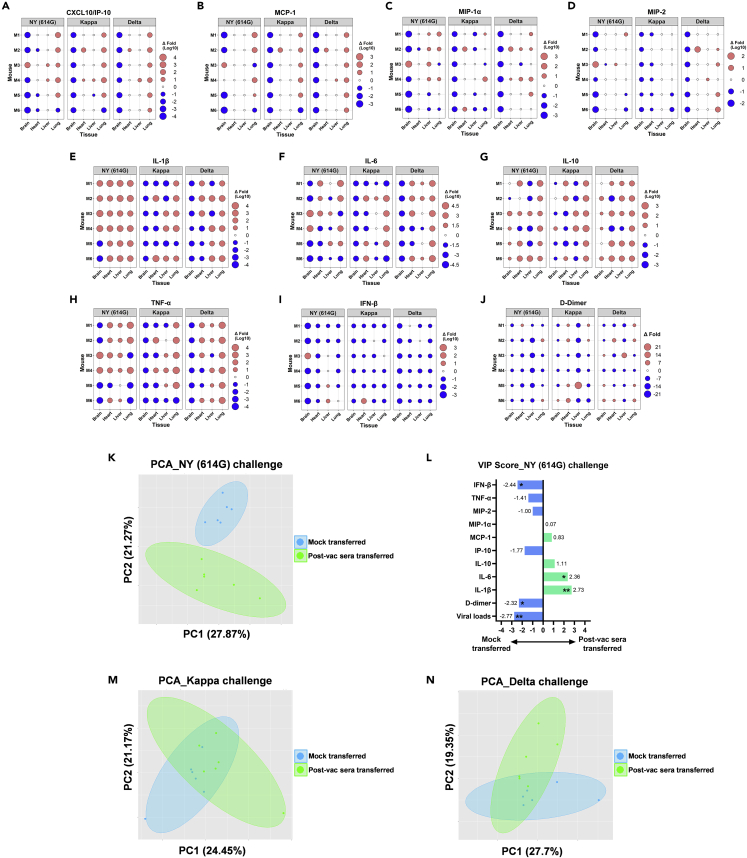
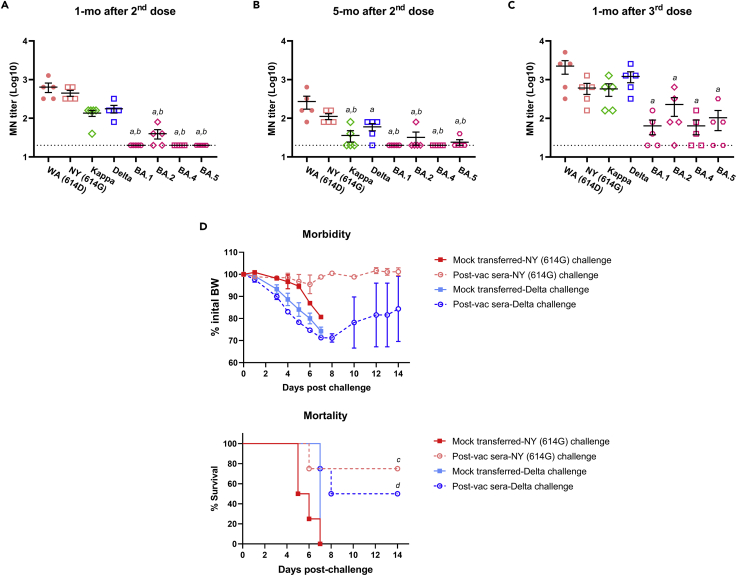
Here we interrogate the factors responsible for SARS-CoV-2 breakthrough infections in a K18-hACE2 transgenic mouse model. We show that Delta and the closely related Kappa variant cause viral pneumonia and severe lung lesions in K18-hACE2 mice. Human COVID-19 mRNA post-vaccination sera after the 2nd dose are significantly less efficient in neutralizing Delta/Kappa than early 614G virus in vitro and in vivo. By 5 months post-vaccination, ≥50% of donors lack detectable neutralizing antibodies against Delta and Kappa and all mice receiving 5-month post-vaccination sera die after the lethal challenges. Although a 3rd vaccine dose can boost antibody neutralization against Delta in vitro and in vivo, the mean log neutralization titers against the latest Omicron subvariants are 1/3-1/2 of those against the original 614D virus. Our results suggest that enhanced virulence, greater immune evasion, and waning of vaccine-elicited protection account for SARS-CoV-2 variants caused breakthrough infections.

Keywords: Immune response; Immunology; Virology.


Conflict of interest statement

The authors have no competing interests to declare.

Figures

None
Graphical abstract
Figure 1
Figure 1
Schematic overview of in vivo and in vitro experiments (A) Schematic diagram of experiments conducted on K18-hACE2 transgenic mice (female vs male, approximately 1:1 ratio) infected with SARS-CoV-2 New York-PV09158/2020 (NY (614G)) strain or Kappa or Delta variant. Lungs were collected on various days post-infection (dpi) for histopathology evaluation. Organs from separate sets of infected mice were harvested for tissue-specific viral loads, cytokine responses, and D-dimer deposition. (B) Schematic drawing of in vitro characterization of human COVID-19 post-vaccination sera, including IgG titer by ELISA, neutralization capacity using pseudovirus or live infectious viruses, and blocking RBD-ACE2 binding using bio-layer interferometry (BLI). (C) Schematic diagram of passive transfer experiments. Naive K18-hACE2 transgenic mice (female vs male, approximately 1:1 ratio) were injected intraperitonially with human COVID-19 post-vaccination sera followed by the lethal challenge of with SARS-CoV-2 614G strain or Kappa or Delta variant. Various organs were harvested on dpi 5 for tissue-specific viral loads, cytokines, and D-dimer measurements. Lungs from separate sets of mice were collected for histopathology and hypoxia PCR array.
Figure 2
Figure 2
Lung histopathology staining after SARS-CoV-2 infection K18-hACE2 mice were infected intranasally with live New York-PV09158/2020 (NY (614G)), Kappa or Delta variant at 102 TCID50/mouse. (A) Pulmonary virus replication kinetics (geometric mean ± geometric SD of 4 mice/time point/group, female vs male at 1:1 ratio). Viral loads on 1, 3, and 6 days post-infection (dpi) were log transformed before two-way mixed ANOVA. a (Kappa vs NY (614G)), b (Delta vs NY (614G)), and c (Delta vs Kappa) indicate p < 0.05 at the same time point. Separate sets of infected mice were euthanized on dpi 3 and 5 and lungs were harvested for immunohistochemical (IHC) staining using rabbit polyclonal antibody specific for SARS-CoV-2 N/M/E. The same lung blocks were also sectioned for hematoxylin and eosin (H&E) staining. Representative images of lung pathology slides processed from 5 mice/virus/time point are shown. (B). IHC of naïve mouse lung, or mouse lungs infected with NY (614G), Kappa or Delta variant on dpi 3 and 5. (C) H&E and IHC staining (20X magnification) of the same lung sections from naïve mice or mice infected with NY (614G), Kappa or Delta variant on dpi 3. Brownish staining indicates positive SARS CoV2 antigen staining (arrows).
Figure 3
Figure 3
Histological changes in lung parenchyma of K18-hACE2 mice infected with SARS-CoV-2 and variants K18-hACE2 mice were infected intranasally with 103 TCID50/mouse of New York-PV09158/2020 (NY (614G)), or 102 TCID50/mouse of Kappa and Delta variants. Whole lungs were harvested on 6 days post-infection. Lung tissues embedded in paraffin were sectioned for hematoxylin and eosin (H&E) staining and for Periodic acid-Schiff (PAS) staining for mucin. Uninfected mouse lungs were stained in parallel as negative controls. Representative lung H&E images (A and B) and PAS staining (c & d) of 6 mice/virus processed are shown. (A) Low magnification (bar = 600 μm) of H&E stained sections show increased cellular infiltrates in NY (614G), Kappa and Delta-infected lung tissues compared to naïve lung. (B) Higher magnification (bar = 60 μm) of H&E stained sections show micro-thrombi-like lesions (blue arrows), infiltrating alveolar macrophages (black triangles, upper right), perivascular lymphocytic infiltrates (gray triangles, lower left) and intraluminal mononuclear cell infiltrates in the bronchiole tube lined predominately with club cells (gray arrows, lower right). (C) PAS staining (40X magnification) shows increased mucin (black arrows) in Kappa- and Delta-infected lungs as compared to naïve and NY (614G)-infected lungs. (D) PAS staining (10X magnification) shows mucin secretion by goblet cells in Kappa- and Delta-infected mouse lungs vs extracellular mucin staining in the bronchiole lumen of NY (614G)-infected mice (black arrows).
Figure 4
Figure 4
Tissue-specific viral loads, D-dimer and cytokine profiles after infections of SARS-CoV-2 and variants K18-hACE2 mice of both sexes (1:1 ratio, n = 5 mice/group) were infected intranasally with 103 TCID50/mouse of New York-PV09158/2020 (NY (614G)), or 102 TCID50/mouse of Kappa and Delta variants. Viral RNA copies in various organs including reproductive organs (ovary or testis) on 3 and 5 days post-infection (dpi) were measured by RT-qPCR (Individual viral titers shown in Figure S4) and were log transformed. Tissue-specific D-dimer and cytokines were determined by ELISA (Individual D-dimer and cytokine levels shown in Figure S5) and were normalized over uninfected naïve mice. (A) Mean viral loads in various organs (log). (B) Tissue-specific D-dimer (fold vs naïve). (C) Brain-specific cytokines (fold vs naïve). (D) Heart-specific cytokines (fold vs naïve). (E) Pulmonary cytokines (fold vs naïve). (F) Hepatic cytokines (fold vs naïve). (G) Multivariate principal component analysis (PCA) of tissue-specific D-dimer and cytokines after NY (614G), Kappa or Delta infection. Two most significant principal components (PC1 and PC2) are shown. (H) The variable importance in projection (VIP) scores are shown after the logistic regression accounting for different tissues. ∗p < 0.05, ∗∗p < 0.01 by the Wald test.
Figure 5
Figure 5
Human COVID-19 post-vaccination antibody responses to Kappa and Delta variants Human post-vaccination (post-vac) sera were collected from 14 adult volunteers (6 with Pfizer and 8 with Moderna) at approximately 1 month (mo) after the receipt of 2nd dose mRNA vaccines. Ten of the original donors (4 with Pfizer and 6 with Moderna) have provided additional sera at approximately 5-month after the 2nd dose. The receptor binding domain (RBD)-specific IgG titers were determined by ELISA. Pseudovirus-based neutralization (PVN) titers against original Wuhan-Hu-1 strain, or microneutralization (MN) titers against live USA-WA1/2020 (WA (614D)), New York-PV09158/2020 (NY (614G)), Kappa and Delta variants were also determined. The 1-mo post-vaccination sera were also pooled and tested for blocking human ACE2 (hACE2)-RBD binding by bio-layer interferometry (BLI). (A) RBD-specific IgG and (B) neutralizing antibody titers of 1-mo human post-vac sera (mean ± s.e.m., n = 14 donors/group). (C) Representative BLI sensorgrams of RBD derived from original Wuhan-Hu-1 strain, Kappa and Delta variants binding to immobilized monomeric hACE2. (D) Monomeric hACE2-RBD binding affinity constant (mean ± s.e.m., n = 7 replicates/group). (E) The blocking effect of pooled 1-mo human post-vac sera on hACE2-RBD binding (mean ± s.e.m., n = 4 replicates/group) (F) RBD-specific IgG and (G) live virus-based MN titers of the same donors at 1-mo and 5-month after the 2nd dose (mean ± s.e.m., n = 10 donors/group). ∗p < 0.05, ∗∗p < 0.01, ∗∗∗p < 0.001, ∗∗∗∗p < 0.0001 by One-way ANOVA with nonparametric test. IgG or MN titers were log transformed for statistical analysis. Dashed lines indicate the lowest serum dilutions tested. ns: not significant.
Figure 6
Figure 6
Morbidity and mortality of K18-hACE2 mice receiving human post-vaccination sera after lethal challenges of SARS-CoV-2 and variants K18-hACE2 mice of both sexes (1:1 ratio) were injected intraperitoneally with 200 μL/mouse of PBS (mock-transferred) or pooled human post-vaccination (post-vac) sera collected at 1 month (mo) or 5 months after the 2nd dose of COVID-19 mRNA vaccines (post-vac sera transferred). Recipient mice were then challenged intranasally with 103 TCID50/mouse of New York-PV09158/2020 (NY (614G)), or 102 TCID50/mouse of Kappa and Delta variants. Morbidity and mortality of infected mice were monitored for up to 14 days post-challenge. % body weight drops (mean ± s.e.m.) and % cumulative survivals were determined. (A) Morbidity and mortality of mice receiving 1-mo post-vac sera (n = 6 mice/group). (B) Morbidity and mortality of mice receiving 5-month post-vac sera (n = 4 mice/group). a indicates p < 0.05 vs mock-transferred group with NY (614G) challenge by Log rank (Mantel-Cox) survival test.
Figure 7
Figure 7
Effects of human COVID-19 post-vaccination sera on tissue-specific viral burden of K18-hACE2 mice challenged with SARS-CoV-2 and variants K18-hACE2 mice of both sexes (1:1 ratio, n = 6 mice/group) were injected intraperitoneally with 200 μL/mouse of PBS (mock-transferred) or pooled human post-vaccination (post-vac) sera collected at 1-month after the 2nd dose of COVID-19 mRNA vaccines (post-vac sera transferred). Recipient mice were then challenged intranasally with 103 TCID50/mouse of New York-PV09158/2020 (NY (614G)), or 102 TCID50/mouse of Kappa and Delta variants. Viral RNA copies in brain, heart, lung, liver, spleen, kidney, and reproductive organs (ovary or testis) on 5 days post-infection (dpi) were measured by RT-qPCR (Individual viral titers shown in Figure S6). (A, C, and E) Mean viral loads (log) in various organs. (B, D, and F) Post-vac sera transferred mice that showed >1-log or >2-log reduction in tissue-specific viral loads as compared to mock-transferred are highlighted in blue. ∗p < 0.05 vs mock-transferred by Mann-Whitney test.
Figure 8
Figure 8
The hypoxia pathway transcriptional gene expression in K18-hACE2 mice challenged with SARS-CoV-2 and variants K18-hACE2 mice of both sexes (1:1 ratio) were injected intraperitoneally with 200 μL/mouse of PBS (mock-transferred) or pooled human post-vaccination sera collected at 1-month after the 2nd dose of COVID-19 mRNA vaccines (post-vac sera transferred). Recipient mice were then challenged intranasally with 103 TCID50/mouse of New York-PV09158/2020 (NY (614G)), or 102 TCID50/mouse of Kappa and Delta variants. Hypoxia signaling pathway PCR array was performed using RNA extracted from lung homogenates of infected mice (n = 6 mice/group, female vs male at 1:1 ratio) 5 days post-infection (dpi). Gene regulation as fold changes over uninfected naïve mice (n = 3 mice/group including 2 females and 1 male) was used to construct the volcano plots (A, C, and E) or correlation plots (B, D, and F). The dashed lines indicate the thresholds of p value < 0.05. Selected genes that show a significant rise (red) or fall (blue) are highlighted.
Figure 9
Figure 9
Effects of human COVID-19 post-vaccination sera on tissue-specific cytokines and D-dimer deposition of K18-hACE2 mice challenged with SARS-CoV-2 and variants K18-hACE2 mice of both sexes (1:1 ratio, n = 6 mice/group) were injected intraperitoneally with 200 μL/mouse of PBS (mock-transferred) or pooled human post-vaccination (post-vac) sera collected at 1-month after the 2nd dose of COVID-19 mRNA vaccines (post-vac sera transferred). Recipient mice were then challenged intranasally with 103 TCID50/mouse of New York-PV09158/2020 (NY (614G)), or 102 TCID50/mouse of Kappa and Delta variants. D-dimer and cytokines in brain, heart, lung, and liver homogenates harvested on 5 days post-infection were measured (Individual D-dimer and cytokine levels shown in Figures S7 and S8). Fold changes in tissue-specific cytokine and D-dimer levels of post-vac sera transferred mice vs mock-transferred mice are shown, including (A) CXCL10/IP-10, (B) MCP-1, (C)CMIP-1α, (D) MIP-2, (E) IL-1β, (F) IL-6, (G) IL-10, (H) TNF-α, (I) IFN-β and (J) D-dimer. Tissue-specific viral loads, cytokines, and D-dimer of post-vac sera transferred mice and mock-transferred mice were also subjected to multivariate principal component analysis (PCA). (K, M, and N) The most significant two principal components (PC1 and PC2) are shown for NY (614G) (K), Kappa (M) or Delta challenge (N), respectively. Only in NY (614G) challenged mice, those receiving post-vac sera were fully separated from mock-transferred (K). (L) The variable importance in projection (VIP) scores for NY (614G) challenge is shown after the logistic regression accounting for different tissues. ∗p < 0.05, ∗∗p < 0.01 by the Wald test.
Figure 10
Figure 10
In vitro and in vivo neutralization of human COVID-19 post-vaccination sera after the booster dose Five healthy donors (3 with Moderna and 2 with Pfizer) provided post-vaccination (post-vac) sera at approximately 1 month (mo) and 5-mo after the receipt of the 2nd dose and 1-mo after the 3rd dose (booster) of mRNA vaccines. The microneutralization (MN) titers against live USA-WA1/2020 (WA (614D)), New York-PV09158/2020 (NY (614G)), Kappa, Delta, and emerging Omicron subvariants (BA.1, BA.2, BA.4 and BA.5) were determined. (A-C) MN titers of the same donors at 1-mo and 5-mo after 2nd dose and 1-mo after 3rd dose of mRNA vaccines (mean ± s.e.m., n = 5 donors/group). MN titers were log transformed before One-way ANOVA with nonparametric test. (A and B) indicate p < 0.05 vs WA (614D) and NY (614G), respectively. Dashed lines indicate the lowest serum dilutions tested. ns: not significant. The 1-mo post-vac sera after the booster dose were also pooled and were injected intraperitoneally at 200 μL/mouse into naïve K18-hACE2 mice of both sexes (1:1 ratio, n = 4 mice/group). Mice receiving 200 μL/mouse of PBS (mock-transferred) served as the controls. Recipient mice were then challenged intranasally with 103 TCID50/mouse of NY (614G), or 102 TCID50/mouse of Delta variant. Morbidity and mortality of infected mice were monitored for up to 14 days post-challenge. % body weight drops (mean ± s.e.m.) and % cumulative survivals were determined. (D) Morbidity and mortality of mice receiving post-vac sera from 1-mo booster. (C and D) indicate p < 0.05 vs mock-transferred group with the same challenge by Log rank (Mantel-Cox) survival test.

References

    1. Gupta R., Charron J., Stenger C.L., Painter J., Steward H., Cook T.W., Faber W., Frisch A., Lind E., Bauss J., et al. SARS-CoV-2 (COVID-19) structural and evolutionary dynamicome: insights into functional evolution and human genomics. J. Biol. Chem. 2020;295:11742–11753. doi: 10.1074/jbc.RA120.014873. - DOI - PMC - PubMed
    1. McCarthy K.R., Rennick L.J., Nambulli S., Robinson-McCarthy L.R., Bain W.G., Haidar G., Duprex W.P. Recurrent deletions in the SARS-CoV-2 spike glycoprotein drive antibody escape. Science. 2021;371:1139–1142. doi: 10.1126/science.abf6950. - DOI - PMC - PubMed
    1. Gobeil S.M.C., Janowska K., McDowell S., Mansouri K., Parks R., Stalls V., Kopp M.F., Manne K., Li D., Wiehe K., et al. Effect of natural mutations of SARS-CoV-2 on spike structure, conformation, and antigenicity. Science. 2021;373:eabi6226. doi: 10.1126/science.abi6226. - DOI - PMC - PubMed
    1. Tao K., Tzou P.L., Nouhin J., Gupta R.K., de Oliveira T., Kosakovsky Pond S.L., Fera D., Shafer R.W. The biological and clinical significance of emerging SARS-CoV-2 variants. Nat. Rev. Genet. 2021;22:757–773. doi: 10.1038/s41576-021-00408-x. - DOI - PMC - PubMed
    1. Zhou P., Yang X.L., Wang X.G., Hu B., Zhang L., Zhang W., Si H.R., Zhu Y., Li B., Huang C.L., et al. A pneumonia outbreak associated with a new coronavirus of probable bat origin. Nature. 2020;579:270–273. doi: 10.1038/s41586-020-2012-7. - DOI - PMC - PubMed