

Sex Is the Main Determinant of Levodopa Clinical Pharmacokinetics: Evidence from a Large Series of Levodopa Therapeutic Monitoring
- PMID: 36373294
- PMCID: PMC9837688
- DOI: 10.3233/JPD-223374
Sex Is the Main Determinant of Levodopa Clinical Pharmacokinetics: Evidence from a Large Series of Levodopa Therapeutic Monitoring
Abstract
Background: Different studies, mostly with limited cohorts, have suggested the effects of patients' characteristics on levodopa (LD) pharmacokinetics.
Objective: We primarily aimed at investigating in a large population the relationship between patients' features and LD kinetic variables, to assess the main demographic and clinical predictors of LD clinical pharmacokinetics.
Methods: The study was retrospective, based on data collected from subjects with parkinsonism on chronic LD undergoing LD therapeutic monitoring (TM). LD TM includes serial quantitative motor tests and blood samples to measure plasma drug concentrations after each subject's chronically taken first-morning LD dose intake.
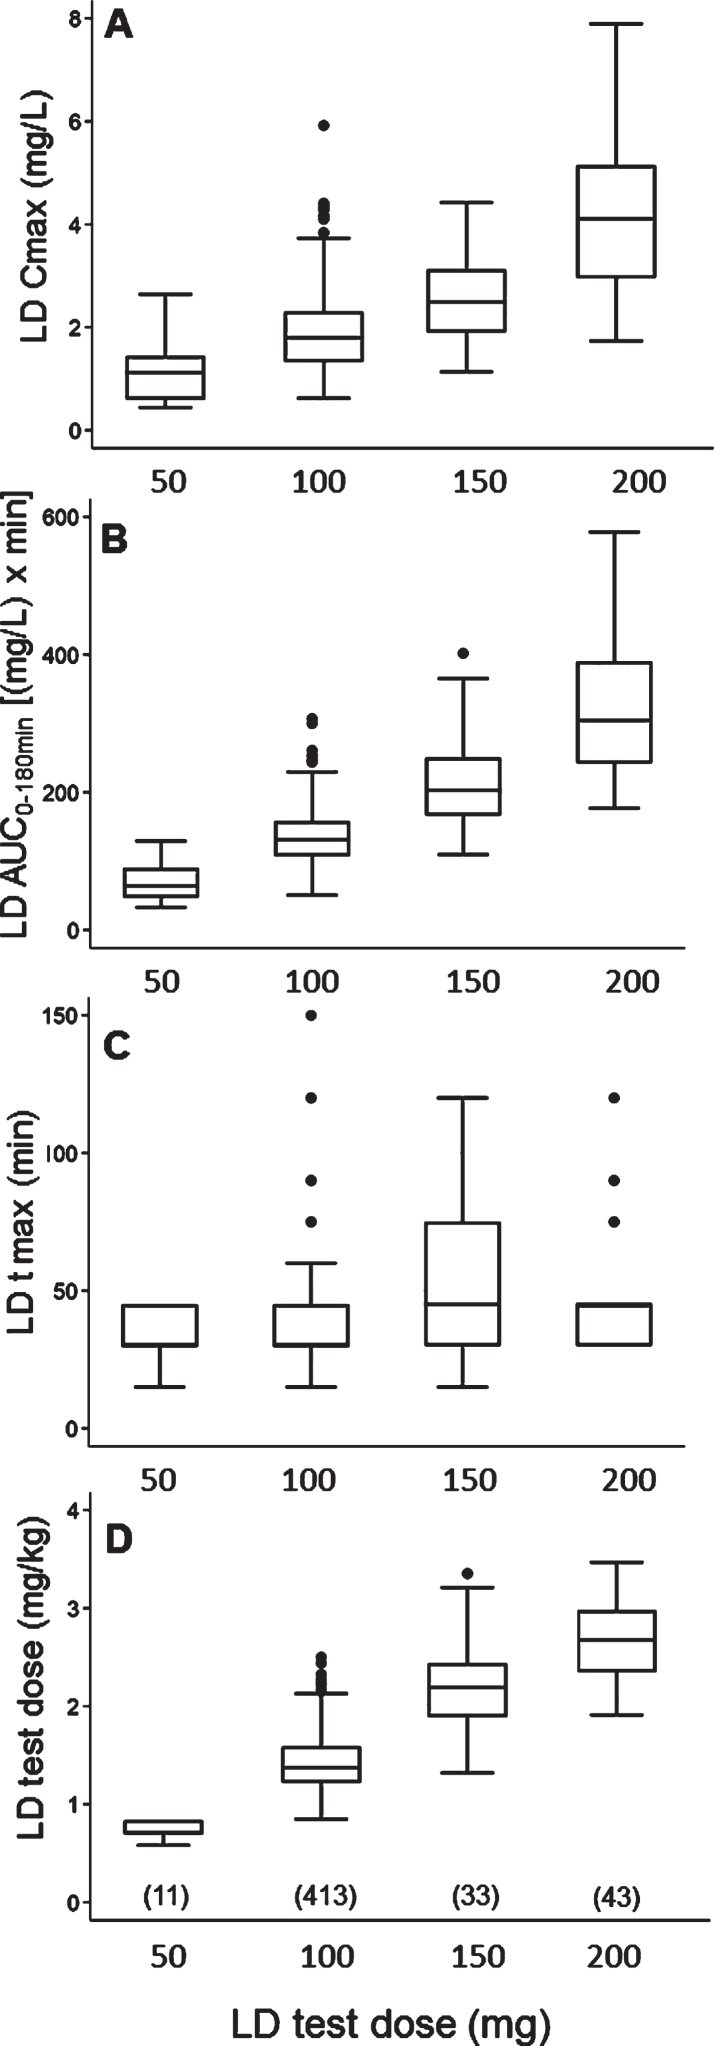
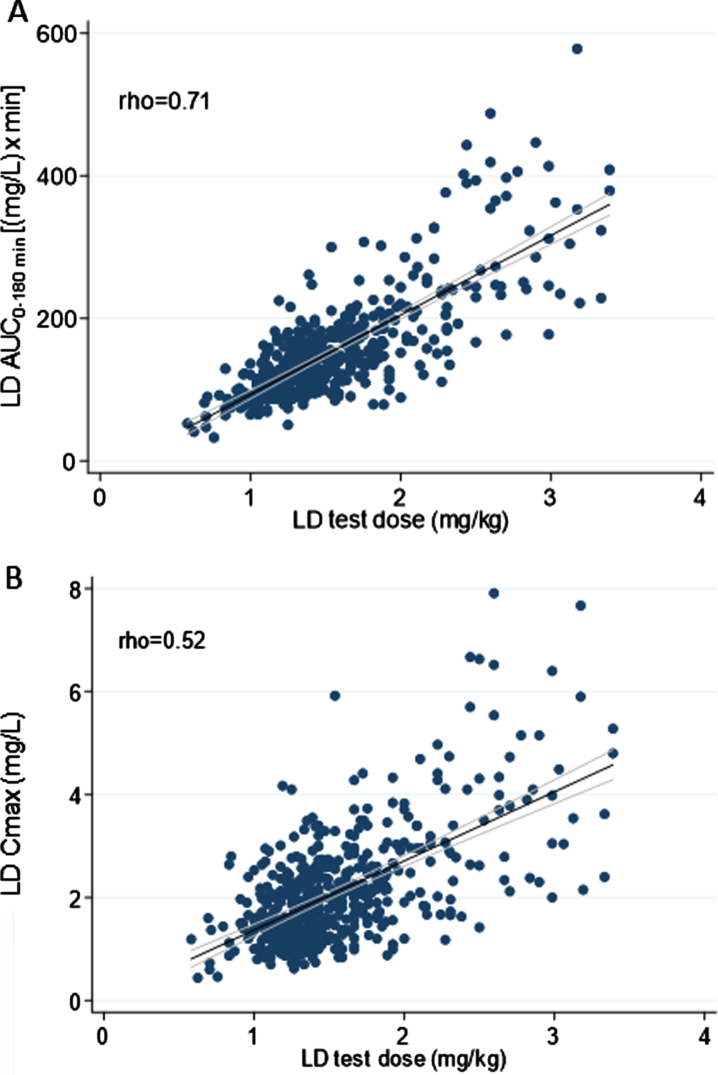
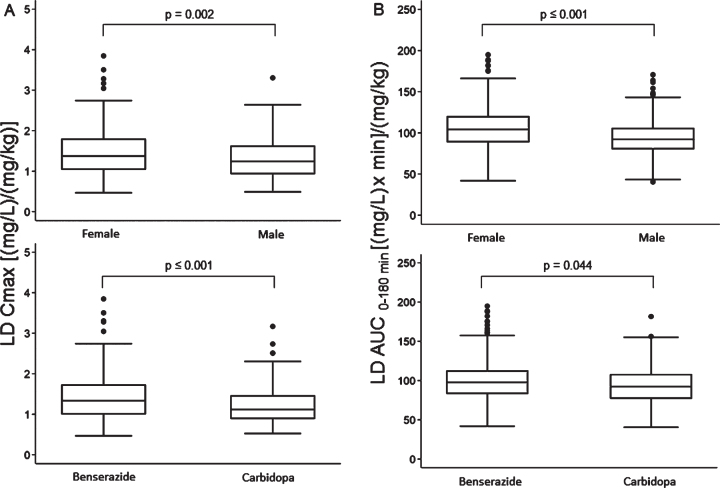
Results: Five hundred patients, 308 males (61.6%), mean (SD) age of 65 (10.1) years were included. Parkinsonian symptoms and LD therapy lasted 5.5 (4.5) and 3.4 (3.9) years, respectively. MDS-UPDRS part III "off" score was 28.8 (15.2). LD dose was 348.2 (187.1) mg/day. From multiple linear regression analysis, test dose, sex, type of LD decarboxylase inhibitor, weight and MDS-UPDRS part III score were linear predictors of both LD peak plasma concentration (Cmax) (R2 = 0.52) and area under the 3-h plasma concentration-time curve (AUC) (R2 = 0.71), while age was a further predictor only for AUC. Besides test dose, sex was the strongest independent contributing variable to LD AUC, which resulted 27% higher in females compared to males.
Conclusion: This is the largest collection of data on the relationship between demographic and clinical-therapeutic variables and LD kinetics in patients with parkinsonian symptoms. As a main clinically practical finding, women might require a 25% reduced weight-normalized LD dose compared with men to achieve the same LD bioavailability.
Keywords: Levodopa; dopa decarboxylase inhibitors; levodopa therapeutic monitoring; levodopa-induced dyskinesias; pharmacodynamics; pharmacokinetics; sex.
Conflict of interest statement
Giovanna Calandra-Buonaura has received honoraria for speaking from Abbvie Italia, Bial Italia, and Zambon Italia.
The remaining authors have no conflict of interest to report.
Figures
References
-
- Contin M, Martinelli P (2010) Pharmacokinetics of levodopa, J Neurol 257, (Suppl 2): S253–261. - PubMed
-
- Contin M, Riva R, Martinelli P, Albani F, Avoni P, Baruzzi A (2001) Levodopa therapy monitoring in patients with Parkinson disease: A kinetic-dynamic approach. Ther Drug Monit 23, 621–629. - PubMed
-
- Olanow CW, Stocchi F (2018) Levodopa: A new look at an old friend. Mov Disord 33, 859–866. - PubMed
-
- Contin M, Riva R, Martinelli P, Baruzzi A (1991) Effect of age on the pharmacokinetics of oral levodopa in patients with Parkinson’s disease. Eur J Clin Pharmacol 41, 463–466. - PubMed
Publication types
MeSH terms
Substances
LinkOut - more resources
Full Text Sources
Medical
Research Materials
Miscellaneous
