. 2022 Dec 1;15(12):dmm049752.
doi: 10.1242/dmm.049752. Epub 2022 Dec 13.

17q12 deletion syndrome mouse model shows defects in craniofacial, brain and kidney development, and glucose homeostasis

Affiliations

17q12 deletion syndrome mouse model shows defects in craniofacial, brain and kidney development, and glucose homeostasis

Emily B Warren et al. Dis Model Mech. .

Abstract

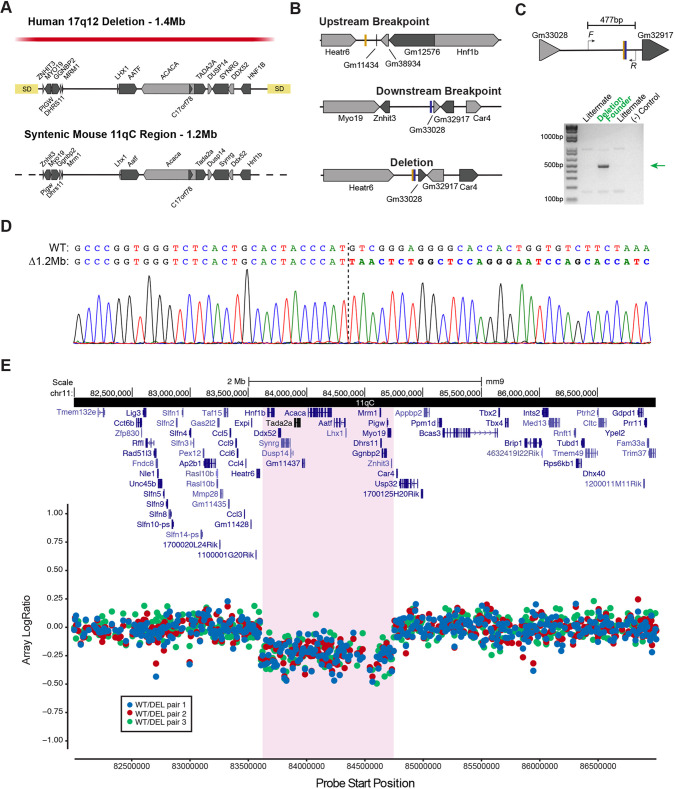
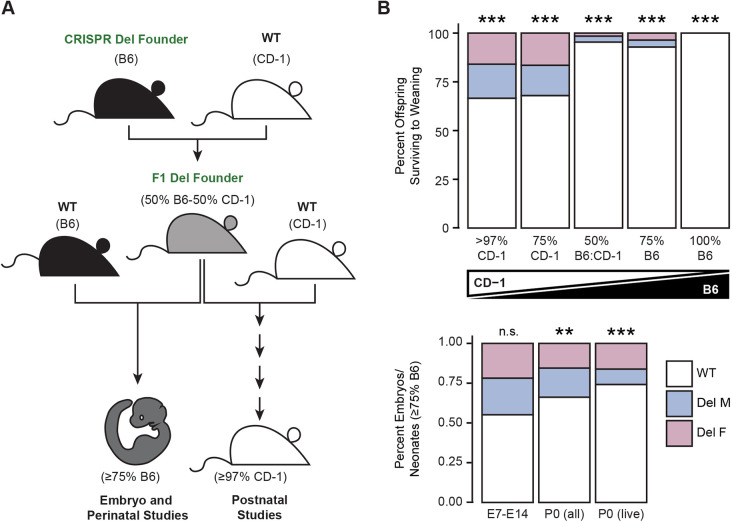
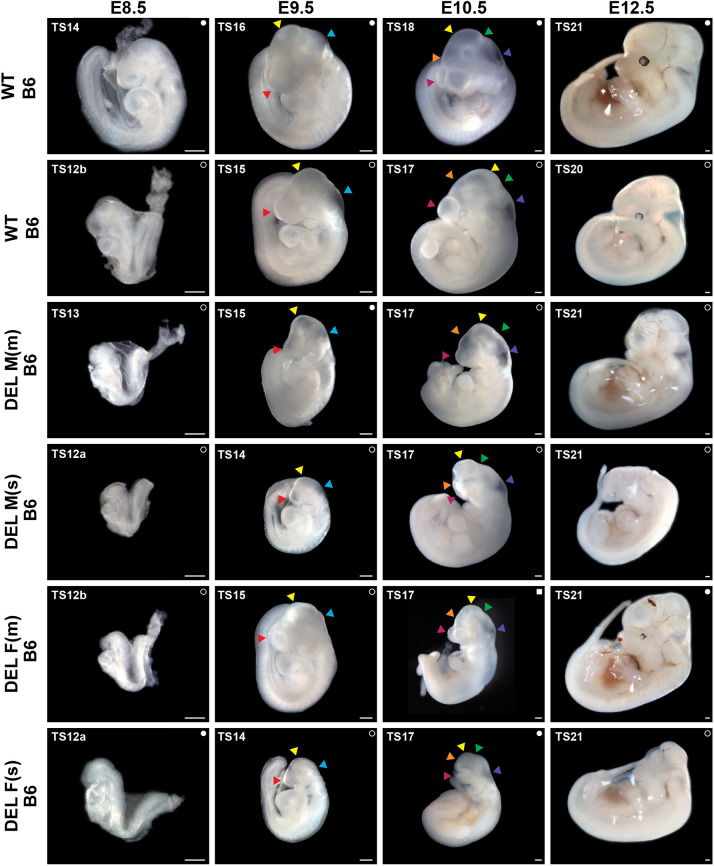
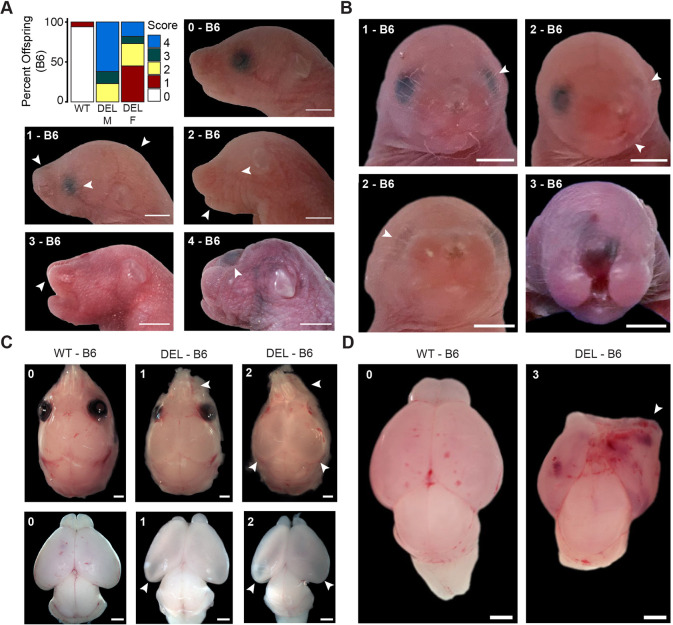
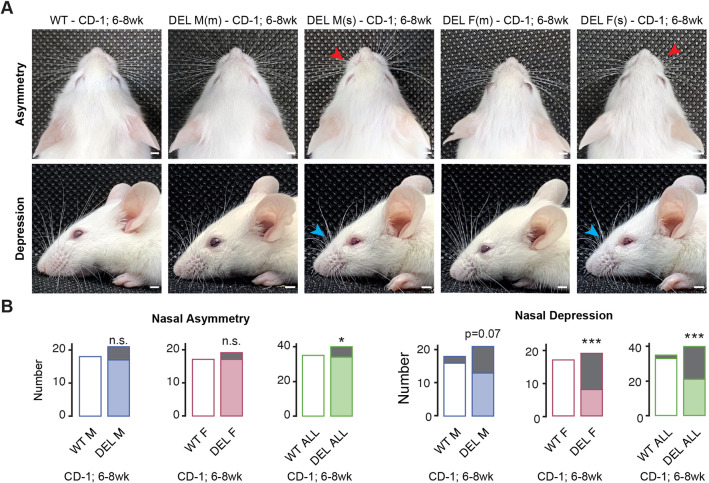
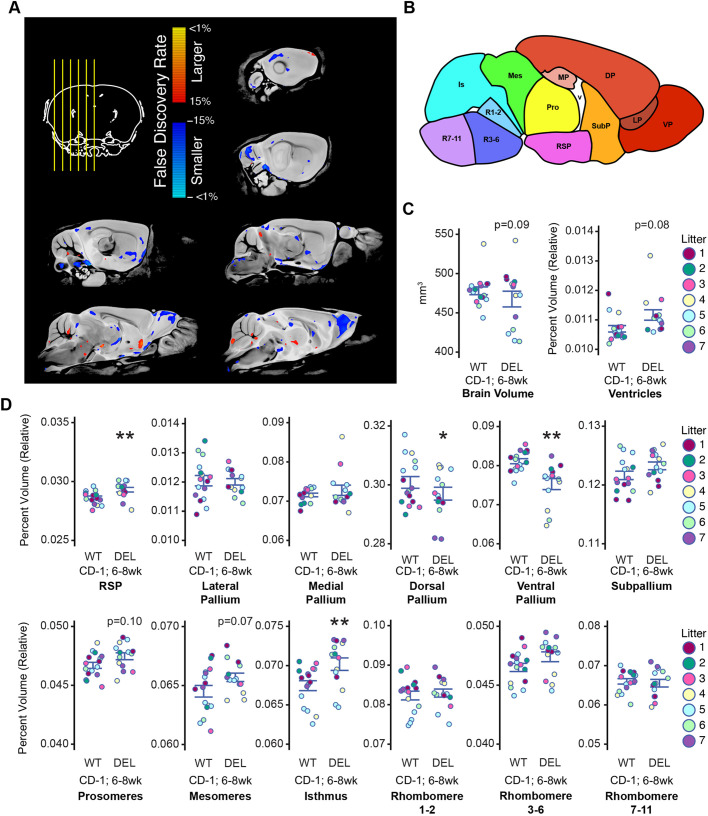
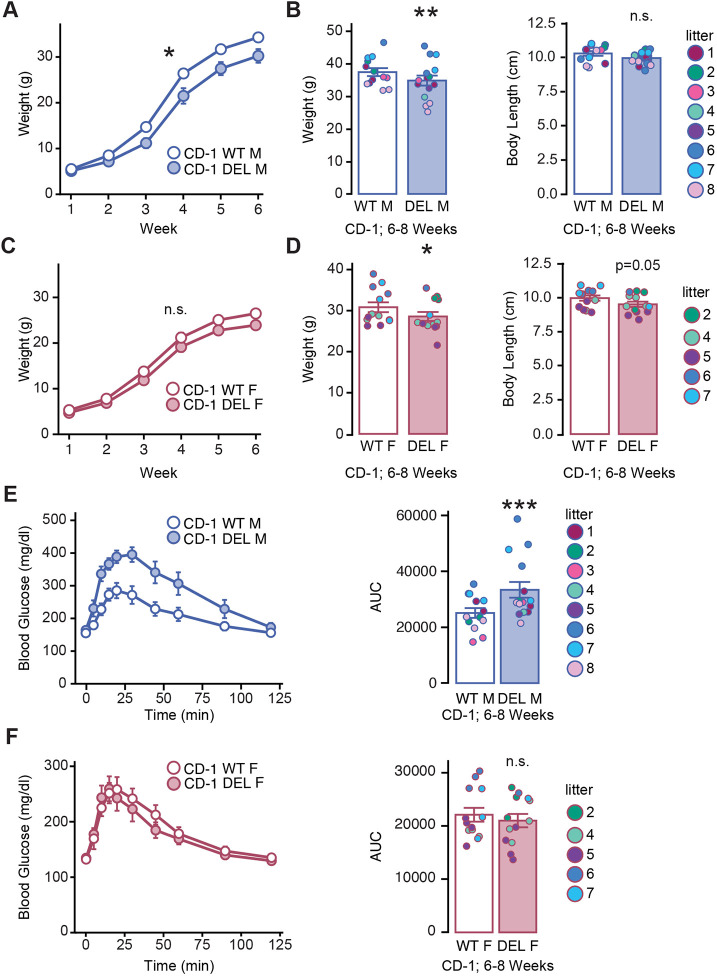
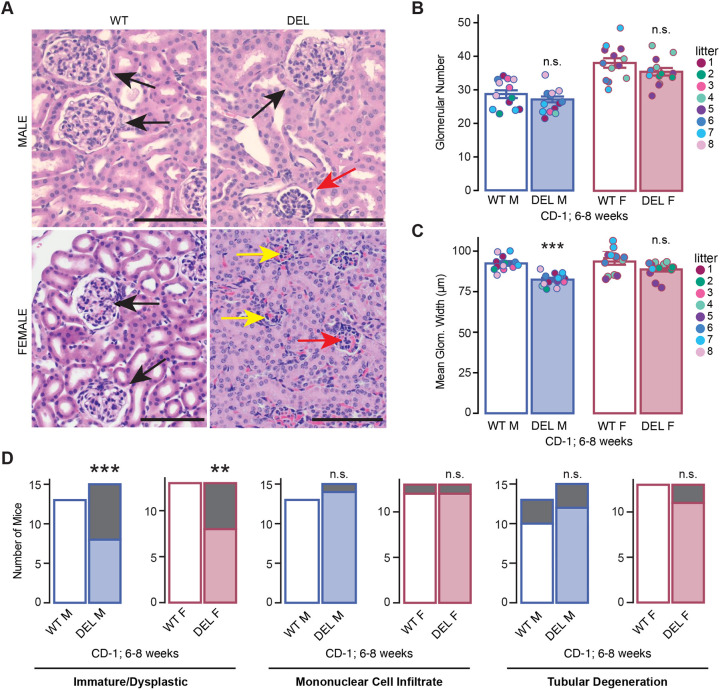
17q12 deletion (17q12Del) syndrome is a copy number variant (CNV) disorder associated with neurodevelopmental disorders and renal cysts and diabetes syndrome (RCAD). Using CRISPR/Cas9 genome editing, we generated a mouse model of 17q12Del syndrome on both inbred (C57BL/6N) and outbred (CD-1) genetic backgrounds. On C57BL/6N, the 17q12Del mice had severe head development defects, potentially mediated by haploinsufficiency of Lhx1, a gene within the interval that controls head development. Phenotypes included brain malformations, particularly disruption of the telencephalon and craniofacial defects. On the CD-1 background, the 17q12Del mice survived to adulthood and showed milder craniofacial and brain abnormalities. We report postnatal brain defects using automated magnetic resonance imaging-based morphometry. In addition, we demonstrate renal and blood glucose abnormalities relevant to RCAD. On both genetic backgrounds, we found sex-specific presentations, with male 17q12Del mice exhibiting higher penetrance and more severe phenotypes. Results from these experiments pinpoint specific developmental defects and pathways that guide clinical studies and a mechanistic understanding of the human 17q12Del syndrome. This mouse mutant represents the first and only experimental model to date for the 17q12 CNV disorder. This article has an associated First Person interview with the first author of the paper.

Keywords: 17q12; Copy number variants; Forebrain development; Head development; Neurodevelopmental disorders; Renal cysts and diabetes syndrome.


Conflict of interest statement

Competing interests The authors declare no competing or financial interests.

Figures

Fig. 1.
Fig. 1.
Generation and validation of the 17q12 deletion (17q12Del) mouse. (A) The human 17q12Del region and the aligned syntenic mouse 11qC genomic region. The red bar indicates the consensus human deletion region, spanning 1.4 Mb. The syntenic mouse locus is a 1.2 Mb region at 11qC. Note that the mouse locus is depicted in 3′-5′ orientation to show homology. (B­) sgRNAs were targeted to breakpoints upstream (5′ to protein-coding Hnf1b and non-coding Gm11434) (shown by gold hashmark on top) and downstream (3′ to Znhit3) (blue hashmark in middle) of the mouse 11qC locus. An ssDNA donor was introduced to facilitate the joining of the breakpoints. Bottom shows predicted CRISPR-mediated recombination yielding a 1.2 Mb deletion. (C) Forward and reverse primers were designed around the deletion junction to detect a 477 bp product in the presence of a deletion (top), confirmed by PCR (bottom, DNA agarose gel). Green arrow indicates deletion product. (D) Chromatogram of Sanger sequencing of PCR product. The chromatogram confirms the expected joined upstream and downstream sequences; dashed line indicates the breakpoint and deviation from the reference sequence. (E) Array comparative genomic hybridization of wild-type (WT) versus 17q12Del (DEL) littermates. Three pairs of WT/DEL offspring were used, and intensity log ratios reveal a consensus deletion covering the (highlighted) region between Heatr6 and Car4. The aligned region is displayed with UCSC genes (reference assembly mm9).
Fig. 2.
Fig. 2.
Variable expressivity of the 17q12Del on two genetic backgrounds. (A) Breeding schematic for propagating the 17q12Del mouse. Generation of the 17q12Del mouse was initiated on the C57BL/6N (B6) background (see Fig. 1). Attempts to propagate the mutation on a pure B6 background were unsuccessful due to lethality. The F1 deletion founder was generated by outcrossing the B6 17q12Del founder onto the outbred CD-1 strain. This F1 mixed background founder was backcrossed onto B6 for embryonic developmental studies, and further outcrossed onto CD-1 (F5+ generations, ≥97% CD-1 background) for postnatal studies. (B) Genetic background strongly affects the viability of 17q12Del mice. Top: increasing proportions of 17q12Del offspring survive to weaning with increasing percentages of CD-1 genetic background. Bottom: prenatally (up to E14), 17q12Del embryos (with ≥75% B6 background) are present at Mendelian ratios, but the number of viable offspring drops immediately at birth. See Table S1 for animal numbers. Chi-squared odds ratio test for significance. **P<0.001, ***P<0.001; n.s., not significant.
Fig. 3.
Fig. 3.
Anterior malformations of B6 17q12Del embryos. Representative male and female B6 17q12Del (DEL) embryos from E8.5 to E12.5 compared to WT littermates. ‘m’ embryos are representative examples of mild abnormalities; ‘s’ embryos are representative examples of severe abnormalities. Theiler stage (TS) for each embryo is indicated in the top-left corner, and litter for embryos at each time point is represented by a symbol in the top-right corner (i.e. filled circle, litter 1; open circle, litter 2). See Table S2 for details about embryo scoring. Note reduced embryo size in earlier developmental stages, and deficient head formation, particularly anterior to the pharyngeal arches, across all embryonic stages. E9.5-E10.5, arrowheads indicate vesicle structures of the brain. E9.5, red arrowheads indicate prosencephalon, yellow arrowheads indicate mesencephalon, cyan arrowheads indicate rhombencephalon. E10.5, magenta arrowheads indicate telencephalon, orange arrowheads indicate diencephalon, yellow arrowheads indicate mesencephalon, green arrowheads indicate metencephalon, and purple arrowheads indicate myelencephalon. Note the absence of gross abnormalities in the body plan of the embryo. Putative embryo head faces left. Scale bars: 0.25 mm. See Table S1 for animal numbers.
Fig. 4.
Fig. 4.
Neonatal B6 17q12Del mice have abnormal head phenotypes. (A) Head phenotypes of recovered P0 B6 17q12Del (DEL) and WT offspring. Top left: observed frequency of dysmorphic features in neonatal pups, scored by severity (0-4). Note that more severe scores may include features from milder scores. 0-4, representative pups with designated scores. See Materials and Methods and Table S2 for additional details on scoring. 0, no abnormalities; 1, mild abnormalities (white arrowheads indicate shortened snout, malformed eye and domed skull); 2, moderate abnormalities (white arrowheads indicate absent eye and asymmetric lower jaw); 3, severe abnormalities (white arrowhead indicates incomplete closure of the maxilla); 4, very severe abnormalities (white arrowhead indicates flattened head and hematoma protrusion, indicating severe malformation of brain structures). (B) Representative en face images of B6 DEL pups with severity scores 1, 2 and 3. Top left: white arrowhead indicates immature eye structure. Top right: white arrowheads indicate misaligned nose and jaw and absent left eye. Bottom left: white arrowhead indicates absent right eye. (C) Representative crania (top row) and brains (bottom row) from mild and moderate severity B6 DEL offspring compared to WT offspring. DEL(1), white arrowheads indicate shortened nasal bones and hollow cortical structures, indicating deficient hippocampal genesis. DEL(2), white arrowheads indicate asymmetric nasal bones and olfactory bulbs, and hollow cortical structures. (D) Representative brains recovered from B6 WT and severity score 3 B6 DEL pups. Note the profound lack of structure in the anterior right hemisphere (white arrow) and reduced cortical size in the DEL brain. Scale bars: 2.5 mm (A,B); 1 mm (C,D). See Table S1 for animal numbers.
Fig. 5.
Fig. 5.
Frontonasal abnormalities of CD-1 17q12Del mice. (A) Representative images of mild (m) and severe (s) male and female CD-1 17q12Del (DEL) mice with and without characteristic malformations of the nose compared to CD-1 WT. Top row: overhead view. Red arrows indicate left or right asymmetry of the nasal bones. Bottom row: side view. Cyan arrowheads indicate depressions of the nasal bridge. Mice in top and bottom images are separate individuals. Scale bars: 2.5 mm. (B) Number of male (left), female (center) and all (right) CD-1 WT and DEL mice with nasal asymmetry (left) or nasal depression (right). Gray regions indicate number of animals with abnormalities. See Table S1 for animal numbers. Fisher's exact test for significance. *P<0.05; ***P<0.001; n.s., not significant.
Fig. 6.
Fig. 6.
Magnetic resonance imaging (MRI) reveals brain volume alterations in CD-1 17q12Del mice. (A) Representative serial sagittal MRI images of CD-1 17q12Del mice (DEL) compared to CD-1 WT. Top left: yellow lines overlaid on coronal section indicate position of sagittal sections. Red (positive) and blue (negative) indicate false discovery rates (FDRs) of regions larger and smaller (respectively) by absolute volume. (B) Representative sagittal section reflecting developmental structural ontogeny bins used for classifying MRI volumes. DP, dorsal pallium; Is, isthmus; LP, lateral pallium; Mes, mesomeres; MP, medial pallium; Pro, prosomeres; RSP, rostral secondary prosencephalon; R1-2; rhombomeres 1-2; R3-6; rhombomeres 3-6; R7-11; rhombomeres 7-11; SubP, subpallium; VP, ventral pallium. Based on Allen Developing Mouse Brain Atlas (https://atlas.brain-map.org/atlas?atlas=181276165#atlas=181276165&plate=100883770). (C) The DEL brain volume is smaller than that of WT (left), whereas relative ventricle volume is higher (right), approaching statistical significance. (D) DEL relative brain region volumes. (C,D) Point color reflects litter. See Table S1 for animal numbers. (A,C,D) Mixed effects model for genotype with litter as a random effect, followed by FDR correction for multiple comparisons. Error bars reflect s.e.m. for each group. *FDR<0.05; **FDR<0.01.
Fig. 7.
Fig. 7.
The 17q12Del mutation causes sex-specific effects on body weight and glucose metabolism. (A) Growth curves of male CD-1 WT and 17q12Del (DEL) mice from week 1 to week 6 of age. The growth curve of male CD-1 DEL mice diverges from that of male WT mice between weeks 2 and 3, and the effect of genotype on weight over time is significant. (B) At 6-8 weeks, male CD-1 DEL mice weigh significantly less than male WT littermates, but their body length is not significantly different from that of male WT mice. (C) Growth curves of female CD-1 WT and DEL mice from week 1 to week 6 of age. The growth curve of female CD-1 DEL mice diverges from that of female WT littermates by week 6, but the effect of genotype on weight is not significant. (D) At 6-8 weeks, female CD-1 DEL mice weigh significantly less and are significantly smaller than female WT littermates. (E) Intraperitoneal glucose tolerance test (IPGTT) of male CD-1 DEL mice and WT littermates. Left: IPGTT line graph of male CD-1 WT and DEL mice, reflecting blood glucose levels versus time. Right: area under the curve (AUC) of blood glucose from the IPGTT time curve. The AUC of male CD-1 DEL mice is significantly elevated compared to that of male WT mice. (F) IPGTT of female CD-1 DEL mice and WT littermates. Left: IPGTT line graph of female CD-1 WT and DEL mice. Right: AUC of blood glucose from the IPGTT time curve. See Table S1 for animal numbers. (B,D-F) Point color reflects litter. (A,C) Mixed effects model for interaction of genotype and week with male (A) or female (C) mouse as a random effect. (B,D) Mixed effects model for genotype with litter as a random effect. (E,F) Mixed effects model for genotype, with weight as a fixed effect and litter as a random effect. Error bars reflect s.e.m. for each group or time point. *P<0.05; **P<0.01, ***P<0.001; n.s., not significant.
Fig. 8.
Fig. 8.
17q12Del mutation causes renal abnormalities. (A) Representative H&E staining of kidney sections from 6-week-old CD-1 WT and 17q12Del (DEL) male (top row) and female (bottom row) mice. Black arrows indicate normal glomeruli, red arrows indicate immature glomeruli, yellow arrows indicate dysplastic glomeruli. Scale bars: 100 µm. (B) Mean glomerular number is reduced, but not significantly, in CD-1 DEL male and female mice. (C) Mean glomerular width is significantly reduced in male, but not female, CD-1 DEL mice. (B,C) Mixed effects model for genotype tested against the null model, with weight as a fixed effect and litter as a random effect. (D) CD-1 WT and DEL mice with immature and/or dysplastic glomeruli, mononuclear cell infiltrate or tubular degeneration in male and female mice as a proportion of total animals examined. Gray indicates numbers of animals with the indicated anomalies. See Table S1 for animal numbers. (B,C) Point color reflects litter. Fisher's exact test for significance. Error bars reflect s.e.m. for each group. **P<0.01, ***P<0.001; n.s., not significant.

Similar articles

Cited by

References

    1. Aldinger, K. A., Sokoloff, G., Rosenberg, D. M., Palmer, A. A. and Millen, K. J. (2009). Genetic variation and population substructure in outbred CD-1 mice: implications for genome-wide association studies. PLoS One 4, e4729. 10.1371/journal.pone.0004729 - DOI - PMC - PubMed
    1. Anttonen, A. K., Laari, A., Kousi, M., Yang, Y. J., Jaaskelainen, T., Somer, M., Siintola, E., Jakkula, E., Muona, M., Tegelberg, S.et al. (2017). ZNHIT3 is defective in PEHO syndrome, a severe encephalopathy with cerebellar granule neuron loss. Brain 140, 1267-1279. 10.1093/brain/awx040 - DOI - PubMed
    1. Arai, D., Hayakawa, K., Ohgane, J., Hirosawa, M., Nakao, Y., Tanaka, S. and Shiota, K. (2015). An epigenetic regulatory element of the Nodal gene in the mouse and human genomes. Mech. Dev. 136, 143-154. 10.1016/j.mod.2014.12.003 - DOI - PubMed
    1. Autism Spectrum Disorders Working Group of The Psychiatric Genomics Consortium. (2017). Meta-analysis of GWAS of over 16,000 individuals with autism spectrum disorder highlights a novel locus at 10q24.32 and a significant overlap with schizophrenia. Mol. Autism 8, 21. 10.1186/s13229-017-0137-9 - DOI - PMC - PubMed
    1. Avants, B. B., Epstein, C. L., Grossman, M. and Gee, J. C. (2008). Symmetric diffeomorphic image registration with cross-correlation: evaluating automated labeling of elderly and neurodegenerative brain. Med. Image Anal. 12, 26-41. 10.1016/j.media.2007.06.004 - DOI - PMC - PubMed

Publication types

Supplementary concepts