

Influence of Impurities from Manufacturing Process on the Toxicity Profile of Boron Nitride Nanotubes
- PMID: 36373669
- PMCID: PMC9975644
- DOI: 10.1002/smll.202203259
Influence of Impurities from Manufacturing Process on the Toxicity Profile of Boron Nitride Nanotubes
Abstract
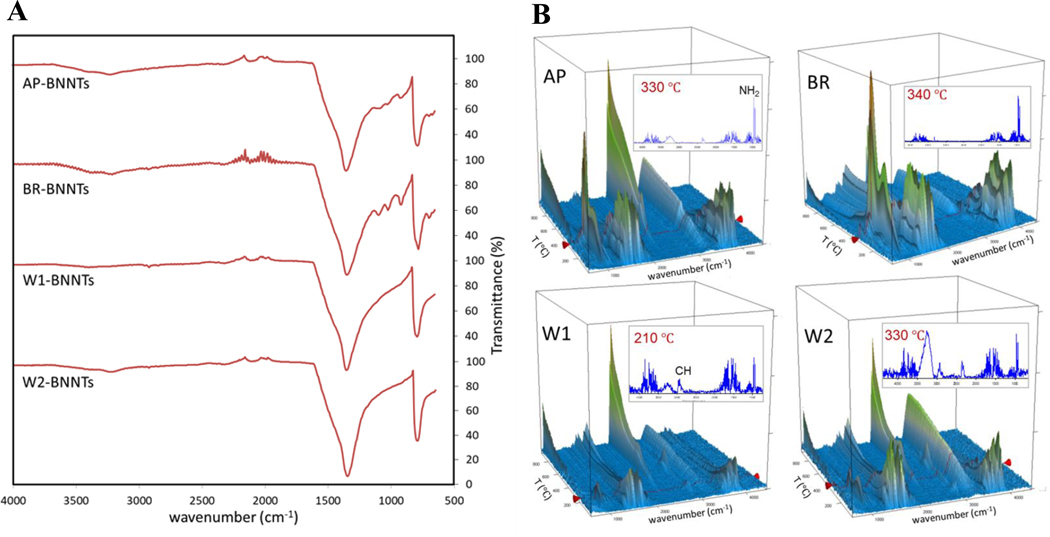
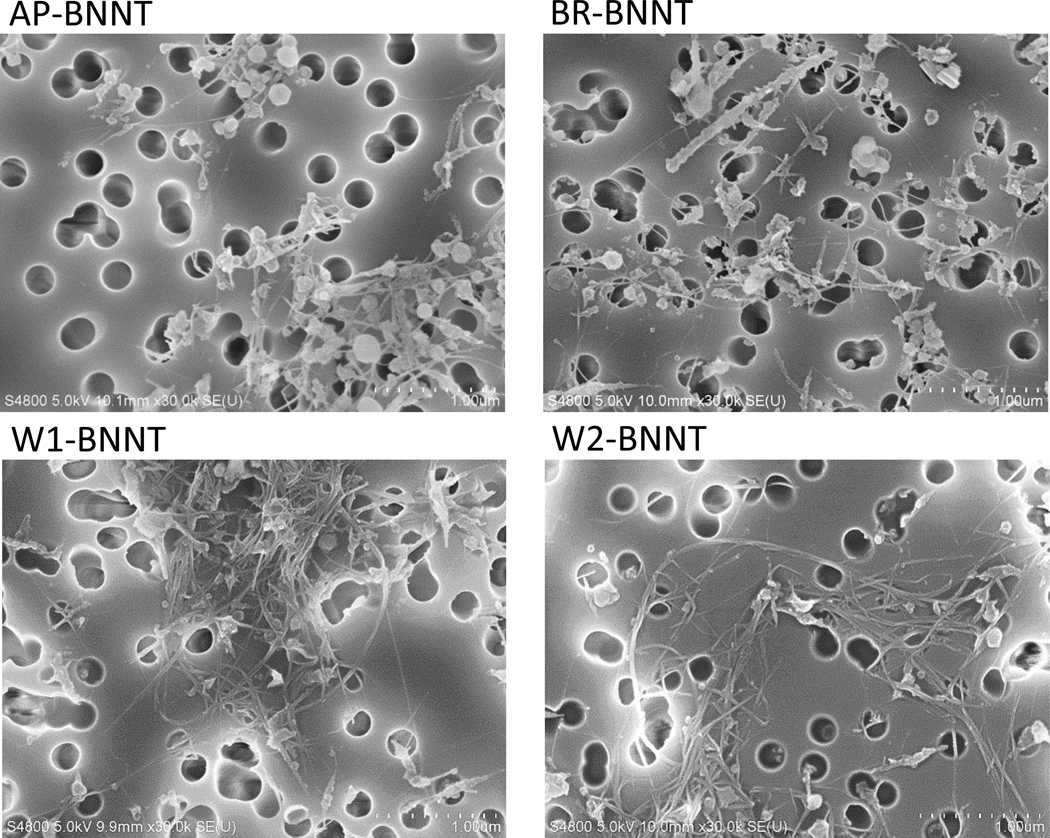
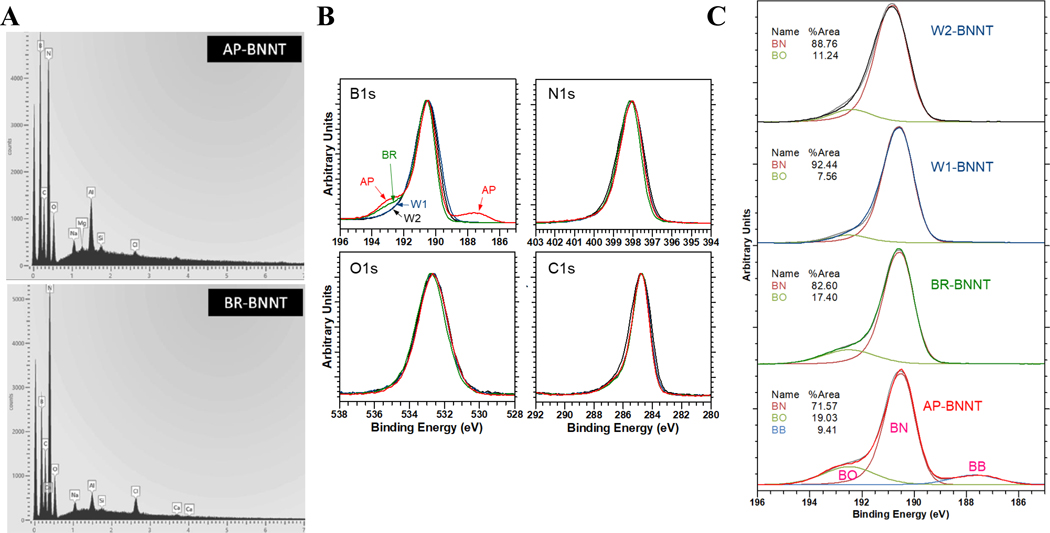
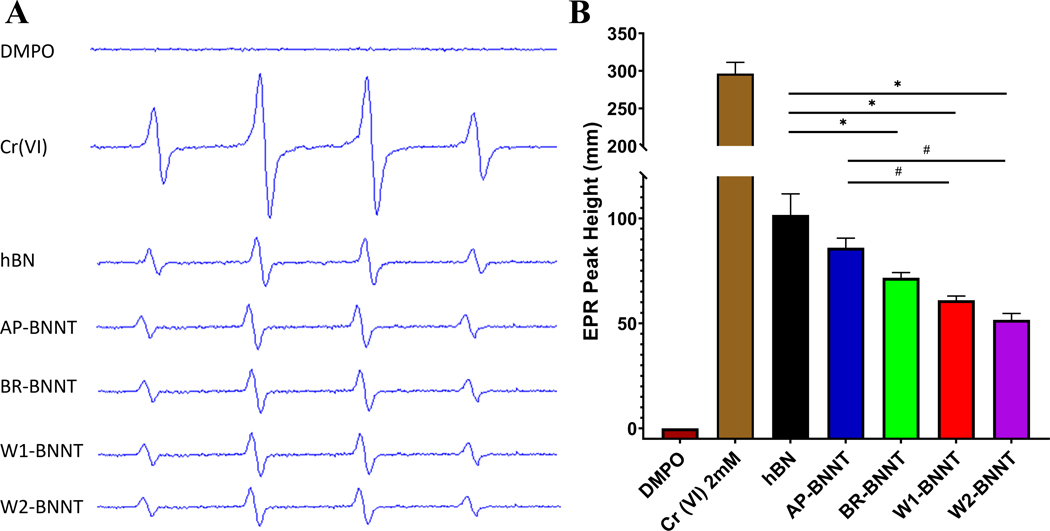
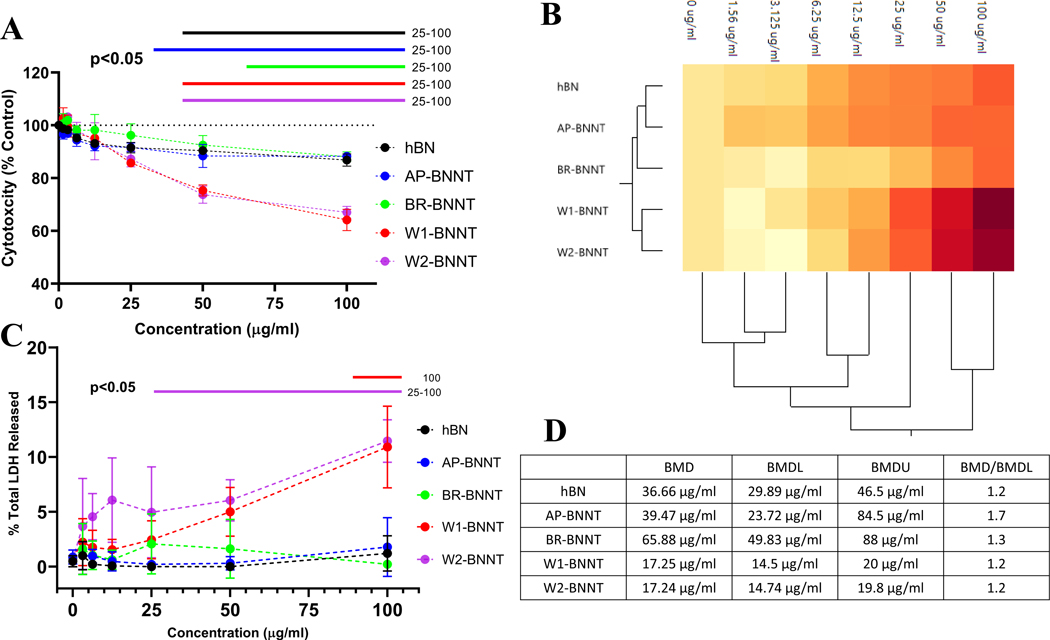
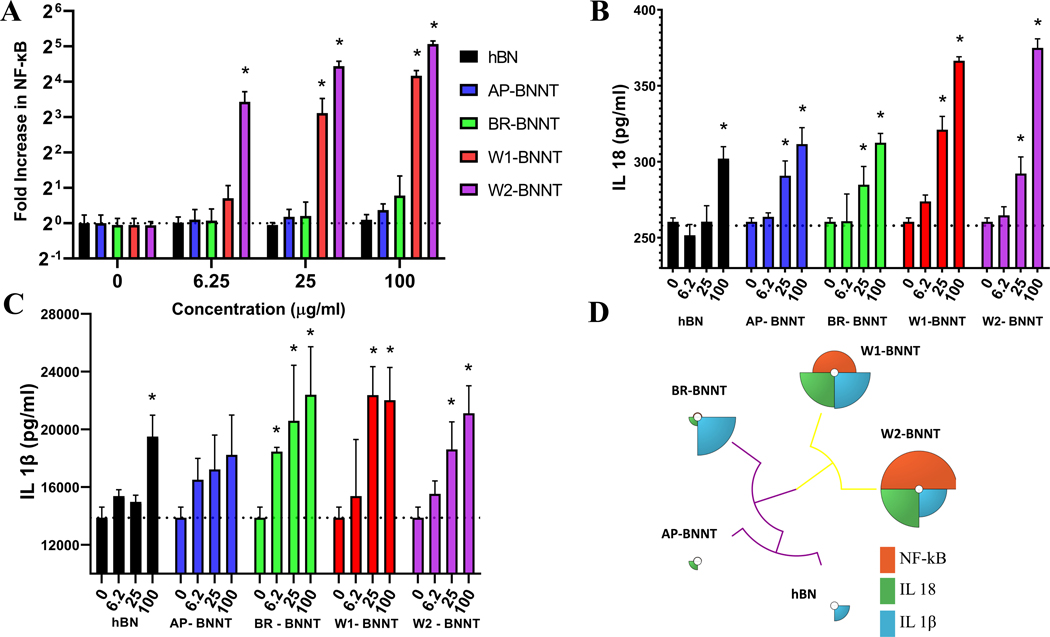
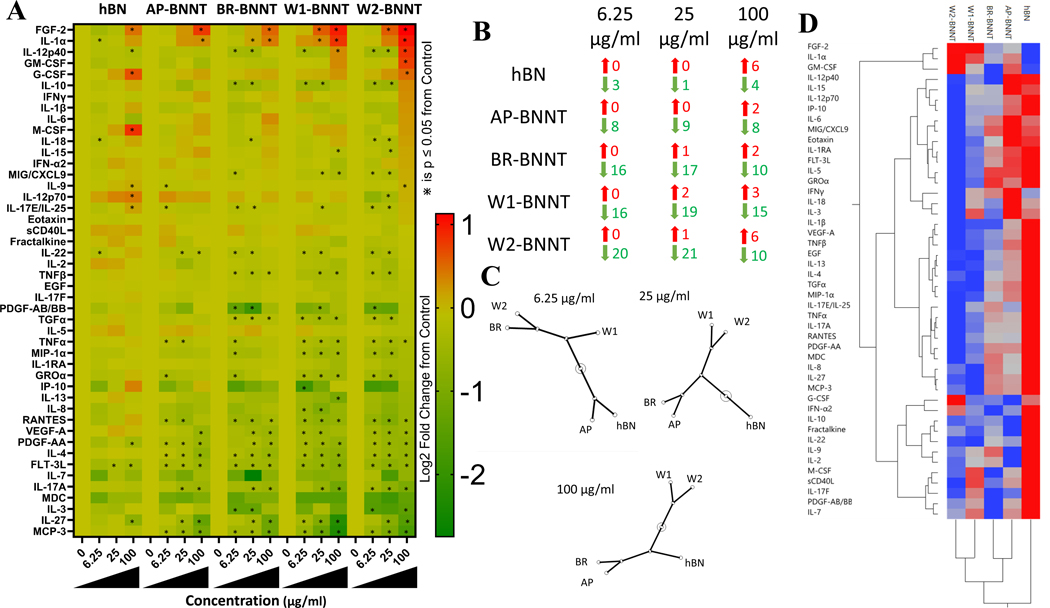
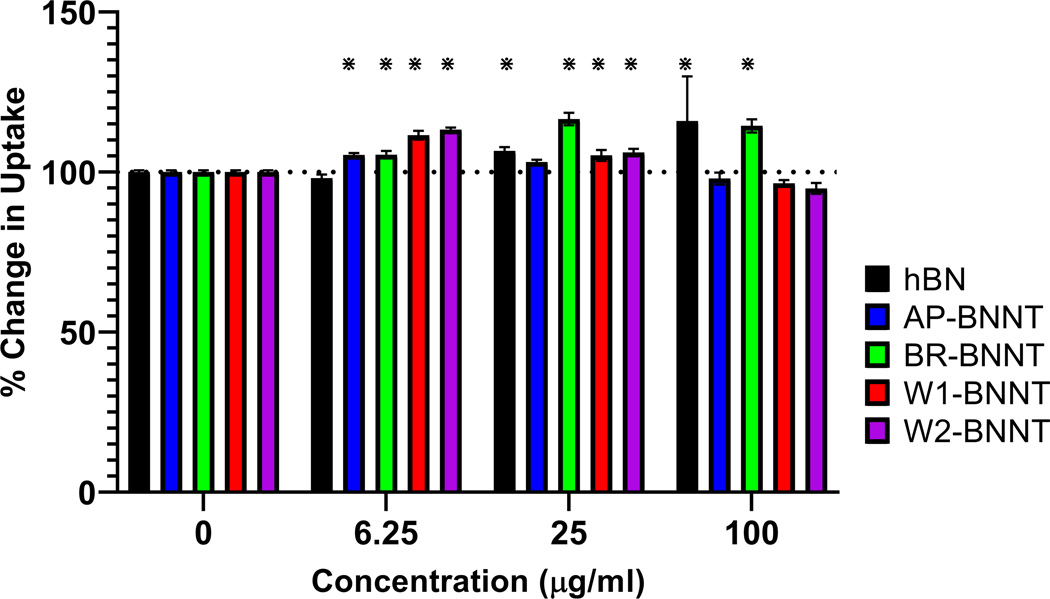
The toxicity of boron nitride nanotubes (BNNTs) has been the subject of conflicting reports, likely due to differences in the residuals and impurities that can make up to 30-60% of the material produced based on the manufacturing processes and purification employed. Four BNNTs manufactured by induction thermal plasma process with a gradient of BNNT purity levels achieved through sequential gas purification, water and solvent washing, allowed assessing the influence of these residuals/impurities on the toxicity profile of BNNTs. Extensive characterization including infrared and X-ray spectroscopy, thermogravimetric analysis, size, charge, surface area, and density captured the alteration in physicochemical properties as the material went through sequential purification. The material from each step is screened using acellular and in vitro assays for evaluating general toxicity, mechanisms of toxicity, and macrophage function. As the material increased in purity, there are more high-aspect-ratio particulates and a corresponding distinct increase in cytotoxicity, nuclear factor-κB transcription, and inflammasome activation. There is no alteration in macrophage function after BNNT exposure with all purity grades. The cytotoxicity and mechanism of screening clustered with the purity grade of BNNTs, illustrating that greater purity of BNNT corresponds to greater toxicity.
Keywords: NALP3 inflammasome; aspect ratio; boron nitride nanotubes; mechanism-based screening; nuclear factor-κB; purity; residuals; toxicity.
© 2022 National Research Council Canada. Small © 2022 Wiley-VCH GmbH. Reproduced with the permission of the Minister of Innovation, Science, and Economic Development. This article has been contributed to by U.S. Government employees and their work is in the public domain in the USA.
Conflict of interest statement
Conflict of Interest
The authors declare no conflict of interest.
Figures
Similar articles
-
Acute in vitro and in vivo toxicity of a commercial grade boron nitride nanotube mixture.Nanotoxicology. 2017 Oct;11(8):1040-1058. doi: 10.1080/17435390.2017.1390177. Epub 2017 Nov 2. Nanotoxicology. 2017. PMID: 29094619
-
Pilot in vivo toxicological investigation of boron nitride nanotubes.Int J Nanomedicine. 2012;7:19-24. doi: 10.2147/IJN.S28144. Epub 2012 Jan 4. Int J Nanomedicine. 2012. PMID: 22275819 Free PMC article.
-
Pectin-coated boron nitride nanotubes: In vitro cyto-/immune-compatibility on RAW 264.7 macrophages.Biochim Biophys Acta. 2016 Apr;1860(4):775-84. doi: 10.1016/j.bbagen.2016.01.020. Epub 2016 Jan 26. Biochim Biophys Acta. 2016. PMID: 26825772
-
Boron Nitride Nanotubes: Recent Advances in Their Synthesis, Functionalization, and Applications.Molecules. 2016 Jul 15;21(7):922. doi: 10.3390/molecules21070922. Molecules. 2016. PMID: 27428947 Free PMC article. Review.
-
Recent advancements in boron nitride nanotubes.Nanoscale. 2010 Oct;2(10):2028-34. doi: 10.1039/c0nr00335b. Epub 2010 Sep 14. Nanoscale. 2010. PMID: 20842308 Review.
Cited by
-
Boron Nanocomposites for Boron Neutron Capture Therapy and in Biomedicine: Evolvement and Challenges.Biomater Res. 2025 Feb 25;29:0145. doi: 10.34133/bmr.0145. eCollection 2025. Biomater Res. 2025. PMID: 40008112 Free PMC article. Review.
-
Pulmonary Toxicity of Boron Nitride Nanomaterials Is Aspect Ratio Dependent.ACS Nano. 2023 Dec 26;17(24):24919-24935. doi: 10.1021/acsnano.3c06599. Epub 2023 Dec 5. ACS Nano. 2023. PMID: 38051272 Free PMC article.
-
Understanding toxicity associated with boron nitride nanotubes: Review of toxicity studies, exposure assessment at manufacturing facilities, and read-across.J Mater Res. 2022 Oct 31;37(24):4620-4638. doi: 10.1557/s43578-022-00796-8. J Mater Res. 2022. PMID: 37193295 Free PMC article.
-
Environmental and Health Impacts of Graphene and Other Two-Dimensional Materials: A Graphene Flagship Perspective.ACS Nano. 2024 Feb 27;18(8):6038-6094. doi: 10.1021/acsnano.3c09699. Epub 2024 Feb 13. ACS Nano. 2024. PMID: 38350010 Free PMC article. Review.
References
-
- Jakubinek MB, Ashrafi B, Martinez-Rubi Y, Guan J, Rahmat M, Kim KS, Dénommée S, Kingston CT, Simard B, in Nanotube Superfiber Materials, 2nd ed., (Eds: Schulz MJ, Shanov V, Yin Z, M. Cahay), William Andrew Publishing, Norwich, NY: 2019, pp. 91–111.
-
- Lourie OR, Jones CR, Bartlett BM, Gibbons PC, Ruoff RS, Buhro WE, Chem. Mater 2000, 12, 1808.
-
- Wang J, Kayastha VK, Yap YK, Fan Z, Lu JG, Pan Z, Ivanov IN, Puretzky AA, Geohegan DB, Nano Lett. 2005, 5, 2528. - PubMed
Publication types
MeSH terms
Substances
Grants and funding
LinkOut - more resources
Full Text Sources
Research Materials
