. 2023 Jan 2;378(1867):20210081.
doi: 10.1098/rstb.2021.0081. Epub 2022 Nov 14.

Implications of tropical cyclones on damage and potential recovery and restoration of logged forests in Vietnam

Affiliations

Implications of tropical cyclones on damage and potential recovery and restoration of logged forests in Vietnam

S M Stas et al. Philos Trans R Soc Lond B Biol Sci. .

Abstract

Many natural forests in Southeast Asia are degraded following decades of logging. Restoration of these forests is delayed by ongoing logging and tropical cyclones, but the implications for recovery are largely uncertain. We analysed meteorological, satellite and forest inventory plot data to assess the effect of Typhoon Doksuri, a major tropical cyclone, on the forest landscapes of central Vietnam consisting of natural forests and plantations. We estimated the return period for a cyclone of this intensity to be 40 years. Plantations were almost twice as likely to suffer cyclone damage compared to natural forests. Logged natural forests (9-12 years after cessation of government-licensed logging) were surveyed before and after the storm with 2 years between measurements and remained a small biomass carbon sink (0.1 ± 0.3 Mg C ha-1 yr-1) over this period. The cyclone reduced the carbon sink of recovering natural forests by an average of 0.85 Mg C ha-1 yr-1, less than the carbon loss due to ongoing unlicensed logging. Restoration of forest landscapes in Southeast Asia requires a reduction in unlicensed logging and prevention of further conversion of degraded natural forests to plantations, particularly in landscapes prone to tropical cyclones where natural forests provide a resilient carbon sink. This article is part of the theme issue 'Understanding forest landscape restoration: reinforcing scientific foundations for the UN Decade on Ecosystem Restoration'.

Keywords: Southeast Asia; forest biomass; logging; tropical cyclones.


Figures
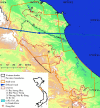
Figure 1.
Figure 1.
Study area (boundary indicated with orange line) and path of Doksuri typhoon (blue line). Elevation ranges from green (0 m) to white (1500 m). (Online version in colour.)
Figure 2.
Figure 2.
Frequency and return period of tropical cyclones in Vietnam. (a) Frequency of tropical cyclones shown according to latitude and by month of year. (b) Return period of tropical cyclones calculated based on 10-m wind speeds (m s−1). Typhoon Doksuri is indicated. Dashed lines indicate 5th and 95th percentile uncertainty range. (Online version in colour.)
Figure 3.
Figure 3.
Carbon fluxes for forest plots experiencing light (L), moderate (M) and heavy (H) storm damage as identified by analysis of S-2 ΔNBR. (Online version in colour.)
Figure 4.
Figure 4.
Mean ΔNBR from Sentinel-2 imagery plotted against the net change in above-ground carbon (ΔCC) from the forest plots. Results from the linear regression are shown, with a solid line showing line of best fit, shaded area showing 95% confidence limits for the slope and dotted lines showing 95% prediction limits. (Online version in colour.)
Figure 5.
Figure 5.
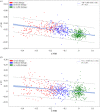
Identification of storm damage based on Sentinel-2 (S-2) and Sentinel-1 (S-1) data. The mean change in normalized burn ratio (ΔNBR) from S-2 is plotted against (a) mean ΔVH and (b) ΔVV from S-1 for 800 randomly selected forest locations across the study area, manually classified by storm damage (no/light, moderate and severe damage). ΔNBR, ΔVH and ΔVV are calculated as post-storm minus pre-storm values. Results from the linear regression are shown, with a solid line showing line of best fit, shaded area showing 95% confidence limits for the slope and dotted lines showing 95% prediction limits. (Online version in colour.)
Figure 6.
Figure 6.
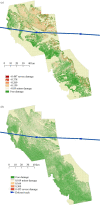
Map of forest damage across study area caused by Typhoon Doksuri for (a) Sentinel-2 and (b) Sentinel-1 imagery. Little or no damage (green) is classified as ΔNBR > −0.05 (S-2) or ΔVH < 0.019 (S-1). Hatched areas indicate non-forest areas or for (a) areas of cloud cover on date of post-typhoon S-2 image for which no assessment of damage was possible. (Online version in colour.)

References

    1. Mitchard ETA. 2018. The tropical forest carbon cycle and climate change. Nature 559, 527-534. (10.1038/s41586-018-0300-2) - DOI - PubMed
    1. Baccini A, Walker W, Carvalho L, Farina M, Sulla-Menashe D, Houghton RA. 2017. Tropical forests are a net carbon source based on aboveground measurements of gain and loss. Science 358, 230-234. (10.1126/science.aam5962pmid:28971966) - DOI - PubMed
    1. Erb K-H, et al. 2018. Unexpectedly large impact of forest management and grazing on global vegetation biomass. Nature 553, 73-76. (10.1038/nature25138) - DOI - PMC - PubMed
    1. Philipson CD, et al. 2020. Active restoration accelerates the carbon recovery of human-modified tropical forests. Science 369, 838-841. (10.1126/science.aay4490) - DOI - PubMed
    1. Hu J, Herbohn J, Chazdon R, Baynes J, Vanclay J. 2020. Above-ground biomass recovery following logging and thinning over 46 years in an Australian tropical forest. Sci. Total Environ. 734, 139098. - PubMed

Publication types