. 2022 Nov;2(11):e587.
doi: 10.1002/cpz1.587.

Spectrally Resolved Fiber Photometry for In Vivo Multi-Color Fluorescence Measurements

Affiliations

Spectrally Resolved Fiber Photometry for In Vivo Multi-Color Fluorescence Measurements

Jingheng Zhou et al. Curr Protoc. 2022 Nov.

Abstract

This article describes how to assemble and operate a spectrometer-based fiber photometry system for in vivo simultaneous measurements of multiple fluorescent biosensors in freely moving mice. The first section of the article describes the step-by-step procedure to assemble a basic single-spectrometer fiber photometry system and how to expand it into a dual-spectrometer system that allows for simultaneous recordings from two sites. The second part describes the steps for a typical fiber probe implantation surgery. The last section describes how to acquire and analyze the time-lapsed spectral data. This article is intended for teaching labs how to build their own fiber photometry systems (with a video tutorial) from commercially available parts and perform in vivo recordings in behaving mice. © Published 2022. This article is a U.S. Government work and is in the public domain in the USA. Basic Protocol 1: Assembling a dual-laser, single-spectrometer fiber photometry system Support Protocol: Dual-spectrometer fiber photometry assembly Basic Protocol 2: Optical fiber probe implantation Basic Protocol 3: Data acquisition and analysis.

Keywords: fiber photometry • fluorescence • multi-color • spectrally resolved.


Figures

Figure 1 |
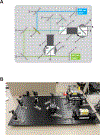
Figure 1 |. Dual-spectrometer fiber photometry system for simultaneous dual-site dual-color measurements.
(A) Illustration of the layout of a dual-spectrometer fiber photometry system with 488nm and 561nm lasers. Shown in the picture are neutral density filters (1), dielectric mirrors (2), dichroic mirrors (3), 50:50 non-polarizing beam splitter cube (4), lens tubes (5), dual-edge dichroic filters (6), aspheric fiber ports (7), emission filters (8), achromatic fiber ports (9). Note: the spectrometers and the connecting fiber patch cords are not shown in the picture. (B) Picture of an assembled dual-spectrometer fiber photometry system with the components illustrated in (A).
Figure 2 |
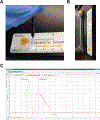
Figure 2 |. Patch cable and fiber probe setup for fiber implantation and an example of GCaMP6f and jRGECO1a fluorescence spectra detected by the spectrometer during the implantation surgery.
(A) An ideal laser beam emitted from a cleaved end of an implantable optical fiber probe. (B) A patch cable connected with a probe is attached to a vertical arm of a stereotaxic frame by a side clamp, ready for implantation. (C) An example of the fluorescence emission spectra of GCaMP6f and jRGECO1a detected by the spectrometer during fiber implantation (the peak of GCaMP6f spectrum is 514 nm and the peak of jRGECO1a spectrum is 600 nm).
Figure 3 |
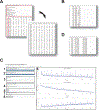
Figure 3 |. A step-by-step illustration of linear unmixing.
(A) Open the text file with Excel. Delete title information and first column (circled in red) to make the first row as wavelength and first column as time point of each frame. (B) Normalized GCaMP6f and jRGECO1a reference spectra file, needed for linear unmixing. (C) A screen shot of the operational window of the linear unmixing algorithm in R software. Upload the mixed spectra file (obtained in A) in box (1), the reference file (an example shown in B) in box (2), set range of wavelength in box (3), Assign the names of Component 1 & 2 in box (4) and click “run” (5) to run the algorithm. Component 1 & 2 coefficient plot and the ratio plot will be shown in a window on the right (6) after the unmixing is done. Assign a name for the output file in box (7) and download the unmixing result (8). (D) An example of the downloaded file after running the linear unmixing algorithm.
Figure 4 |
Figure 4 |. A step-by-step procedure for fluorescence fading correction.
(A) The coefficients of GCaMP6f and jRGECO1a (produced by linear unmixing) plotted over time. (B) The coefficients of GCaMP6f and jRGECO1a plotted together with a fitting curve (the black dashed line) which is used for correction of the baseline decrease caused by fluorescence fading. The curve is produced by nonlinear regression (one- or two-phase decay) or linear regression of the whole recorded trace. The choice of fitting algorithm should be decided case by case. (C) The percent change of coefficients of GCaMP6f and jRGECO1a calculated from the fitted spectrum plotted over time after baseline correction. (D) The Z scores of the baseline-corrected coefficients of GCaMP6f and jRGECO1a plotted over time.

References

    1. Chen TW, Wardill TJ, Sun Y, Pulver SR, Renninger SL, Baohan A, … Kim DS (2013). Ultrasensitive fluorescent proteins for imaging neuronal activity. Nature, 499(7458), 295–300. doi:10.1038/nature12354 - DOI - PMC - PubMed
    1. Cui G, Jun SB, Jin X, Luo G, Pham MD, Lovinger DM, … Costa RM (2014). Deep brain optical measurements of cell type-specific neural activity in behaving mice. Nat Protoc, 9(6), 1213–1228. doi:10.1038/nprot.2014.080 - DOI - PMC - PubMed
    1. Cui G, Jun SB, Jin X, Pham MD, Vogel SS, Lovinger DM, & Costa RM (2013). Concurrent activation of striatal direct and indirect pathways during action initiation. Nature, 494(7436), 238–242. doi:10.1038/nature11846 - DOI - PMC - PubMed
    1. Dana H, Mohar, Sun, Narayan, Gordus, Hasseman, … Kim DS (2016). Sensitive red protein calcium indicators for imaging neural activity. Elife, 5. doi:10.7554/eLife.12727 - DOI - PMC - PubMed
    1. Dana H, Sun Y, Mohar B, Hulse B, Hasseman JP, Tsegaye G, … Macklin J. J. J. b. (2018). High-performance GFP-based calcium indicators for imaging activity in neuronal populations and microcompartments. 434589. - PubMed

LinkOut - more resources