. 2022 Dec 1;15(12):dmm049721.
doi: 10.1242/dmm.049721. Epub 2022 Dec 6.

Ts66Yah, a mouse model of Down syndrome with improved construct and face validity

Affiliations

Ts66Yah, a mouse model of Down syndrome with improved construct and face validity

Arnaud Duchon et al. Dis Model Mech. .

Abstract

Down syndrome (DS) is caused by trisomy of human chromosome 21 (Hsa21). The understanding of genotype-phenotype relationships, the identification of driver genes and various proofs of concept for therapeutics have benefited from mouse models. The premier model, named Ts(1716)65Dn/J (Ts65Dn), displayed phenotypes related to human DS features. It carries an additional minichromosome with the Mir155 to Zbtb21 region of mouse chromosome 16, homologous to Hsa21, encompassing around 90 genes, fused to the centromeric part of mouse chromosome 17 from Pisd-ps2/Scaf8 to Pde10a, containing 46 genes not related to Hsa21. Here, we report the investigation of a new model, Ts66Yah, generated by CRISPR/Cas9 without the genomic region unrelated to Hsa21 on the minichromosome. As expected, Ts66Yah replicated DS cognitive features. However, certain phenotypes related to increased activity, spatial learning and molecular signatures were changed, suggesting genetic interactions between the Mir155-Zbtb21 and Scaf8-Pde10a intervals. Thus, Ts66Yah mice have stronger construct and face validity than Ts65Dn mice for mimicking consequences of DS genetic overdosage. Furthermore, this study is the first to demonstrate genetic interactions between triplicated regions homologous to Hsa21 and others unrelated to Hsa21. This article has an associated First Person interview with the first author of the paper.

Keywords: Behavior and cognition; Gene dosage; Gene expression; Mouse model.


Conflict of interest statement

Competing interests The authors declare no competing or financial interests.

Figures
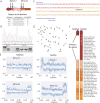
Fig. 1.
Fig. 1.
Generation and validation of the new Ts66Yah mouse model. (A) Representation of the deletion produced in Ts65Dn using CRISPR/Cas9 and two pairs of gRNAs. (B) Sequence electropherogram and PCR amplification products from the genotyping of Ts66Yah mice. (C) Genomic sequence of the new junction found in the deleted minichromosome of Ts66Yah mice. Blue font shows PCR primer localizations. (D) One metaphase spread showing the presence of an additional minichromosome (arrow) in Ts66Yah fibroblasts. (E) Comparative genomic hybridization (log2) of genomic DNA from Ts66Yah mice versus wild type (180K probes) compared to Ts65Dn mice (two 100K probes). (F) Comparison of the Ts66Yah and Ts65Dn minichromosomes. Orange and red colors show the sequence of Mmu17 and Mmu16, respectively. Numbers with letters represent the Giemsa banding.
Fig. 2.
Fig. 2.
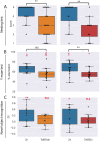
Nesting activities and working memories display similar changes in male Ts66Yah and Ts65Dn mice. (A) Mice with trisomy showed deficits in building a nest, whereas the majority of 2n mice were able to build a nest (22 2n males versus 25 Ts66Yah males, and 15 2n males versus 12 Ts65Dn males). (B) Although there was no significant difference in the percentage of alternation between 2n and Ts66Yah males, the level was significantly above 50% (chance level) in 2n, but not in Ts66Yah, mice. Conversely, the Ts65Dn line showed a strong difference in males, with a significantly lower percentage of alternation for the trisomic group compared to chance level, as well as reduced spontaneous alternation compared to 2n mice. (C) In the novel object recognition test, the discrimination index (DI) analysis indicated that Ts66Yah and Ts65Dn males were not able to distinguish the novel object (DI was close to 0). Box plots with the median and quartiles. Statistical significance of differences between genotype was inferred by an unpaired two-tailed t-test or Kruskal–Wallis non-parametric test, *P<0.05, **P<0.01. One-sample two-tailed t-test result versus 0 for DI in C, or versus 50 for Y maze in B, is indicated in red.
Fig. 3.
Fig. 3.
Spatial learning and memory in the Morris water maze (MWM) task differs between male Ts66Yah and Ts65Dn mice. (A) Schematic representation of the test. (B,J) Both trisomic mice (22 2n males versus 22 Ts66Yah males, B; and 20 2n males versus 18 Ts65Dn males, J) exhibited a delay in acquisition during the learning phase of the test, resulting in increased latency to find the platform. (C,D,K,L) In addition, the Ts65Dn mice presented increased thigmotaxic behavior (C,K), while velocity was stable regardless of the genotype (D,L). (H,P) In the probe test, only the Ts65Dn mice did not present increased exploration of the target quadrant, indicating a clear deficit in reference memory not observed in Ts66Yah mice. (E) During the reversal phase, the augmented latency to find the platform was close to the significant level for the Ts66Yah mice, whereas the difference was clearly increased for the Ts65Dn mice. (M) There was no difference in velocity (D,G,L,O) for both lines and the thigmotaxic behavior was not found in the Ts66Yah males compared to Ts65Dn (C,F versus K,N). (I,Q) For the reversal probe test, once again, only the Ts65Dn mice did not present preferences for the target quadrant. Box plots with the median and quartiles. Statistical significance of differences between groups was inferred by a repeated measures ANOVA. *P<0.05, **P<0.01, ***P<0.001. One-sample two-tailed t-test result versus 25% is indicated in red in the graph for PT. P-values for repeated measures ANOVA (genotype, block) are indicated for B-G and J-O. PT, probe test; TQ, target quadrant.
Fig. 4.
Fig. 4.
Identification of the strongest phenotypic variables contributing to genotype discrimination in male Ts66Yah and Ts65Dn mice. (A-D) Importance of each explanatory phenotypic variable in the genotype discrimination. The selected variables were those known to contribute more than 30% to the genotype discrimination. All measures of importance are scaled to obtain a maximum value of 100 for the variable contributing most to the discrimination in the comparison of Ts66Yah Down syndrome (DS) mutants versus wild types. (B,C) 3D principal component analysis (PCA) plots showing the individual animals clustering on the 3D space based on the PCA analyses performed with all the phenotypic variables and colored based on genotype and model as follows: dark blue, Ts66Yah wild type; yellow, Ts66Yah DS mutant. (C-F) Individual component map. The distribution in 2D space of the individual observation coordinates calculated based on the PCA analysis performed after the multiple factor analysis (MFA) of the MFAmix function. Ts66Yah mice are shown in A-C; Ts65Dn mice are shown in D-F.
Fig. 5.
Fig. 5.
Comparison of the morphological changes in the brain (magnetic resonance imaging) and skull (computed tomography scans) of male Ts66Yah and Ts65Dn mice. We analyzed different brain regions/structures, taking into consideration the whole brain volume. (A) The z-score was calculated as the mean of control (wt) mice minus the mean of transgenic mice divided by each type of wt and trisomic (Ts) mouse. Changes were similar between the Ts66Yah (2n, n=6; Ts, n=7; males) and Ts65Dn (2n, n=5; Ts, n=6; males), although the amplitude of the changes was less drastic in Ts66Yah mice than in Ts65Dn mice. (B) PCA analysis indicated that Ts65Dn mice were more affected than their respective wt mice compared to the Ts66Yah mice. (C) The 39 landmarks used for craniofacial analysis. (D-F) Craniofacial analysis. (D) PCA analysis after generalized Procrustes indicated that, for cranial skull and mandibular, the 2n (n=13) and the Ts66Yah (n=10) male groups were well separated, whereas the Ts65Dn (n=15) males were less well separated from their control 2n littermates (n=16). (E,F) The shape differences between the means of groups was visualized graphically by obtaining the average landmark coordinates for each group and the overall mean and plotting the differences as thin-plate spline transformation grids for the two axes. The x-y axis was less affected than the y-z axis for both skull and mandible.
Fig. 6.
Fig. 6.
Functional analysis of expressed genes and pathways altered in the Ts66Yah compared to Ts65Dn DS models in hippocampi (HIP) and entorhinal cortices (EC) from male mice. (A) Venn diagrams for the differentially expressed genes found in common between the Ts66Yah and Ts65Dn HIP and EC. Right panel highlights the model-specific and common pathways altered between Ts66Yah and Ts65Dn HIP samples in the upper part and the EC datasets of both the Ts65Dn and Ts66Yah models in the lower part. DFA, differential functional analysis. (B) Heatmap representation of the number and regulation sense of the meta-pathways found in the Ts65Dn and Ts66Yah HIP and EC. The color key breaks represent the number of pathways within the meta-pathways. (C) Scatter plot showing the inter-tissue comparison of the percentage of pathways included on each meta-pathway, normalized by the total number of unique pathways per meta-pathway for Ts66Yah (upper panel) and Ts65Dn (lower panel) on the x-axis and y-axis, representing the HIP and EC, respectively, for the Ts66Yah or Ts65Dn models,. (D) Similar representation showing the inter-model comparison with the percentage of pathways included on each meta-pathway (group of pathways) normalized by the total number of unique pathways per meta-pathway found in the HIP of Ts66Yah (x-axis) compared to that of Ts65Dn (y-axis).
Fig. 7.
Fig. 7.
Central protein–protein interaction and regulatory gene connectivity network (RegPPINet) involved in the synaptic meta-pathway identified in Ts65Dn and Ts66Yah males, highlighting the top 30 genes identified by betweenness centrality analysis. (A) Central RegPPINet of genes involved in the synaptic meta-pathway identified in Ts65Dn and Ts66Yah, highlighting the main subnetworks found. (B) The same central RegPPINet, highlighting in color from red to yellow the proteins more central for the communication flow over the network identified by the centrality analysis using the betweenness index.

References

    1. Adams, D. C. and Otárola-Castillo, E. (2013). geomorph: an r package for the collection and analysis of geometric morphometric shape data. Methods Ecol. Evol. 4, 393-399. 10.1111/2041-210X.12035 - DOI
    1. Aït Yahya-Graison, E., Aubert, J., Dauphinot, L., Rivals, I., Prieur, M., Golfier, G., Rossier, J., Personnaz, L., Créau, N., Bléhaut, H.et al. (2007). Classification of human chromosome 21 gene-expression variations in Down syndrome: impact on disease phenotypes. Am. J. Hum. Genet. 81, 475-491. 10.1086/520000 - DOI - PMC - PubMed
    1. Arbogast, T., Raveau, M., Chevalier, C., Nalesso, V., Dembele, D., Jacobs, H., Wendling, O., Roux, M., Duchon, A. and Herault, Y. (2015). Deletion of the App-Runx1 region in mice models human partial monosomy 21. Dis. Model. Mech. 8, 623-634. 10.1242/dmm.017814 - DOI - PMC - PubMed
    1. Ashburner, M., Ball, C. A., Blake, J. A., Botstein, D., Butler, H., Cherry, J. M., Davis, A. P., Dolinski, K., Dwight, S. S., Eppig, J. T.et al. (2000). Gene ontology: tool for the unification of biology. Nat. Genet. 25, 25-29. 10.1038/75556 - DOI - PMC - PubMed
    1. Avants, B. B., Epstein, C. L., Grossman, M. and Gee, J. C. (2008). Symmetric diffeomorphic image registration with cross-correlation: evaluating automated labeling of elderly and neurodegenerative brain. Med. Image Anal. 12, 26-41. 10.1016/j.media.2007.06.004 - DOI - PMC - PubMed

Publication types

Substances