. 2023 Feb 6;13(2):386-409.
doi: 10.1158/2159-8290.CD-22-0342.

OncoLoop: A Network-Based Precision Cancer Medicine Framework

Affiliations

OncoLoop: A Network-Based Precision Cancer Medicine Framework

Alessandro Vasciaveo et al. Cancer Discov. .

Abstract

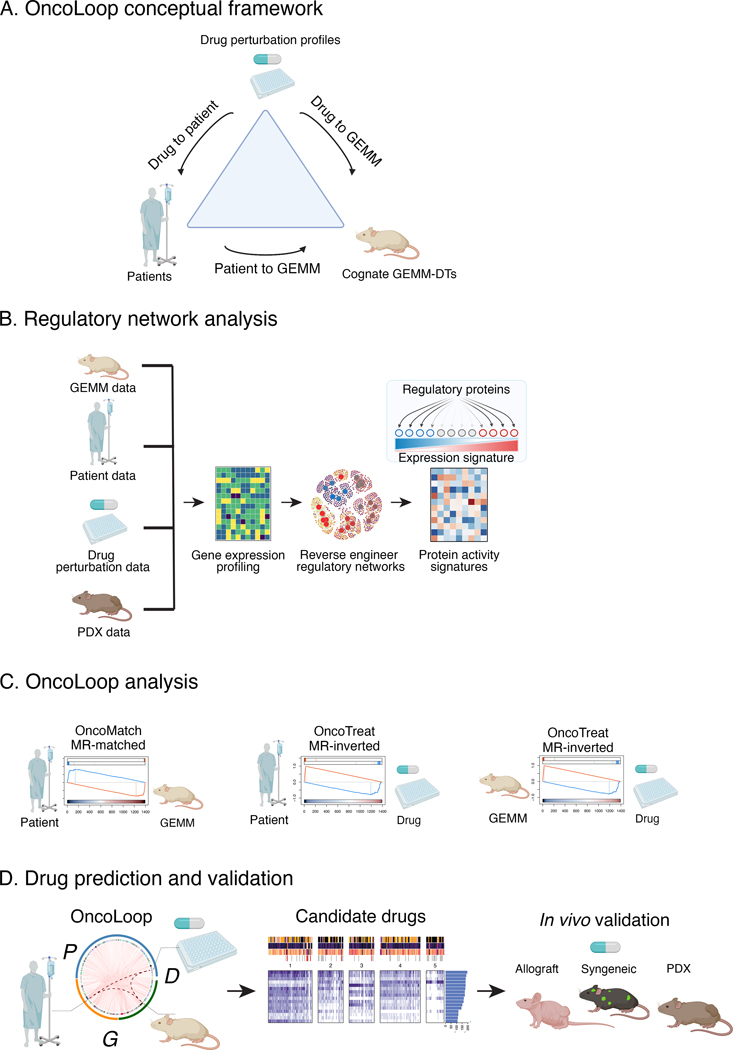
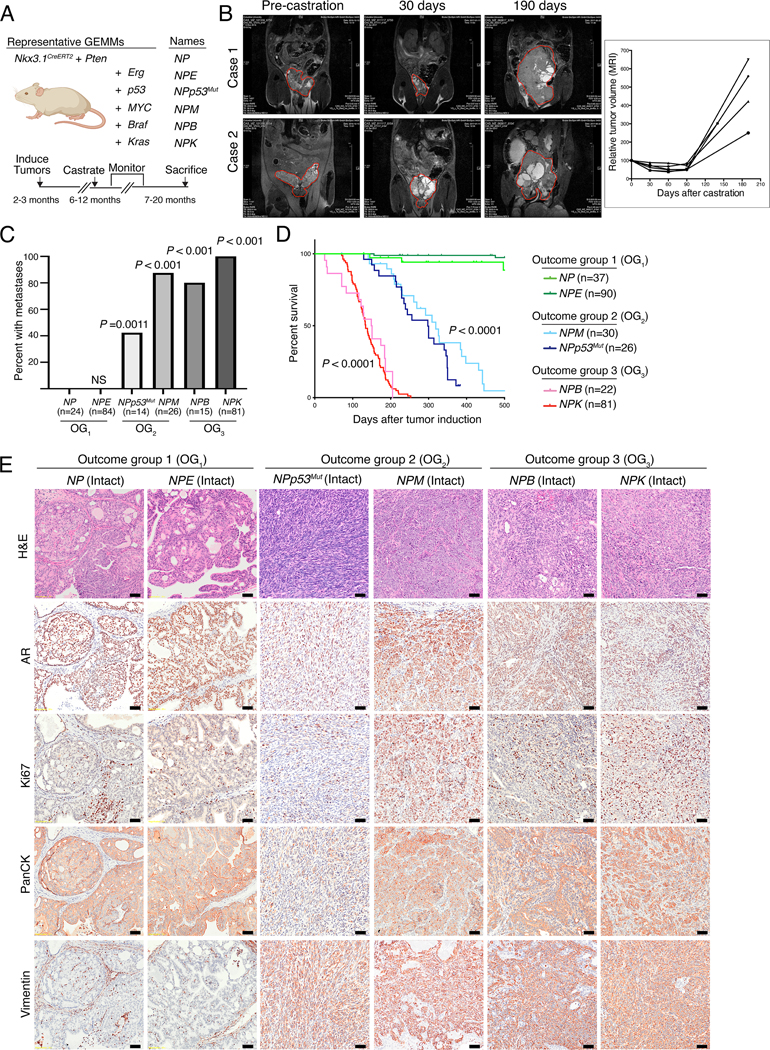
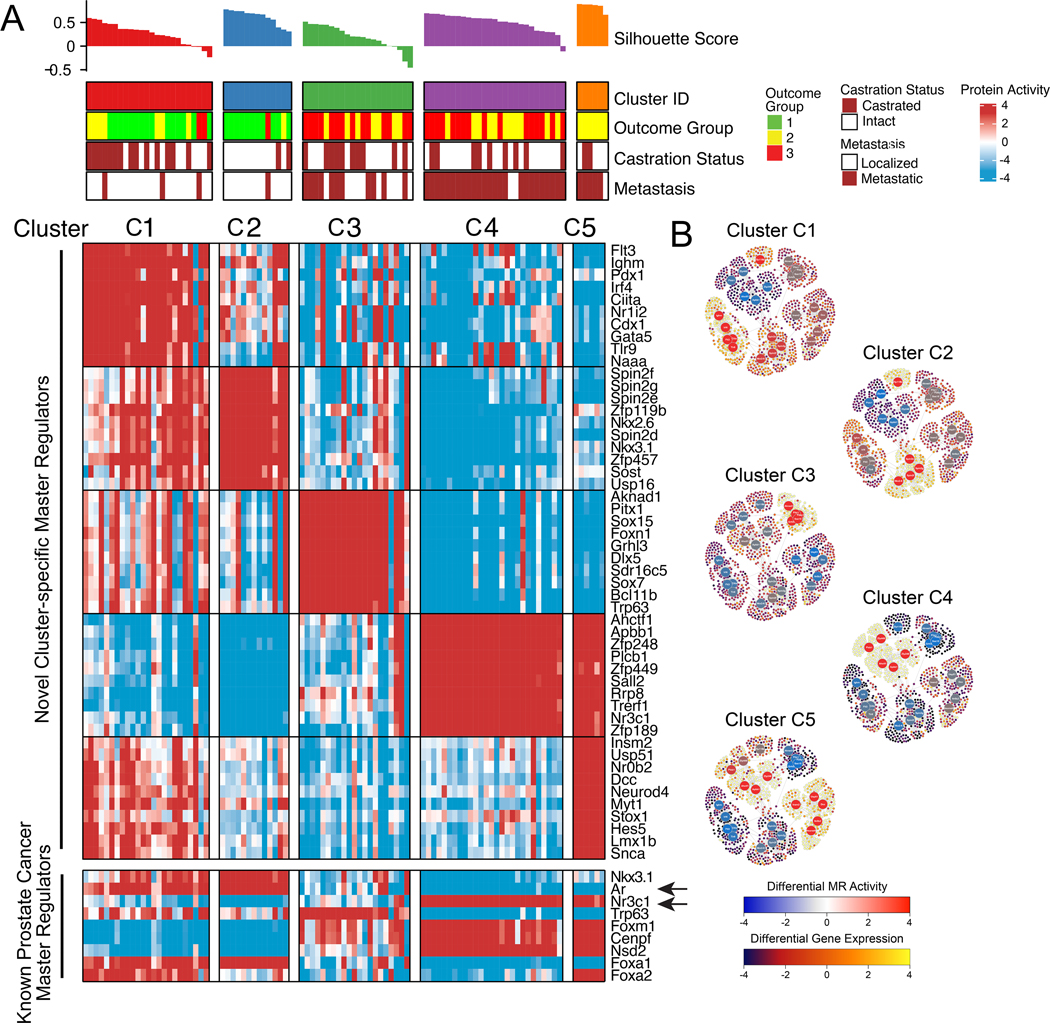
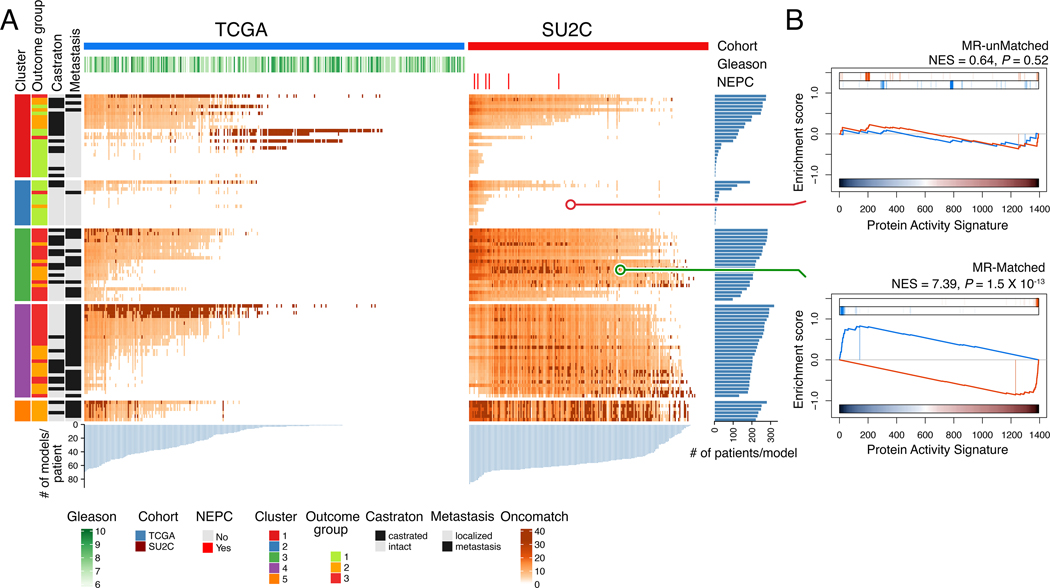
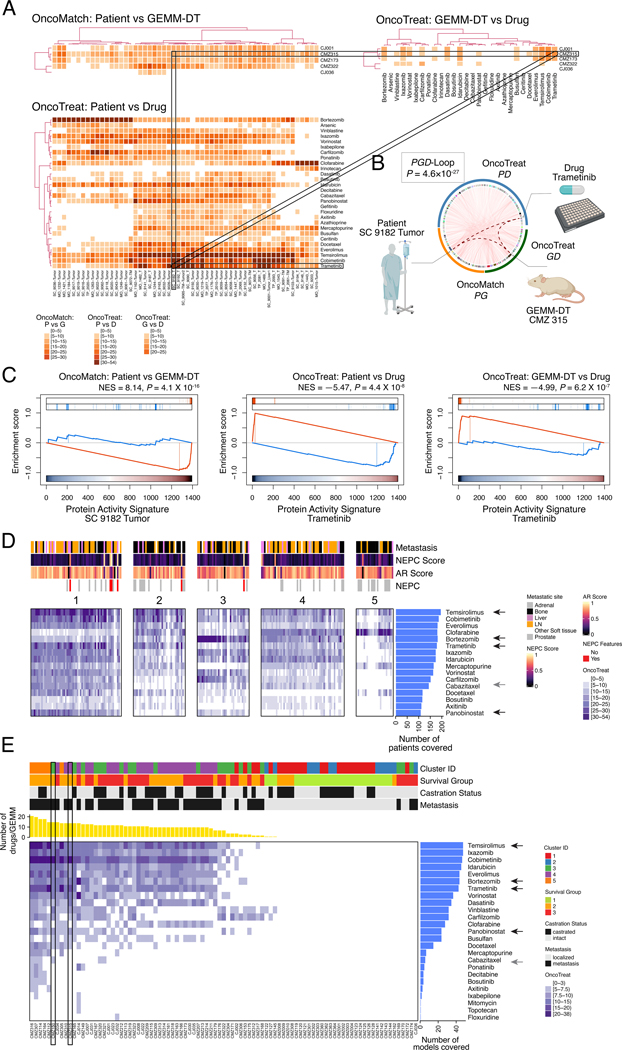
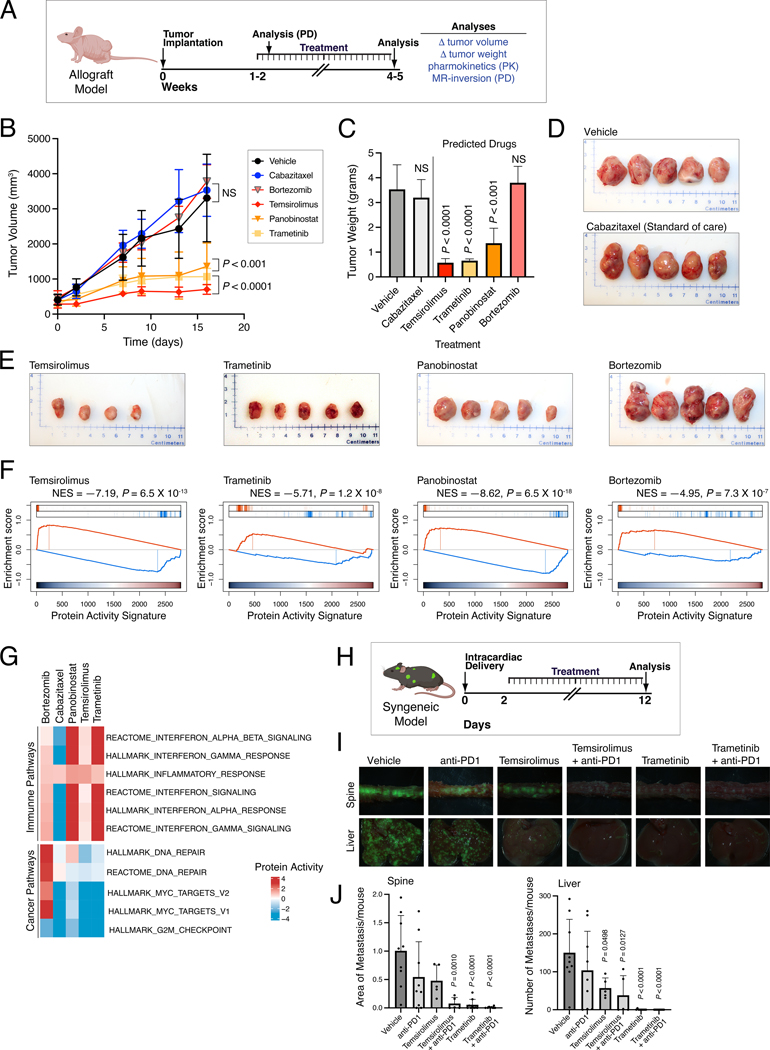
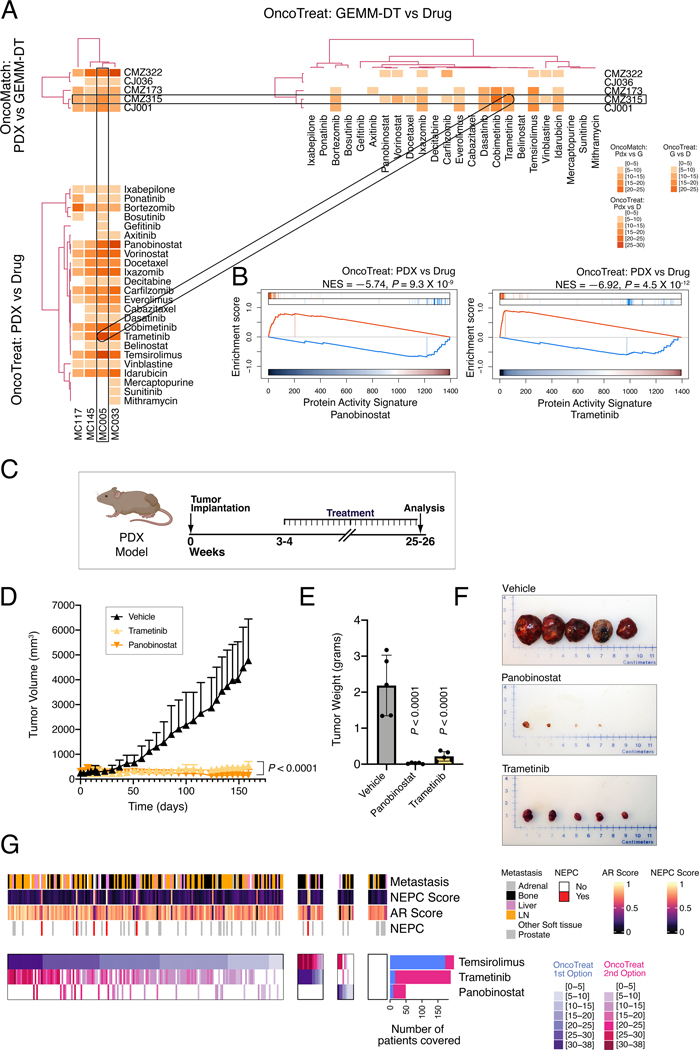
Prioritizing treatments for individual patients with cancer remains challenging, and performing coclinical studies using patient-derived models in real time is often unfeasible. To circumvent these challenges, we introduce OncoLoop, a precision medicine framework that predicts drug sensitivity in human tumors and their preexisting high-fidelity (cognate) model(s) by leveraging drug perturbation profiles. As a proof of concept, we applied OncoLoop to prostate cancer using genetically engineered mouse models (GEMM) that recapitulate a broad spectrum of disease states, including castration-resistant, metastatic, and neuroendocrine prostate cancer. Interrogation of human prostate cancer cohorts by Master Regulator (MR) conservation analysis revealed that most patients with advanced prostate cancer were represented by at least one cognate GEMM-derived tumor (GEMM-DT). Drugs predicted to invert MR activity in patients and their cognate GEMM-DTs were successfully validated in allograft, syngeneic, and patient-derived xenograft (PDX) models of tumors and metastasis. Furthermore, OncoLoop-predicted drugs enhanced the efficacy of clinically relevant drugs, namely, the PD-1 inhibitor nivolumab and the AR inhibitor enzalutamide.

Significance: OncoLoop is a transcriptomic-based experimental and computational framework that can support rapid-turnaround coclinical studies to identify and validate drugs for individual patients, which can then be readily adapted to clinical practice. This framework should be applicable in many cancer contexts for which appropriate models and drug perturbation data are available. This article is highlighted in the In This Issue feature, p. 247.


Conflict of interest statement

Conflicts of interest:

None of the other authors report any conflicts of interest.

Figures

Figure 1:
Figure 1:. The OncoLoop conceptual framework
A. Conceptual overview: OncoLoop was designed to identify high-fidelity (cognate) models—in this study, GEMM-derived tumors (GEMM-DTs)— of a patient’s tumor as well as drugs capable of inverting the MR protein activity for both the patient and their cognate GEMM-DT. To accomplish this, OncoLoop performs integrative analysis of transcriptomic (RNA-seq) profiles from a patient’s tumor, their cognate model, and drug perturbation assays. B. Regulatory network analysis: Gene expression profiles generated from each data source are used to reverse-engineer species- and cohort-specific regulatory networks, which are then used to transform differential gene expression signature into differential protein activity profiles. C. OncoLoop analysis: Gene Set Enrichment Analysis (GSEA) is used to assess the overlap in differentially active MR proteins between a human tumor and its cognate GEMM-DTs (OncoMatch). Similarly, GSEA is used to identify drugs capable of inverting the MR activity (MR-inverter drugs) for each patient and cognate GEMM-DT(s) pair. D. Drug prediction and validation: Representative Circos plot illustrating PGD-loops generated by matching a patient (P) to a GEMM-DT (G) and connecting them to each shared MR-inverter drug (D). Candidate drugs are first prioritized by pharmacotype analysis to identify the subset of patients predicted to be sensitive to the same subset of drugs, and then validated in vivo using a cognate GEMM-DT-derived allograft, a syngeneic model of metastasis and a PDX model. (Created with BioRender.com).
Figure 2:
Figure 2:. A GEMM resource that models prostate cancer progression
A. Schematic showing representative GEMMs used in this study. The GEMMs were generated by crossing NP mice (for Nkx3.1CreERT2/+; Ptenflox/flox) with the alleles shown in the panel to generate six complex strains. The timeline for tumor induction, castration, monitoring, and sacrificing is shown at the bottom of the panel. (Created with BioRender.com). B. MRI images showing tumor volume changes after castration of two representative NPp53 mice (Case 1 and Case 2). The plot on the right shows the tumor volume changes over time for 4 representative NPp53 mice. C. Frequency of metastasis observed in the GEMMs. The numbers of mice used to determine metastasis frequency for each model are indicated in parentheses; two-tailed P-values are shown for Fisher’s exact test comparing each model to the NP mice (control). OG, outcome group. D. Kaplan-Meier survival analysis shown for the models in the three outcome groups (OG1, OG2, and OG3). P-values were calculated using a two-tailed log-rank test compared to the NP mice (control). For the analyses shown in (C) and (D), both intact and castrated mice were pooled for all GEMMs except NPM, where the effects of castration may be confounded by the AR-dependency of the Probasin promoter used to drive Myc expression (see Detailed Materials and Methods). E. Representative images for hematoxylin and eosin (H&E) (top row) and immunohistochemical staining of the indicated markers in primary tumors from intact mice of the different GEMMs. Shown are representative images based on analyses 3 or more mice/group; scale bars represent 50 μm. See also Table S1, and Figures S1–S3.
Figure 3:
Figure 3:. GEMM subtypes recapitulate human PCa phenotypes
A. Heatmap illustrating the results of protein activity-based cluster analysis of 91 GEMM-derived tumors (GEMM-DTs), as well as the silhouette score and correlative variables, such as outcome group, castration status, and metastatic progression. Shown are five molecularly-distinct clusters (C1 – C5) that co-segregate with survival and metastatic potential. Indicated for each cluster are the 10 most significantly activated MRs (top heatmap), and the activity levels of 9 established human PCa markers (bottom heatmap). Arrows indicate the activities of Ar and glucocorticoid receptor (Nr3c1), which are inversely correlated. B. Representative sub-networks, representing the activity of the 25 most differentially active MR proteins (5 per cluster, large circles) across all clusters and the expression of their regulatory targets (small circles) on a cluster-by-cluster basis. Protein activity is shown using a blue (inactivated) to red (activated) scale, while target expression is shown on a blue (under-expressed) to yellow (over-expressed) scale. High resolution images with full visibility of the MRs are shown in Figure S5. See also Table S2, and Figures S4, S5, S6.
Figure 4:
Figure 4:. Matching GEMM-DTs to patient tumor and metastases
A. Heatmaps representing the MR-based fidelity score of each tumor sample (columns) versus each GEMM-DT model (rows), for the TCGA (right) and SU2C (left) cohort, respectively. Relevant patient phenotypic variables—i.e., Cohort, Gleason score, and NEPC status—are shown in the top three bars, while relevant GEMM-DT phenotypic variables—i.e., Cluster, outcome, castration status, and metastasis status—are shown in the four vertical bars to the left of the heatmap. Fidelity scores are computed as the Log10P of the patient vs. GEMM-DT MR enrichment analysis. The 5 top-most significant cognate models for each patient are shown in dark red; other statistically significant (P ≤ 10−5) high-fidelity models are shown using a lighter to darker color scale (as shown). The light blue barplots at the bottom of the two heatmaps shows the number of candidate cognate models for each patient, while the dark blue barplots to the right show the number of patients for which a GEMM-DT represents a cognate model. Overall, 78% of the samples in the TCGA (n = 261 of 334) and 93% of those in the SU2C cohorts (n = 198 of 212) have at least one cognate GEMM-DT. B. GSEA of the fidelity analysis for representative GEMM-DT-SU2C pairs showing an example of an MR-unmatched (low-fidelity, top) and an MR-matched (high-fidelity, bottom) pair. See also Table S4.
Figure 5:
Figure 5:. OncoLoop analysis
A. Illustrative examples of a PGD-Loop: three heatmaps representing a subset of patients, GEMM-DTs, and drugs are shown. The top left heatmap (OncoMatch: Patient vs. GEMM-DT) shows the fidelity scores for 56 SU2C samples (columns) and 5 GEMM-DTs (rows); the bottom left heatmap (OncoTreat: Patient vs. Drug) shows the MR-inverter scores for 28 drugs (rows), as assessed against 56 SU2C samples (columns); finally, the top right heatmap (OncoTreat: GEMM-DT vs. Drug) shows the MR-inverter scores for the same 28 drugs (columns) as assessed against the 5 GEMM-DTs (rows). All scores are computed as (Log10P) and statistically significant scores (P ≤ 10−5) are shown with a light to dark color scale, as indicated; non-significant scores are shown in white. MR-inverter scores are based on MR activity inversion analysis based on the drug- vs. vehicle control-treated DU145 cells. For visualization purposes, heatmap results are depicted by hierarchical clustering. Among the many statistically significant PGD-Loops, we highlight one formed by the SU2C sample SC_9182_T, his top-ranked cognate GEMM-DT (CMZ315), and the drug trametinib. (Created with BioRender.com). B. Circos plot showing all significant PGD-loops, including the one highlighted in panel A (thicker dotted curves). P-value calculated by integrating the three associated scores. C. GSEA plots for the three relationships in the highlighted PGD-loop, including (a) the patient to cognate GEMM-DT fidelity analysis (OncoMatch: Patient vs. GEMM-DT, left), (b) the MR-inversion score by trametinib, as assessed for the SU2C sample MRs (OncoTreat: Patient vs. Drug, middle), and (c) the MR-inversion score by trametinib, as assessed for the cognate GEMM-DT (OncoTreat: GEMM-DT vs. Drug, right). D,E. Drug prioritization: FDA approved drugs (n = 117) (rows) were prioritized as candidate MR-inverters of either patients from the SU2C cohort (n = 212) (columns in Panel A) or GEMM-DTs (n = 91) (columns in Panel B), using drug perturbation data from the DU145 cells. Drugs were filtered based on screened concentration (≤ 1uM) and patient coverage, i.e., only those identified as a MR-inverters for >50% of the human samples are included. Relevant phenotypic variables for either patients or GEMM-DTs are shown in bars at the top each heatmap. The MR-inverter score (Log10P, as computed by aREA) is shown using a white (P > 10−5) to dark blue heatmap (see legend). The blue barplots on the right summarize the number of patients or GEMM-DT predicted as sensitive to each drug. Black arrows to their right point to candidate drugs selected for validation, while the grey arrows point to cabazitaxel, the standard-of-care for mCRPC. In panel B, the yellow barplot at the top shows the number of drugs identified as significant MR-inverters for each GEMM-DT and the rectangle indicates the allografts used for validation. See also Tables S5, S6, and Figures S7, S8, and S9.
Figure 6:
Figure 6:. Co-clinical validation of OncoLoop-predicted drugs using GEMM-derived models
A-G. Validation in an allograft tumor model. A. Selected drugs were validated in vivo, in allograft models derived from the cognate GEMM-DT CMZ315. Allografts were grown subcutaneously in nude mouse hosts and the mice were treated with predicted drugs, vehicle control, and a negative control (cabazitaxel) for the times indicated. Following sacrifice, the tumors were collected and analyzed as indicated. (Created with BioRender.com). B. Summary of tumor volume changes over the treatment period. C. Summary of tumor weights, following sacrifice. P-values for B and C were computed by one-way ANOVA at the last time point, compared to Vehicle treated tumors and adjusted for multiple hypothesis testing with Dunnett’s test (10 animals were enrolled to the vehicle control arm and 5 animals were enrolled on each of the drug treatment arms). D, E. Representative images of final tumor sizes in vehicle control and negative control-treated allografts (D) and allografts treated with predicted drugs (E). F. Pharmacodynamic assessment of MR-inversion by GSEA analysis for the four predicted drugs comparing drug-mediated of the drug- versus vehicle-treated tumors. G. Enrichment analysis of selected immune- and cancer-related pathways based on the differential of protein activity profiles between drug and vehicle control-treated GEMM-DT CMZ315 allografts at the end of study. H-J. Validation in a syngeneic metastasis model. H. Predicted drugs were validated in vivo for their effectiveness to inhibit metastasis using a syngeneic model. NPKEYFP cells were delivered by intracardiac injection into immunocompetent mice and drugs were administered individually and in combination with a PD-1 inhibitor. (Created with BioRender.com). I. Representative images of spine and liver metastasis visualized by ex vivo fluorescence of YFP-expressing tumor cells for each experimental group. J. Quantification plots showing metastasis area (for spine) or metastasis number (for liver) based on two independent experiments each with n=5 mice per group. P values were obtained by one-way ANOVA with Dunnett’s multiple comparisons against vehicle. See also Figures S10 and S11.
Figure 7:
Figure 7:. Co-clinical validation of OncoLoop-predicted drugs using a human PDX model
A, B. OncoLoop analysis of patient derived xenograft (PDX) models: A. Similar to Figure 5A, three heatmaps are shown, representing the fidelity and MR-inverter scores for 4 LuCaP PDX tumors (columns in left heatmaps), 5 GEMM-DTs, and 28 drugs. The rectangles show a representative PGD-Loop, comprising a PDX (MC005/LuCaP73), its cognate GEMM-DT (CMZ315), and two of the top-predicted drug candidates evaluated in the allograft models (panobinostat and trametinib). For visualization purposes, heatmaps were clustered as in Figure 5A. B. GSEA used to compute panobinostat’s and trametinib’s MR-inverter P-values for the MC005/LuCaP73 model. C-F. Validation in the PDX model. C. The MC005/LuCaP73 PDX was grown in nude mouse hosts and treated with predicted drugs or vehicle for the times indicated. (Created with BioRender.com). D. Summary of changes in tumor volume over the treatment period. E. Summary of tumor weights following sacrifice. P-values for C and D were computed by one-way ANOVA at the last time point, compared to vehicle control-treated models and adjusted for multiple hypothesis testing with Dunnett’s test. F. Representative images of final tumor sizes. G. Pharmacotype analysis: Identification of patient subsets predicted to be sensitive to the same drugs by cluster analysis. Four subtypes are identified, including patients with highest predicted sensitivity to temsirolimus, trametinib, and panobinostat, as well as patients for which none of the three drugs were statistically significant. For each patient, the score of the most statistically significant MR-inverter drug is shown using a white (non-significant) to dark-blue color map, see legend; the second most significant drug is shown using a white (non-significant) to dark-red color map, see legend. This heatmap provides the rationale for a possible umbrella or combination trial where each patient (column) could be randomized to the most statistically significant MR-inverter drug (rows) validated in the preclinical study, based on its MR-inversion score, or to the combination of the two most significant drugs. The barplots to the right show the total number of patients predicted to be sensitive to each drug, as either most significant (blue) or second best selection (red). See also Table S7.

Similar articles

Cited by

References

    1. Mattar M, McCarthy CR, Kulick AR, Qeriqi B, Guzman S, de Stanchina E. Establishing and Maintaining an Extensive Library of Patient-Derived Xenograft Models. Front Oncol 2018;8:19 doi 10.3389/fonc.2018.00019. - DOI - PMC - PubMed
    1. Tentler JJ, Tan AC, Weekes CD, Jimeno A, Leong S, Pitts TM, et al. Patient-derived tumour xenografts as models for oncology drug development. Nat Rev Clin Oncol 2012;9(6):338–50 doi 10.1038/nrclinonc.2012.61. - DOI - PMC - PubMed
    1. Bleijs M, van de Wetering M, Clevers H, Drost J. Xenograft and organoid model systems in cancer research. EMBO J 2019;38(15):e101654 doi 10.15252/embj.2019101654. - DOI - PMC - PubMed
    1. Schutgens F, Clevers H. Human Organoids: Tools for Understanding Biology and Treating Diseases. Annu Rev Pathol 2020;15:211–34 doi 10.1146/annurev-pathmechdis-012419-032611. - DOI - PubMed
    1. Kersten K, de Visser KE, van Miltenburg MH, Jonkers J. Genetically engineered mouse models in oncology research and cancer medicine. EMBO Mol Med 2017;9(2):137–53 doi 10.15252/emmm.201606857. - DOI - PMC - PubMed

Publication types