. 2023 Jan 2;220(1):e20211628.
doi: 10.1084/jem.20211628. Epub 2022 Nov 14.

Suppression of CCL2 angiocrine function by adrenomedullin promotes tumor growth

Affiliations

Suppression of CCL2 angiocrine function by adrenomedullin promotes tumor growth

Akiko Nakayama et al. J Exp Med. .

Abstract

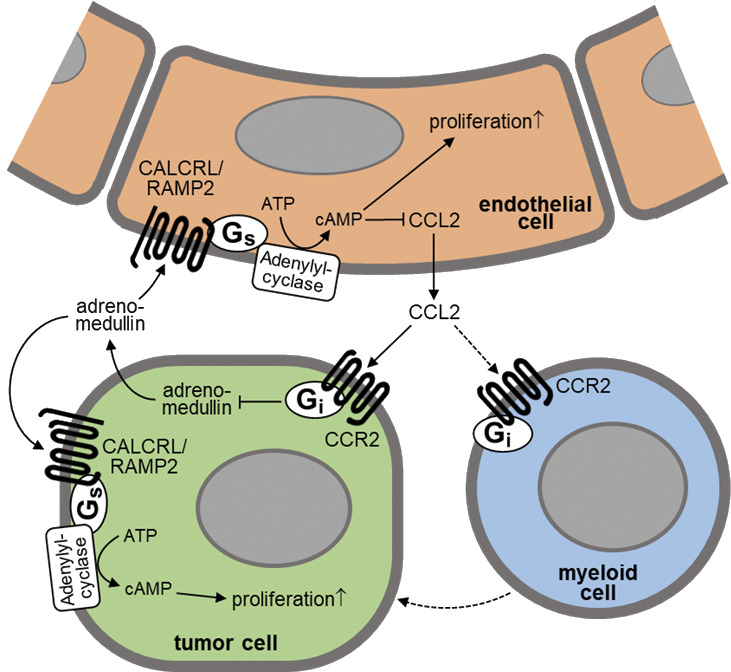
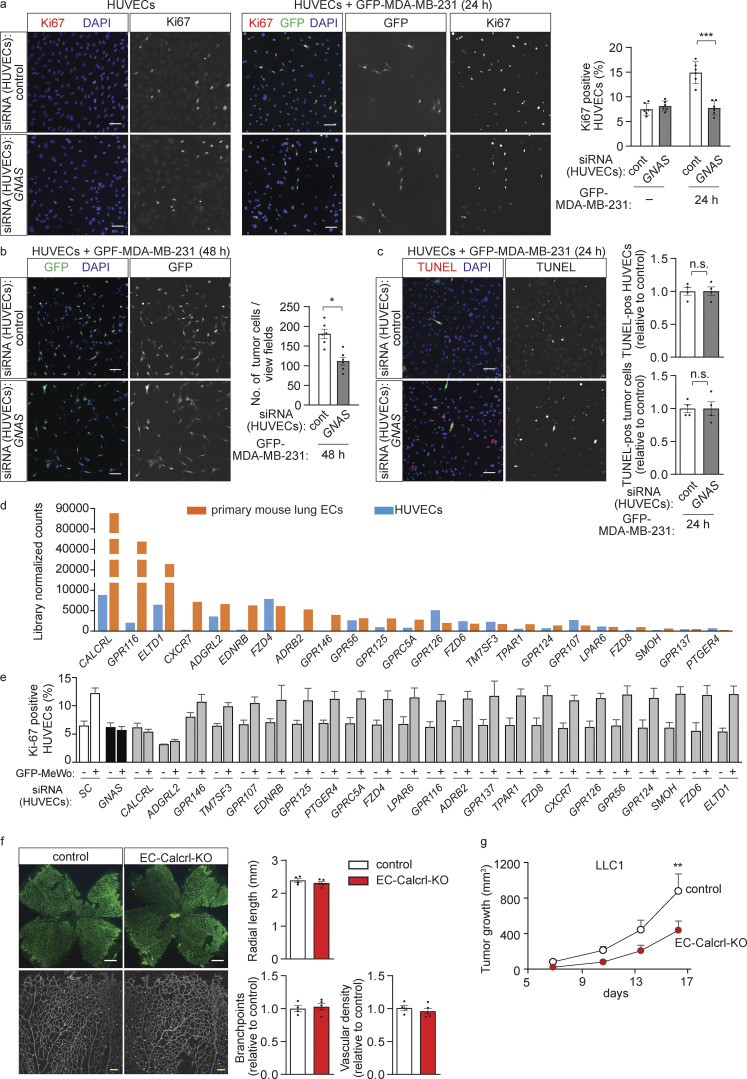
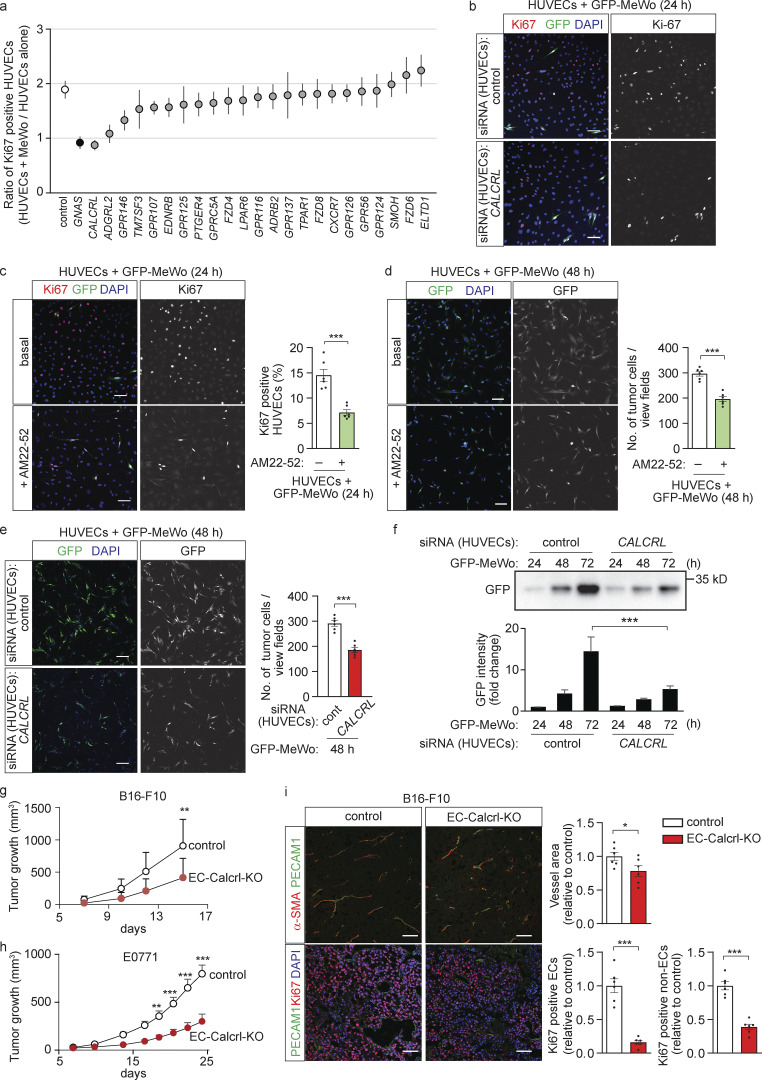
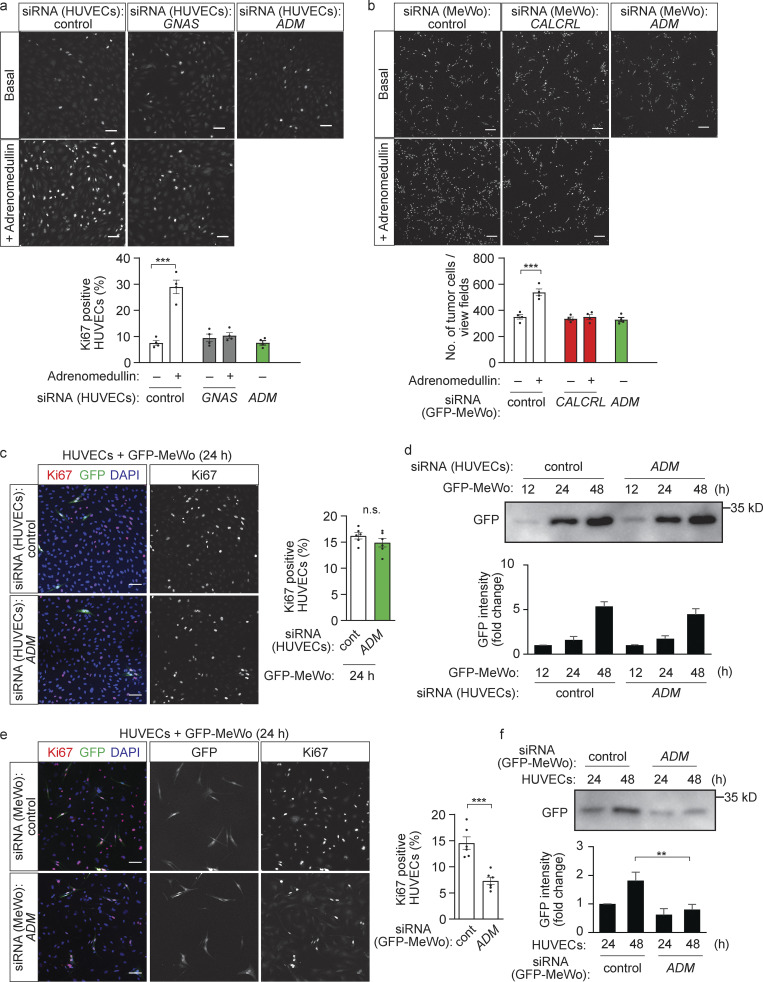
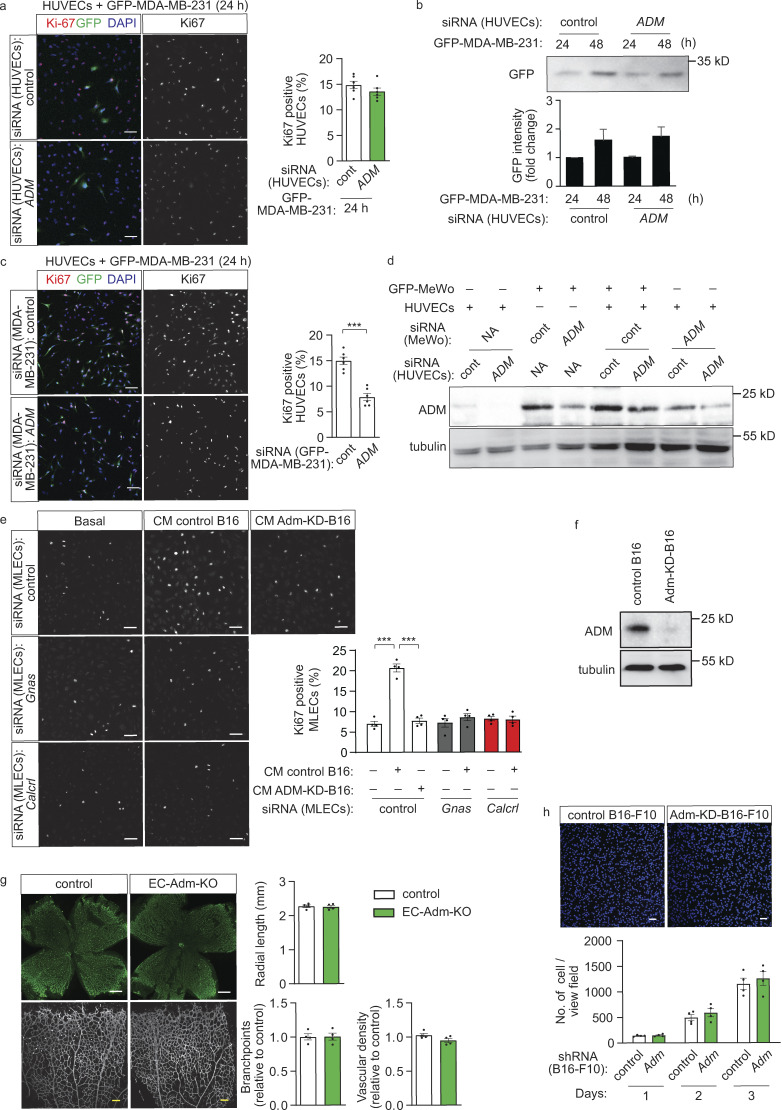
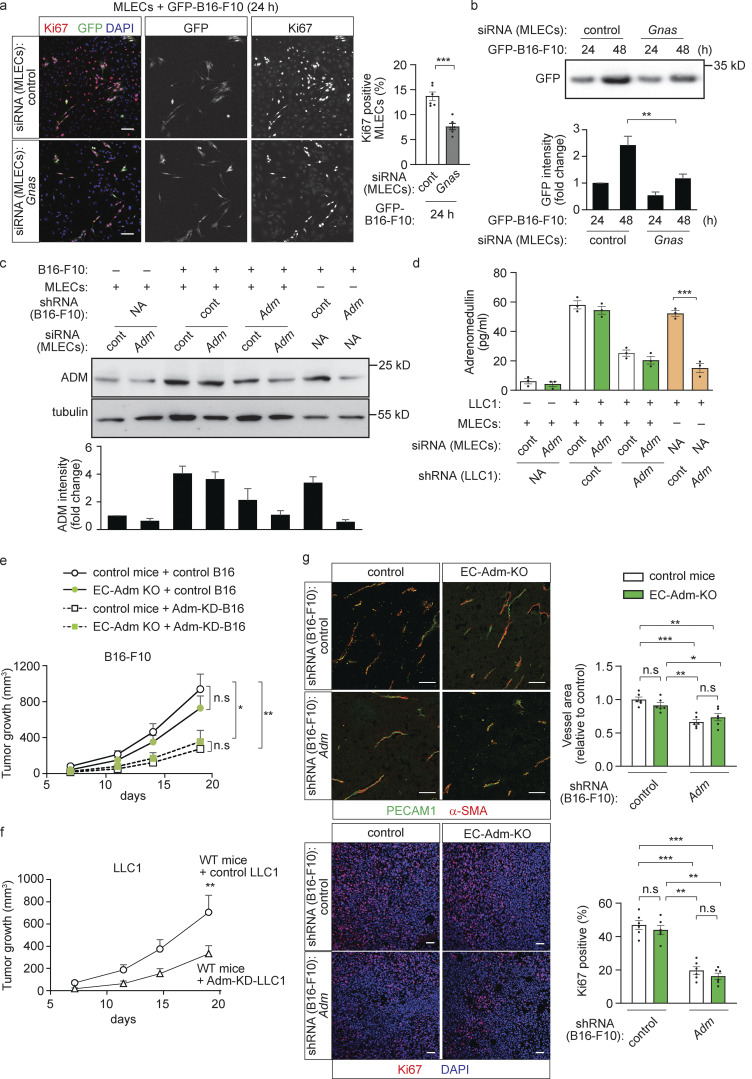
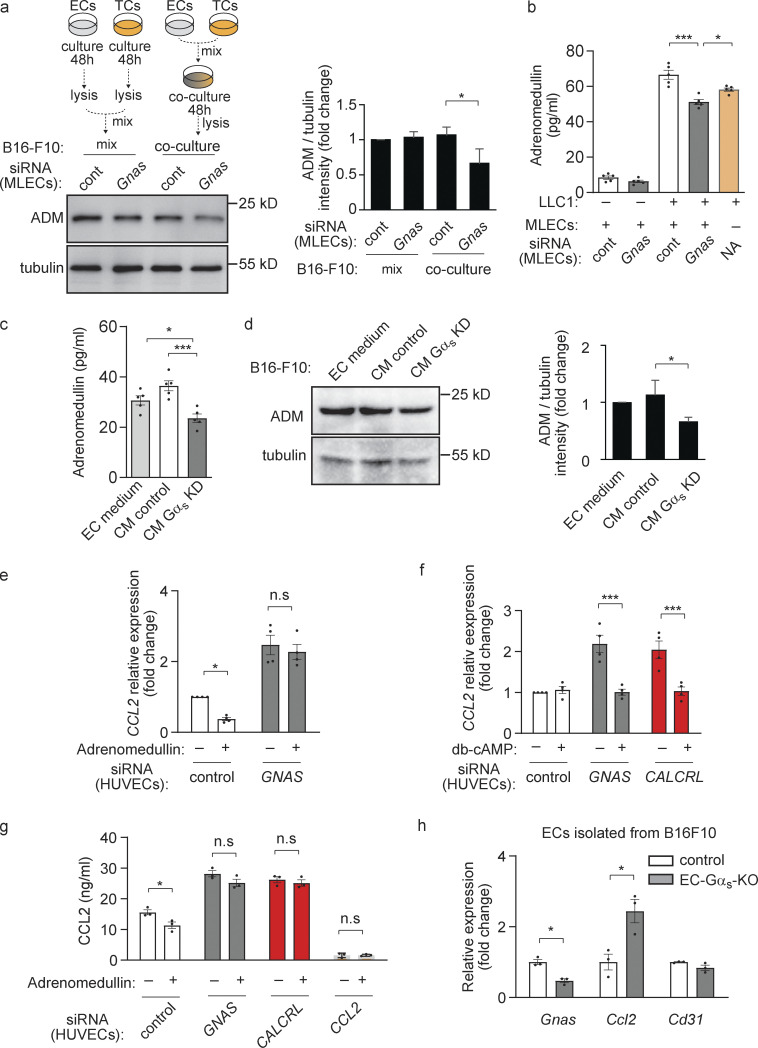
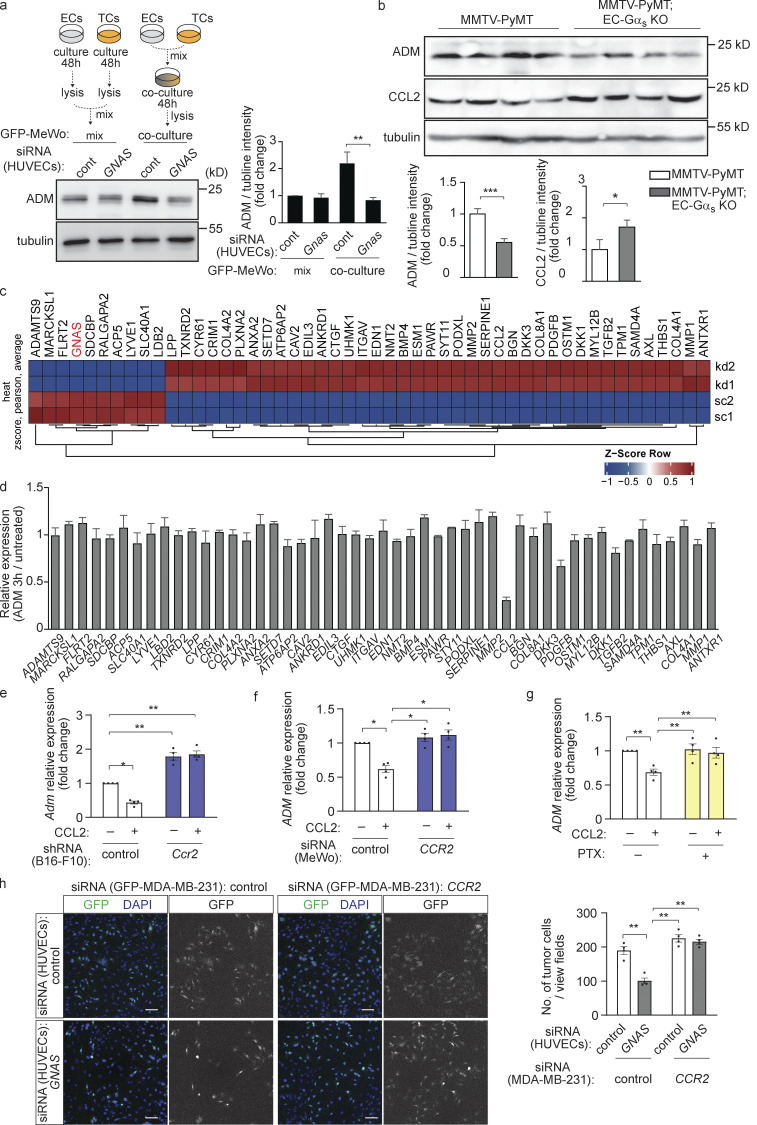
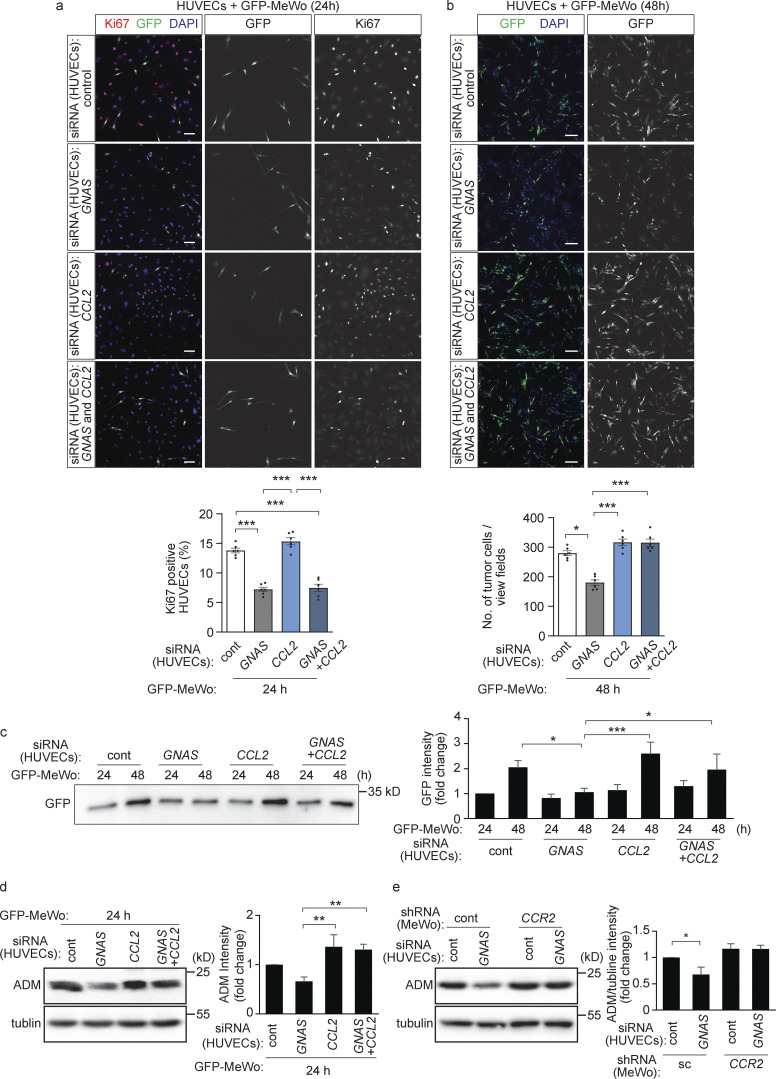
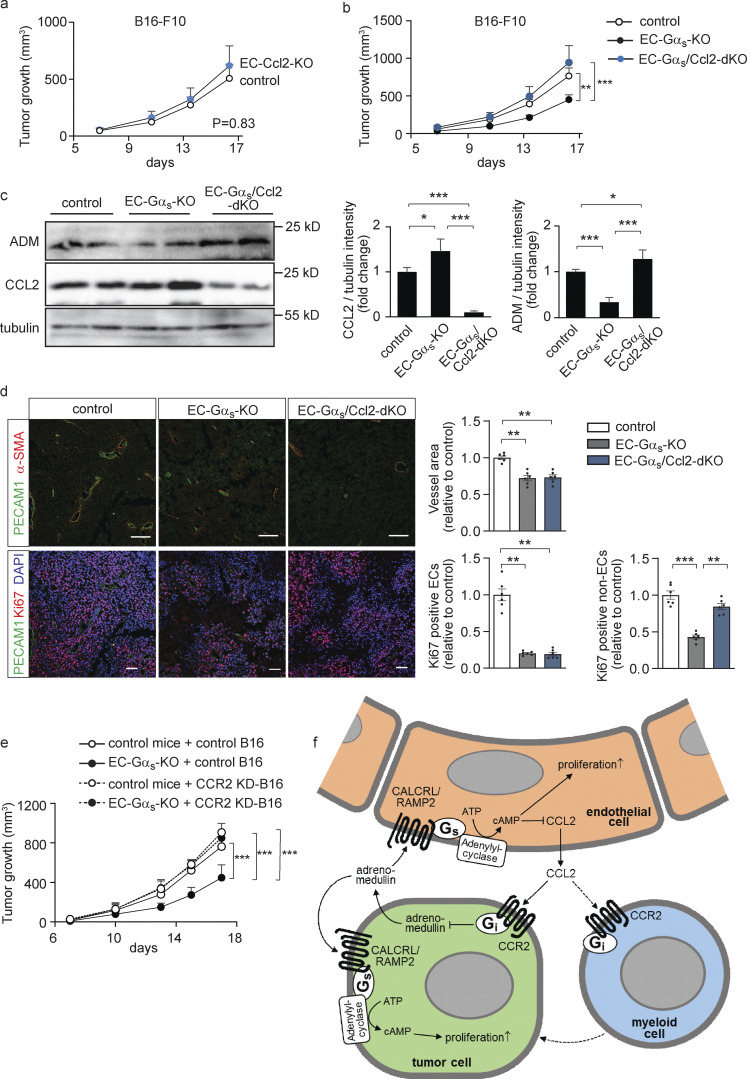
Within the tumor microenvironment, tumor cells and endothelial cells regulate each other. While tumor cells induce angiogenic responses in endothelial cells, endothelial cells release angiocrine factors, which act on tumor cells and other stromal cells. We report that tumor cell-derived adrenomedullin has a pro-angiogenic as well as a direct tumor-promoting effect, and that endothelium-derived CC chemokine ligand 2 (CCL2) suppresses adrenomedullin-induced tumor cell proliferation. Loss of the endothelial adrenomedullin receptor CALCRL or of the G-protein Gs reduced endothelial proliferation. Surprisingly, tumor cell proliferation was also reduced after endothelial deletion of CALCRL or Gs. We identified CCL2 as a critical angiocrine factor whose formation is inhibited by adrenomedullin. Furthermore, CCL2 inhibited adrenomedullin formation in tumor cells through its receptor CCR2. Consistently, loss of endothelial CCL2 or tumor cell CCR2 normalized the reduced tumor growth seen in mice lacking endothelial CALCRL or Gs. Our findings show tumor-promoting roles of adrenomedullin and identify CCL2 as an angiocrine factor controlling adrenomedullin formation by tumor cells.


Conflict of interest statement

Disclosures: The authors declare no competing interests exist.

Figures

None
Graphical abstract
Figure S1.
Figure S1.
Effects of endothelial loss of Gαs on retinal angiogenesis and tumor angiogenesis. (a) Whole mount retinae of control and EC-Gαs-KO mice at P7 stained with Isolectin B4. Quantification of vasculature parameters are presented as bar diagrams (n = 5 mice). (b) Immunohistochemistry of B16-F10 tumors dissected from control or EC-Gαs-KO mice. Sections were analyzed for a marker of apoptosis (cleaved caspase3; green) or of hypoxia (Hif1α; red) and were stained with DAPI (blue; n = 6 mice for each genotype). (c–e) Immunohistochemistry of LLC1 tumors dissected from control or EC-Gαs-KO mice. Sections were analyzed for markers of endothelial cells (PECAM1 or VE-Cad; green), lymphatic endothelial cell (Prox1; red), perivascular cells (α-SMA; red), proliferating cells (Ki67; red), hypoxia (Hif1 α; red), as well as M1 and M2 macrophages (CD68 and CD206), and were stained with DAPI (blue). The bar diagrams show the statistical evaluation (n = 6 mice for each genotype). (f) Flow cytometric analysis of immune cells in tumors. LLC1 tumors dissected from control or EC-Gαs-KO mice were dissociated, and populations of neutrophils, B cells, CD8+ T cells, CD4+ T cells, and macrophages were analyzed by determining the expression of Ly6G, CD8, CD4, and F4/80, respectively. F4/80 expressing macrophage were also evaluated for their expression of the M2 marker CD206 or of the CCL2 receptor CCR2 (n = 10 mice per group). Bar length: 500 μm, 100 μm (a); 50 μm (b–e). Data represent mean values ± SEM; *, P ≤ 0.05; **, P ≤ 0.01; ***, P ≤ 0.001 (two-tailed Student’s t test).
Figure 1.
Figure 1.
Loss of endothelial Gαs reduced primary tumor growth. (a–c) B16-F10 (a and b) or LLC1 (c) tumor cells were injected subcutaneously in control and EC-Gαs-KO mice, and tumor growth was determined (n = 9 mice; a and c). B16-F10 tumor sections were analyzed for markers of endothelial cells (PECAM1; green), perivascular cells (α-SMA; red) or for proliferating cells (Ki67; red), and were stained with DAPI (blue). The bar diagrams (b) show the statistical evaluation (n = 6 mice per group). (d and e) Control or EC-Gαs-KO mice crossed with MMTV-PyMT mice were monitored for occurrence of tumors as well as for the time point at which they had reached the endpoint of the experiment (d), and tumor sections were analyzed by immunohistochemistry (e) using antibodies recognizing endothelial cells (PECAM1; green), perivascular cells (α-SMA; red) and proliferating cells (Ki67; red), and were stained with DAPI (blue). The bar diagrams (e) show the statistical evaluation (n = 6 mice for each genotype). Bar length (b and e): 50 μm. Data represent mean values ± SEM; *, P ≤ 0.05; **, P ≤ 0.01; ***, P ≤ 0.001 (two-way ANOVA and Bonferroni’s post hoc test [a and c], two-tailed Student’s t test [b and e], and Gehan-Breslow-Wilcoxon test [d]).
Figure 2.
Figure 2.
Loss of endothelial Gαs reduced endothelial and tumor cell growth in vitro. (a–d) HUVECs were transfected with control siRNA or siRNA directed against GNAS, the gene encoding Gαs, and were cultured alone or together with GFP-expressing human MeWo melanoma cells (GFP-MeWo) for the indicated time periods. Proliferating cells were stained with anti-Ki67 antibody (a; red), or apoptotic cells were detected using the TUNEL assay (d; red). Cells were counterstained with DAPI (a, b, and d; blue). The number of Ki67-positive HUVECs (a), GFP-expressing tumor cells (b), or TUNEL-positive cells (d) was determined by immunofluorescence, or the expression level of GFP was determined by Western blot analysis as an indicator of tumor cell growth (c). The bar diagrams show the statistical evaluation (a and b, n = 3 independent experiments; d, n = 2 independent experiments) or represent the relative densitometric values based on Fiji software (c; n = 3 independent experiments). Bar length: 100 µm (a, b, and d). Data represent mean values ± SEM; **, P ≤ 0.01; ***, P ≤ 0.001 (two-way ANOVA and Bonferroni’s post hoc test [a and c] and two-tailed Student’s t test [b and d]).
Figure S2.
Figure S2.
Role of endothelial Gαs or CALCRL in vitro and in vivo. (a–c) HUVECs were transfected with control siRNA or siRNA directed against GNAS and were cultured alone (a, left) or with GFP-expressing human MDA-MB-231 breast cancer cells (GFP-MDA-MB-231) for 24 h (a [right] and c) or for 48 h (b). Endothelial cell proliferation was determined by staining for Ki67 (a; n = 3 independent experiments), the number of GFP-expressing tumor cells was determined by immunofluorescence (b; n = 3 independent experiments) or apoptotic cells were detected using the TUNEL assay (c; n = 2 independent experiments). Bar diagrams show the statistical evaluation. (d) RNA sequencing was performed to determine the expression of genes encoding Gs-coupled receptors or orphan receptors in HUVECs and MLEC. Shown is a histogram of the library normalized counts. (e) HUVECs were transfected with control siRNA or siRNA directed against GNAS or the indicated GPCR RNAs, and HUVEC proliferation was determined after 24 h of culture in the absence or presence of GFP-expressing MeWo tumor cells by staining for Ki67 (n = 3). (f) Whole mount retinae of control and EC-Calcrl-KO mice at P7 stained with Isolectin B4. The bar diagram shows the statistical valuation of the quantification of the indicated vasculature parameters (n = 4 for control and n = 5 for KO mice). (g) LLC1 tumor cells were injected subcutaneously into wild-type and EC-Calcrl-KO mice, and tumor growth was determined (n = 6 mice per group). Bar length: 100 µm (a–c); 500 μm, 100 μm (f). Data represent mean values ± SEM; *, P ≤ 0.05; **, P ≤ 0.01; ***, P ≤ 0.001; n.s., non-significant (two-way ANOVA and Bonferroni’s post hoc test [a and g] and two-tailed Student’s t test [b, c, and f]).
Figure 3.
Figure 3.
The Gs-coupled adrenomedullin receptor CALCRL is required for endothelial and tumor cell proliferation in vitro and in vivo. (a and b) HUVECs were transfected with control siRNA or siRNA directed against GNAS or the indicated GPCR RNAs, and HUVEC proliferation in the absence and presence of GFP-MeWo tumor cells was determined by staining for Ki67. Shown are the ranked average ratios of Ki67-positive HUVECs co-cultured with MeWo cells and Ki67-positive HUVECs grown alone (a) and representative immunofluorescence staining (b; n = 4 independently evaluated dates). (c–f) HUVECs transfected with control siRNA or siRNA directed against CALCRL (e and f) or pretreated without or with 1 µM of the adrenomedullin receptor antagonist AM22-52 (c and d) were cultured with GFP-MeWo for the indicated time periods. Thereafter, Ki67-positive HUVECs were determined by staining with anti-Ki67 antibody (red) with DAPI (blue; c, n = 3 independent experiments), the number of GFP-expressing tumor cells was determined by either immunofluorescence (d and e, n = 3 independent experiments), or the expression level of GFP was determined by Western blot analysis (f). The bar diagrams show the statistical evaluation or represent the relative densitometric values based on Fiji software (f; n = 3 independent experiments). (g) B16-F10 melanoma cells were injected subcutaneously in control or EC-Calcrl-KO mice, and tumor growth was determined (n = 7 mice for each genotype). (h) E0771 breast cancer cells were injected into mammary fat pad of control or EC-Calcrl-KO mice, and tumor growth was determined (n = 5 mice for each genotype). (i) Immunohistochemistry of B16-F10 tumors grown in control or EC-Calcrl-KO mice. Sections were analyzed for markers of endothelial cells (PECAM1; green), perivascular cells (α-SMA; red) or proliferating cells (Ki67; red), and were stained with DAPI (blue). Bar diagrams show the statistical evaluation (n = 6 mice for each genotype). Bar length: 100 μm (b–e and i). Data represent mean values ± SEM; **, P ≤ 0.01; ***, P ≤ 0.001 (two-way ANOVA and Bonferroni’s post hoc test [f–h], two-tailed Student’s t test [c–e and i]).
Figure 4.
Figure 4.
Tumor cell–derived adrenomedullin promotes endothelial and tumor cell proliferation in vitro. (a) HUVECs transfected with control siRNA or siRNA directed against GNAS or ADM were cultured without (basal) or with 10 nM adrenomedullin for 24 h and were then stained with an anti-Ki67 antibody. The bar diagram shows the statistical evaluation. (b) GFP-MeWo cells were transfected with control siRNA or siRNA directed against CALCRL or ADM and were cultured without (basal) or with 2 nM adrenomedullin for 24 h. Thereafter, the number of GFP-expressing tumor cells was determined. The bar diagram shows the statistical evaluation (a and b; n = 2 independent experiments, two evaluated areas per experiments). (c and d) HUVECs were transfected with control siRNA or siRNA directed against ADM and were cultured with GFP-MeWo for the indicated time periods. Endothelial proliferation was determined by staining with anti-Ki67 antibody (c), or the expression level of GFP was determined by Western blot analysis as an indicator of tumor cell growth (d). (e and f) HUVECs were cultured with GFP-MeWo transfected with control siRNA or siRNA directed against ADM for the indicated time periods. Endothelial proliferation was determined by staining with anti-Ki67 antibody (e), or the tumor cell proliferation was determined by quantifying expression level of GFP by Western blot analysis (f). The bar diagrams show the statistical evaluation (c and e; n = 3 independent experiments) or represent the relative densitometric values based on Fiji software (d and f; n = 3 independent experiments). Bar length: 100 μm (a–c and e). Data represent mean values ± SEM; *, P ≤ 0.05; **, P ≤ 0.01; ***, P ≤ 0.001 (one-way ANOVA and Tukey’s post hoc test [a and b], two-way ANOVA and Bonferroni’s post hoc test [d and f], and two-tailed Students t test [c and e]).
Figure S3.
Figure S3.
Role of adrenomedullin in proliferation of endothelial and tumor cells. (a and b) HUVECs transfected with control siRNA or siRNA directed against ADM were cultured with GFP-MDA 231 for the indicated time periods, then either stained with anti-Ki67 antibody (red) and with DAPI (blue; a) or lysed to analyze GFP expression as an indicator of tumor cell number (b; n = 3 independent experiments). (c) HUVECs were co-cultured for 24 h with GFP-expressing MDA-MB-231 cells transfected with control siRNA or siRNA directed against ADM. Endothelial proliferation was determined by analyzing immunofluorescence obtained with the anti-Ki67 antibody. Bar diagrams show the statistical evaluation (n = 3 independent experiments). (d) HUVECs transfected with control siRNA or siRNA directed against Adm were cultured alone or together with MeWo cells transfected with control siRNA or siRNA directed against adrenomedullin. Thereafter, adrenomedullin levels were determined by Western blot analysis. (e) MLECs were transfected with control siRNA or siRNA directed against Gnas or Calcrl, then cultured without (basal) or with conditioned medium (CM) of B16-F10 cells transfected with control shRNA (control B16) or shRNA directed against Adm (Adm-KD-B16). Endothelial proliferation was determined by staining with anti-Ki67 antibody (n = 2 independent experiments). (f) Expression of ADM in control B16-F10 melanoma cells and in Adm-KD-B16 was determined by Western blotting. (g) Whole mount retinae of control and EC-Adm-KO mice at P7 stained with Isolectin B4. The bar diagram shows the quantification of vasculature parameters (n = 4 for each genotype). (h) Control B16-F10 or Adm-KD-B16 cells were cultured for 72 h, and cells were counted. The bar diagram shows the statistical evaluation (n = 2 independent experiments). Bar length: 100 μm (a, c, e, and g); and in panel h: 50 μm. Data represent mean values ± SD; *, P ≤ 0.05; **, P ≤ 0.01; ***, P ≤ 0.001 (one-way ANOVA and Tukey’s post hoc test [e], two-way ANOVA and Bonferroni’s post hoc test [b and h] and two-tailed Student’s t test [a, c, and g]).
Figure 5.
Figure 5.
Predominant role of tumor cell–derived adrenomedullin in tumor growth in vitro and in vivo. (a and b) MLECs transfected with control siRNA or siRNA directed against Gnas were cultured with GFP-expressing B16-F10 cells (GFP-B16-F10) for the indicated time periods. Endothelial proliferation was determined by staining with an anti-Ki67 antibody (a), or the tumor cell growth was determined by measuring protein levels of GFP by Western blot analysis (b). The bar diagrams show the statistical evaluation (a; n = 3 independent experiments) or the relative densitometric values based on Fiji software (b; n = 3 independent experiments). (c and d) MLECs transfected with control siRNA or siRNA directed against Adm were cultured alone or together with B16-F10 cells (c) or LLC1 cells (d) transduced with scrambled control shRNA or shRNA directed against adrenomedullin. Thereafter adrenomedullin levels were determined by immunoblotting (c), or adrenomedullin concentrations in cell supernatant ware determined by ELISA (d). The bar diagrams in panel c show the relative densitometric values based on Fiji software (n = 3 independent experiments). (e) B16-F10 cells transduced with scrambled control shRNA (control B16) or shRNA directed against adrenomedullin (Adm-KD-B16) were injected subcutaneously in control or EC-Adm-KO mice, and tumor growth was determined (n = 6 mice for each condition). (f) LLC1 cells transduced with control shRNA (control LLC1) or shRNA directed against Adm (Adm KD LLC1) were injected subcutaneously in wild-type mice, and tumor growth was determined (n = 5 mice for each genotype). (g) Sections of tumors from control animals and EC-Adm-KO mice injected with control B16-F10 or Adm-KD-B16 cells were analyzed for markers of endothelial cells (PECAM1; green), perivascular cells (α-SMA; red) or for proliferating cells (Ki67; red), and were stained with DAPI (blue). The bar diagram shows the statistical analysis of the vessel area (f, n = 6 per mice group). Bar length: 100 μm (a), 50 μm (g). Data represent mean values ± SEM; *, P ≤ 0.05; **, P ≤ 0.01; ***, P ≤ 0.001 (two-way ANOVA and Bonferroni’s post hoc test [b and e–g], one-way ANOVA and Tukey’s post hoc test [c and d], and two-tailed Student’s t test [a]).
Figure 6.
Figure 6.
Endothelial CCL2 was inhibited through an adrenomedullin/Gαs/cAMP signaling pathway. (a) MLECs (ECs) transfected with control siRNA (cont) or with siRNA directed against Gnas were cultured with B16-F10 (TCs) for 48 h (co-culture, right) or were cultured alone for 48 h, lysed and then mixed with B16-F10 lysates (mix, left). The expression level of ADM in mixed lysates or lysates of co-cultures was analyzed by Western blotting. The bar diagram represents the relative densitometric values based on Fiji software (n = 3 independent experiments). (b) MLECs transfected with control siRNA (cont) or with siRNA directed against Gnas were cultured alone or together with LLC1 cells for 24 h, and ADM protein concentrations in cell supernatants was determined by ELISA (n = 5 independent experiments). (c and d) B16-F10 cells were cultured for 24 h with endothelial cell (EC) medium or with conditioned endothelial cell medium (CM) of MLECs transfected with control siRNA (CM control) or siRNA directed against Gnas (CM Gαs KD). ADM protein concentrations in cell supernatants were determined by ELISA (c; n = 5 independent experiments), or the expression level of ADM was determined by Western blot (d; n = 3 independent experiments). (e and f) HUVECs transfected with control siRNA or siRNA directed against GNAS or CALCRL were incubated without or with 10 nM of adrenomedullin for 3 h (e), or with 50 µM db-cAMP for 24 h (f). Thereafter, the CCL2 expression was determined by qRT-PCR analysis (n = 4 independent experiments). (g) HUVECs transfected with control siRNA or siRNA directed against GNAS or CALCRL or CCL2 were incubated without or with 10 nM adrenomedullin for 24 h, and the CCL2 concentration in cell supernatants was determined (n = 3 independent experiments). (h) Endothelial cells were isolated from B16-F10 tumors grown in control or EC-Gαs-KO mice by FACS, and expression of the indicated genes was determined by qRT-PCR (n = 3 mice for each genotype). Data represent mean values ± SEM; *, P ≤ 0.05; **, P ≤ 0.01; ***, P ≤ 0.001; n.s., non-significant (two-way ANOVA and Bonferroni’s post hoc test [a and e–g], one-way ANOVA and Tukey’s post hoc test [b–d], and two-tailed Student’s t test [h]).
Figure S4.
Figure S4.
Role of CCL2 in the interaction of tumor cells and endothelial cells. (a) HUVECs (ECs) transfected with control siRNA (cont) or siRNA directed against GNAS were cultured with GFP-MeWo (TCs) for 48 h (co-culture, right) or cultured alone, lysed, and then mixed with GFP-MeWo lysates (mix, left). The expression level of ADM and Gαs were analyzed by Western blotting. The bar diagram represents the relative densitometric values of the band recognized by the anti-ADM antibody based on Fiji software (n = 3 independent experiments). (b) Western blot analysis of mammary gland lysates dissected from MMTV-PyMT mice crossed with control or EC-Gαs-KO mice showing ADM and CCL2 protein levels as well as tubulin levels as loading control. (c) Heat map showing top 50 differentially expressed genes (based on false discovery rate) that significantly have increased (red) or decreased (blue) expression following GNAS silencing (kd) in HUVECs compared to scrambled (sc) siRNA control. (d) HUVECs were incubated without or with 10 nM adrenomedullin for 3 h, and the expression of the indicated genes was determined by qRT-PCR analysis (n = 3). (e and f) B16-F10 cells were stably transduced with control shRNA or shRNA directed against Ccr2 (e) or GFP-MeWo cells were transfected with control siRNA or siRNA directed against CCR2 (f), and were then incubated without or with 50 ng/ml CCL2 for 3 h. Thereafter, the adrenomedullin gene expression was determined by qRT-PCR analysis (n = 4 independent experiments). (g) GFP-MeWo cells were incubated without or with 100 ng/ml pertussis toxin (PTX) overnight then incubated with 50 ng/ml CCL2 for 3 h. Thereafter, ADM expression was determined by qRT-PCR analysis. (h) HUVECs were transfected with scrambled control siRNA or siRNA directed against GNAS and were then cultured for 48 h together with GFP-MDA-MB-231 cells transfected with control siRNA or siRNA directed against CCR2. Thereafter, the number of GFP-expressing tumor cells was determined by immunofluorescence. The bar diagram shows the statistical evaluation (n = 2 independent experiments). Bar length: 100 μm (h). Data represent mean values ± SEM; *, P ≤ 0.05; **, P ≤ 0.01; ***, P ≤ 0.001 (two-way ANOVA and Bonferroni’s post hoc test [a and e–h] and two-tailed Student’s t test [b]).
Figure 7.
Figure 7.
Endothelial CCL2 regulates adrenomedullin expression and release in tumor cells in vitro. (a–d) HUVECs were transfected with scrambled control siRNA or siRNA directed against GNAS and/or CCL2 and were cultured with GFP-MeWo for the indicated time periods. Endothelial cell proliferation was determined by staining for Ki67 (a), and the number of GFP-expressing tumor cells was determined by immunofluorescence (b) or determined as the protein level of GFP by Western blot analysis (c). In addition, expression of ADM was analyzed by immunoblotting (d). The bar diagrams show the statistical evaluation (a and b; n = 3 independent experiments) or the relative densitometric values based on Fiji software (c and d; n = 3 independent experiments). (e) HUVECs were transfected with control siRNA or siRNA directed against GNAS and cells were co-cultured for 24 h with MeWo cells transfected with control siRNA or siRNA directed against CCR2. Thereafter, the expression level of ADM was determined by Western blot analysis. The bar diagrams represent the relative densitometric values of the band recognized by the anti-ADM antibody based on Fiji software (n = 3 independent experiments). Bar length: 100 μm (a and b). Data represent mean values ± SEM; *, P ≤ 0.05; **, P ≤ 0.01; ***, P ≤ 0.001 (two-way ANOVA and Bonferroni’s post hoc test [c and e], and one-way ANOVA and Tukey’s post hoc test [a, b, and d]).
Figure 8.
Figure 8.
Endothelial CCL2 functions as a regulator of adrenomedullin expression by tumor cells in vivo. (a and b) 1.25 × 10⁵ (a; n = 5 mice per group) or 2.5 × 10⁵ (b; n = 6 mice per group) B16-F10 tumor cells were injected subcutaneously in control animals (a and b), EC-Ccl2-KO (a), EC-Gαs-KO (b), or EC-Gαs/Ccl2-dKO (b) mice, and tumor growth was determined. (c) Western blot analysis of mammary gland lysates dissected from control, EC-Gαs-KO or EC-Gαs/Ccl2-dKO mice showing protein levels of ADM and CCL2. Determination of tubulin protein levels served as a loading control. (d) Immunohistochemistry of B16-F10 tumors dissected from control, EC-Gαs-KO, or EC-Gαs/Ccl2-dKO mice. Sections were analyzed for markers of endothelial cells (PECAM1; green), perivascular cells (α-SMA; red) or proliferating cells (Ki67; red) and were stained with DAPI (blue). The bar diagrams show the statistical evaluation (n = 6). (e) B16-F10 cells transduced with scrambled control shRNA (control B16) or shRNA directed against CCR2 (CCR2-KD-B16) were injected subcutaneously in control or EC-Gαs-KO mice, and tumor growth was determined (n = 5 mice for each condition). (f) Schematic representation showing the angiocrine role of CCL2 in the regulation of adrenomedullin expression by tumor cells and the effects of tumor cell–derived adrenomedullin on the proliferation of tumor and endothelial cells as well as endothelial CCL2 expression. Dashed lines indicate potential additional mechanisms of tumor growth regulation through CCL2. Bar length: 50 μm (d). Shown are mean values ± SEM; *, P ≤ 0.05; **, P ≤ 0.01; ***, P ≤ 0.001 (two-way ANOVA and Bonferroni’s post hoc test [a, b, and e], and one-way ANOVA and Tukey’s post hoc test two-tailed Student’s t test [c and d]).

Similar articles

Cited by

References

    1. Abramoff, M.D., Magalhaes P.J., and Ram S.J.. 2004. Image processing with ImageJ. Biophot. Int. 11:36–42
    1. Asano, T., An T., Jia S.F., and Kleinerman E.S.. 1996. Altered monocyte chemotactic and activating factor gene expression in human glioblastoma cell lines increased their susceptibility to cytotoxicity. J. Leukoc. Biol. 59:916–924. 10.1002/jlb.59.6.916 - DOI - PubMed
    1. Balzan, S., Del Carratore R., Nicolini G., Beffy P., Lubrano V., Forini F., and Iervasi G.. 2012. Proangiogenic effect of TSH in human microvascular endothelial cells through its membrane receptor. J. Clin. Endocrinol. Metabol. 97:1763–1770. 10.1210/jc.2011-2146 - DOI - PubMed
    1. Bir, S.C., Xiong Y., Kevil C.G., and Luo J.. 2012. Emerging role of PKA/eNOS pathway in therapeutic angiogenesis for ischaemic tissue diseases. Cardiovasc. Res. 95:7–18. 10.1093/cvr/cvs143 - DOI - PMC - PubMed
    1. Borsig, L., Wolf M.J., Roblek M., Lorentzen A., and Heikenwalder M.. 2014. Inflammatory chemokines and metastasis--tracing the accessory. Oncogene. 33:3217–3224. 10.1038/onc.2013.272 - DOI - PubMed

Publication types