Grasping follows Weber's law: How to use response variability as a proxy for JND
- PMID: 36374493
- PMCID: PMC9669808
- DOI: 10.1167/jov.22.12.13
Grasping follows Weber's law: How to use response variability as a proxy for JND
Abstract
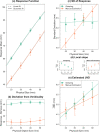
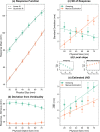
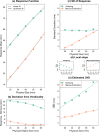
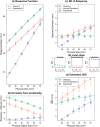
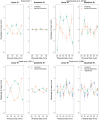
Weber's law is a fundamental psychophysical principle. It states that the just noticeable difference (JND) between stimuli increases with stimulus magnitude; consequently, larger stimuli should be estimated with larger variability. However, visually guided grasping seems to violate this expectation: When repeatedly grasping large objects, the variability is similar to that when grasping small objects. Based on this result, it was often concluded that grasping violated Weber's law. This astonishing finding generated a flurry of research, with contradictory results and potentially far-reaching implications for theorizing about the functional architecture of the brain. We show that previous studies ignored nonlinearities in the scaling of the grasping response. These nonlinearities result from, for example, the finger span being limited such that the opening of the fingers reaches a ceiling for large objects. We describe how to mathematically take these nonlinearities into account and apply this approach to our own data, as well as to the data of three influential studies on this topic. In all four datasets, we found that-when appropriately estimated-JNDs increase with object size, as expected by Weber's law. We conclude that grasping obeys Weber's law, as do essentially all sensory dimensions.
Figures





Similar articles
-
Obeying the law: speed-precision tradeoffs and the adherence to Weber's law in 2D grasping.Exp Brain Res. 2019 Aug;237(8):2011-2021. doi: 10.1007/s00221-019-05572-5. Epub 2019 Jun 3. Exp Brain Res. 2019. PMID: 31161415
-
Biomechanical constraints do not influence pantomime-grasping adherence to Weber's law: A reply to Utz et al. (2015).Vision Res. 2017 Jan;130:31-35. doi: 10.1016/j.visres.2016.09.018. Epub 2016 Nov 29. Vision Res. 2017. PMID: 27876512
-
Hand anthropometry and the limits of aperture separation determine the utility of Weber's law in grasping and manual estimation.Exp Brain Res. 2018 Aug;236(8):2439-2446. doi: 10.1007/s00221-018-5311-6. Epub 2018 Jun 19. Exp Brain Res. 2018. PMID: 29923096
-
Visually and memory-guided grasping: aperture shaping exhibits a time-dependent scaling to Weber's law.Vision Res. 2011 Sep 1;51(17):1941-8. doi: 10.1016/j.visres.2011.07.005. Epub 2011 Jul 14. Vision Res. 2011. PMID: 21777599
-
Weber's law in tactile grasping and manual estimation: feedback-dependent evidence for functionally distinct processing streams.Brain Cogn. 2014 Apr;86:32-41. doi: 10.1016/j.bandc.2014.01.014. Epub 2014 Feb 18. Brain Cogn. 2014. PMID: 24556320
Cited by
-
Sensory feedback modulates Weber's law of both perception and action.J Vis. 2024 Dec 2;24(13):10. doi: 10.1167/jov.24.13.10. J Vis. 2024. PMID: 39688841 Free PMC article.
-
Grasping tiny objects.Psychol Res. 2024 Jul;88(5):1678-1690. doi: 10.1007/s00426-024-01947-8. Epub 2024 Mar 30. Psychol Res. 2024. PMID: 38554146 Free PMC article.
-
Modal and amodal cognition: an overarching principle in various domains of psychology.Psychol Res. 2024 Mar;88(2):307-337. doi: 10.1007/s00426-023-01878-w. Epub 2023 Oct 17. Psychol Res. 2024. PMID: 37847268 Free PMC article. Review.
References
-
- Baird, J. C., & Noma, E. (1978). Fundamentals of scaling and psychophysics. New York: John Wiley & Sons.
-
- Brainard, D. H. (1997). The Psychophysics Toolbox. Spatial Vision, 10(4), 433–436. - PubMed
-
- Brown, R., Galanter, E., Hess, E. H., & Mandler, G. (1962). New directions in psychology . New York: Holt, Rinehart, & Winston.
Publication types
MeSH terms
LinkOut - more resources
Full Text Sources

