. 2023 Jan 17;29(2):432-445.
doi: 10.1158/1078-0432.CCR-22-2551.

Human Metastatic Cholangiocarcinoma Patient-Derived Xenografts and Tumoroids for Preclinical Drug Evaluation

Affiliations

Human Metastatic Cholangiocarcinoma Patient-Derived Xenografts and Tumoroids for Preclinical Drug Evaluation

Queralt Serra-Camprubí et al. Clin Cancer Res. .

Abstract

Purpose: Cholangiocarcinoma (CCA) is usually diagnosed at advanced stages, with limited therapeutic options. Preclinical models focused on unresectable metastatic CCA are necessary to develop rational treatments. Pathogenic mutations in IDH1/2, ARID1A/B, BAP1, and BRCA1/2 have been identified in 30%-50% of patients with CCA. Several types of tumor cells harboring these mutations exhibit homologous recombination deficiency (HRD) phenotype with enhanced sensitivity to PARP inhibitors (PARPi). However, PARPi treatment has not yet been tested for effectiveness in patient-derived models of advanced CCA.

Experimental design: We have established a collection of patient-derived xenografts from patients with unresectable metastatic CCA (CCA_PDX). The CCA_PDXs were characterized at both histopathologic and genomic levels. We optimized a protocol to generate CCA tumoroids from CCA_PDXs. We tested the effects of PARPis in both CCA tumoroids and CCA_PDXs. Finally, we used the RAD51 assay to evaluate the HRD status of CCA tissues.

Results: This collection of CCA_PDXs recapitulates the histopathologic and molecular features of their original tumors. PARPi treatments inhibited the growth of CCA tumoroids and CCA_PDXs with pathogenic mutations of BRCA2, but not those with mutations of IDH1, ARID1A, or BAP1. In line with these findings, only CCA_PDX and CCA patient biopsy samples with mutations of BRCA2 showed RAD51 scores compatible with HRD.

Conclusions: Our results suggest that patients with advanced CCA with pathogenic mutations of BRCA2, but not those with mutations of IDH1, ARID1A, or BAP1, are likely to benefit from PARPi therapy. This collection of CCA_PDXs provides new opportunities for evaluating drug response and prioritizing clinical trials.


Figures

Figure 1. Generation of CCA_PDX models. A, Schematic illustration of the process of establishing and maintaining CCA_PDXs. Successfully established CCA_PDXs are compared with their foundation biopsy counterparts in histologic and genomic analyses. B, Pie charts showing the stratification of all biopsies (n = 49) and successfully established CCA_PDXs (n = 19) based on the sex of the patient, tissue origin of biopsies, pathologic subtypes, and patient treatment received prior to biopsy.
Figure 1.
Generation of CCA_PDX models. A, Schematic illustration of the process of establishing and maintaining CCA_PDXs. Successfully established CCA_PDXs are compared with their foundation biopsy counterparts in histologic and genomic analyses. B, Pie charts showing the stratification of all biopsies (n = 49) and successfully established CCA_PDXs (n = 19) based on the sex of the patient, tissue origin of biopsies, pathologic subtypes, and patient treatment received prior to biopsy.
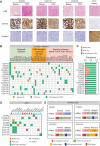
Figure 2. CCA_PDXs maintain the histologic and genomic features of the original biopsy specimens. A, Comparative histologic and IHC images of tumors of CCA_PDXs compared with each original biopsy specimen. Top row, H&E staining; middle row, IHC staining of KRT19 (CCA marker); and bottom row, IHC staining of HepPar1 (HCC). Representative examples of 19 CCA_PDXs are shown; an HCC biopsy sample was used as a control. CCA_PDX samples were collected at passage 1 (PDX133) or passage 2 (PDX78 and PDX119). Scale bar, 250 μm. B, Comparison of somatic mutations identified in CCA_PDXs tumors and their parental biopsy specimens. Genes harboring mutations were classified into three categories: epigenetic regulation, DNA damage response/cell-cycle control, and signaling pathways. CCA_PDX samples were collected at passage 1 (PDX41, PDX123, PDX96, PDX118, and PDX133) or passage 2 (PDX58, PDX62, PDX68.2, PDX78, PDX85, PDX67, PDX75, PDX75.2, PDX119, and PDX120). C, Frequencies of mutations identified as biopsy-specific, PDX-specific, or common somatic mutations. D, Comparison of CNVs identified in CCA_PDXs tumors and the original biopsy samples. E, Diagrams of FGFR2 gene fusions identified in four paired biopsy–PDX samples. Fusion mRNAs (including FGFR2) and their fusion partners are indicated, as well as the predicted protein products of the fusions with their functional domains. Numbers represent the exon of the corresponding genes.
Figure 2.
CCA_PDXs maintain the histologic and genomic features of the original biopsy specimens. A, Comparative histologic and IHC images of tumors of CCA_PDXs compared with each original biopsy specimen. Top row, H&E staining; middle row, IHC staining of KRT19 (CCA marker); and bottom row, IHC staining of HepPar1 (HCC). Representative examples of 19 CCA_PDXs are shown; an HCC biopsy sample was used as a control. CCA_PDX samples were collected at passage 1 (PDX133) or passage 2 (PDX78 and PDX119). Scale bar, 250 μm. B, Comparison of somatic mutations identified in CCA_PDX tumors and their parental biopsy specimens. Genes harboring mutations were classified into three categories: epigenetic regulation, DNA damage response/cell-cycle control, and signaling pathways. CCA_PDX samples were collected at passage 1 (PDX41, PDX123, PDX96, PDX118, and PDX133) or passage 2 (PDX58, PDX62, PDX68.2, PDX78, PDX85, PDX67, PDX75, PDX75.2, PDX119, and PDX120). C, Frequencies of mutations identified as biopsy-specific, PDX-specific, or common somatic mutations. D, Comparison of CNVs identified in CCA_PDX tumors and the original biopsy samples. E, Diagrams of FGFR2 gene fusions identified in four paired biopsy–PDX samples. Fusion mRNAs (including FGFR2) and their fusion partners are indicated, as well as the predicted protein products of the fusions with their functional domains. Numbers represent the exon of the corresponding genes.
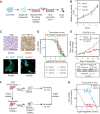
Figure 3. Ex vivo 3D culture of tumors derived from CCA_PDXs can be used to evaluate drug efficacy. A, Schematic illustration of the process of ex vivo 3D culture of tumoroids derived from CCA_PDX. B, Cell proliferation of CCA_PDX-derived tumoroids was determined using CellTiter-Glo assays. Data were normalized to cell viability measured on day 0 (D0) and are mean ± SD from three independent replicates. C, Histopathologic characterization of tumoroids generated using CCA_PDX-derived cells cultured ex vivo for 10 days. Top row: H&E staining (left); IHC for the CCA marker KRT19 (right); bottom row: CCA marker KRT19 (left) and the HCC marker HepPAR1 (right); representative images are shown. Scale bars, 250 μm (top row), 50 μm (bottom row). D, NEO2734 dose–response curves for a panel of CCA_PDX-derived tumoroids cultured ex vivo. Cell viability was determined using Cell Titer-Glo assay on day 7 (The initiation of treatment was considered as day 1.). Data are mean ± SD from independent biological replicates (PDX41, n = 5; PDX75.2, n = 2; PDX78, n = 6; PDX85, n = 6; PDX118, n = 3; PDX113, n = 3). E, Effects of NEO2734 evaluated in vivo using CCA_PDX78. Mice implanted with PDX78 were treated intraperitoneally three times per week for 4 weeks with either vehicle (n = 6) or NEO2734 (10 mg kg–1) (n = 6). Each tumor volume was normalized to its volume measured on day 1 of treatment. Data are mean ± SEM (multiple t tests); the P value was from data of day 29. F, Schematic illustration of the process of establishing two PDX models from a patient with CCA with FGFR2 fusion (prior to FGFR inhibitor treatment and in progression) and using tumoroids derived from the paired PDXs to test the efficacy of FGFR inhibitor. G, FGFR inhibitor pemigatinib dose–response curves for PDX75- and PDX75.2-derived tumoroids cultured ex vivo. Cell viability was determined using Cell Titer-Glo assay on day 7 (The initiation of treatment was considered as day 1.). Data are mean ± SD from independent biological replicates (PDX75, n = 3; PDX75.2, n = 3).
Figure 3.
Ex vivo 3D culture of tumors derived from CCA_PDXs can be used to evaluate drug efficacy. A, Schematic illustration of the process of ex vivo 3D culture of tumoroids derived from CCA_PDX. B, Cell proliferation of CCA_PDX-derived tumoroids was determined using CellTiter-Glo assays. Data were normalized to cell viability measured on day 0 (D0) and are mean ± SD from three independent replicates. C, Histopathologic characterization of tumoroids generated using CCA_PDX-derived cells cultured ex vivo for 10 days. Top row: H&E staining (left); IHC for the CCA marker KRT19 (right); bottom row: CCA marker KRT19 (left) and the HCC marker HepPAR1 (right); representative images are shown. Scale bars, 250 μm (top row), 50 μm (bottom row). D, NEO2734 dose–response curves for a panel of CCA_PDX-derived tumoroids cultured ex vivo. Cell viability was determined using Cell Titer-Glo assay on day 7. (The initiation of treatment was considered as day 1.) Data are mean ± SD from independent biological replicates (PDX41, n = 5; PDX75.2, n = 2; PDX78, n = 6; PDX85, n = 6; PDX118, n = 3; PDX113, n = 3). E, Effects of NEO2734 evaluated in vivo using CCA_PDX78. Mice implanted with PDX78 were treated intraperitoneally three times per week for 4 weeks with either vehicle (n = 6) or NEO2734 (10 mg kg–1) (n = 6). Each tumor volume was normalized to its volume measured on day 1 of treatment. Data are mean ± SEM (multiple t tests); the P value was from data of day 29. F, Schematic illustration of the process of establishing two PDX models from a patient with CCA with FGFR2 fusion (prior to FGFR inhibitor treatment and in progression) and using tumoroids derived from the paired PDXs to test the efficacy of FGFR inhibitor. G, FGFR inhibitor pemigatinib dose–response curves for PDX75- and PDX75.2-derived tumoroids cultured ex vivo. Cell viability was determined using Cell Titer-Glo assay on day 7. (The initiation of treatment was considered as day 1.) Data are mean ± SD from independent biological replicates (PDX75, n = 3; PDX75.2, n = 3).
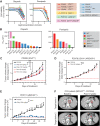
Figure 4. PARPi inhibits the growth of CCA_PDXs with a BRCA2 mutation. A, Dose–response curves of olaparib (left) or pamiparib (right) for a panel of tumoroids derived from CCA_PDXs. Cell viability was determined using a Cell Titer-Glo assay 7 days after the treatment initiation. Data are mean ± SD from independent biological replicates. For olaparib treatment: PDX41, n = 8; PDX68.2, n = 2; PDX78, n = 6; PDX85, n = 11; PDX75, n = 2; PDX75.2, n = 4; PDX96, n = 2; PDX118, n = 3; PDX120, n = 2; PDX133, n = 3; and PDX119, n = 3. For pamiparib treatment, PDX41, n = 6; PDX78, n = 6; PDX85, n = 9; PDX75.2, n = 2; PDX118, n = 3; PDX133, n = 3; PDX119, n = 3. B, IC50 of olaparib (left) and pamiparib (right) in tumoroids derived from CCA_PDXs. C, Effects of olaparib and pamiparib evaluated in vivo using PDX85 (IDH1mut). Mice implanted with PDX85 were treated orally six times per week with either vehicle (n = 8) or olaparib (at a low or high dose, of 50 or 100 mg kg–1, respectively; each n = 10) or pamiparib (at a low or high dose, of 6 or 12 mg kg–1, respectively; each n = 8). Each tumor volume was normalized to its volume on day 1 (D1). Data are mean ± SEM (two-way ANOVA multiple comparisons with Tukey correction); the indicated P value reflects data from D20. D, Effects of pamiparib evaluated in vivo using PDX 78 (IDH1mut). Mice implanted with PDX78 were treated orally with either vehicle (n = 5) or pamiparib (6 mg kg–1; n = 5) six times per week. Each tumor volume was normalized to its volume measured on day 1 of treatment (D1). Data are mean ± SEM (multiple t tests); the indicated P value was from day 27. E, Effects of olaparib evaluated in vivo using PDX119 (BRCA2mut). Mice implanted with PDX119 were treated orally with either vehicle (n = 5) or olaparib (100 mg kg–1; n = 5) six times per week. Each tumor volume was normalized to its volume measured on day 1 of treatment (D1). Data are mean ± SEM (multiple t tests); the indicated P value was from day 40. F, CT scan images of a 73-year-old male patient with metastatic CCA with a pathogenic BRCA2 mutation at baseline and after 10 weeks of olaparib treatment. Target lesion 1 (adjacent to the splenic vein) and target lesion 2 (mesenteric) were outlined in red lines.
Figure 4.
PARPi inhibits the growth of CCA_PDXs with a BRCA2 mutation. A, Dose–response curves of olaparib (left) or pamiparib (right) for a panel of tumoroids derived from CCA_PDXs. Cell viability was determined using a Cell Titer-Glo assay 7 days after the treatment initiation. Data are mean ± SD from independent biological replicates. For olaparib treatment: PDX41, n = 8; PDX68.2, n = 2; PDX78, n = 6; PDX85, n = 11; PDX75, n = 2; PDX75.2, n = 4; PDX96, n = 2; PDX118, n = 3; PDX120, n = 2; PDX133, n = 3; and PDX119, n = 3. For pamiparib treatment: PDX41, n = 6; PDX78, n = 6; PDX85, n = 9; PDX75.2, n = 2; PDX118, n = 3; PDX133, n = 3; PDX119, n = 3. B, IC50 of olaparib (left) and pamiparib (right) in tumoroids derived from CCA_PDXs. C, Effects of olaparib and pamiparib evaluated in vivo using PDX85 (IDH1mut). Mice implanted with PDX85 were treated orally six times per week with either vehicle (n = 8) or olaparib (at a low or high dose, of 50 or 100 mg kg–1, respectively; each n = 10) or pamiparib (at a low or high dose, of 6 or 12 mg kg–1, respectively; each n = 8). Each tumor volume was normalized to its volume on day 1 (D1). Data are mean ± SEM (two-way ANOVA multiple comparisons with Tukey correction); the indicated P value reflects data from D19. D, Effects of pamiparib evaluated in vivo using PDX78 (IDH1mut). Mice implanted with PDX78 were treated orally with either vehicle (n = 5) or pamiparib (6 mg kg–1; n = 5) six times per week. Each tumor volume was normalized to its volume measured on day 1 of treatment (D1). Data are mean ± SEM (multiple t tests); the indicated P value was from day 26. E, Effects of olaparib evaluated in vivo using PDX119 (BRCA2mut). Mice implanted with PDX119 were treated orally with either vehicle (n = 5) or olaparib (100 mg kg–1; n = 5) six times per week. Each tumor volume was normalized to its volume measured on day 1 of treatment (D1). Data are mean ± SEM (multiple t tests); the indicated P value was from day 40. F, CT scan images of a 73-year-old male patient with metastatic CCA with a pathogenic BRCA2 mutation at baseline and after 10 weeks of olaparib treatment. Target lesion 1 (adjacent to the splenic vein) and target lesion 2 (mesenteric) are outlined in red lines.
Figure 5. RAD51 assay in CCA_PDXs and patients with CCA. A, Schematic illustration of the RAD51 assay and criteria used to define the proficiency or deficiency of HR repair in FFPE samples. B, RAD51 scores (bars) and γH2AX scores (dots) evaluated in a panel of 18 CCA_PDXs. C, Schematic illustration of the RAD51 assay performed in an independent CCA cohort (biopsy samples from patients with advanced CCA refractory to chemotherapy). D, RAD51 scores (bars) and γH2AX scores (dots) evaluated in an independent CCA cohort. Pathogenic mutations of IDH1, IDH2, ARID1A, BAP1, and BRCA2 were indicated.
Figure 5.
RAD51 assay in CCA_PDXs and patients with CCA. A, Schematic illustration of the RAD51 assay and criteria used to define the proficiency or deficiency of HR repair in FFPE samples. B, RAD51 scores (bars) and γH2AX scores (dots) evaluated in a panel of 18 CCA_PDXs. C, Schematic illustration of the RAD51 assay performed in an independent CCA cohort (biopsy samples from patients with advanced CCA refractory to chemotherapy). D, RAD51 scores (bars) and γH2AX scores (dots) evaluated in an independent CCA cohort. Pathogenic mutations of IDH1, IDH2, ARID1A, BAP1, and BRCA2 are indicated.

Comment in

  • 1078-0432. doi: 10.1158/1078-0432.CCR-29-2-HI

References

    1. Banales JM, Marin JJG, Lamarca A, Rodrigues PM, Khan SA, Roberts LR, et al. . Cholangiocarcinoma 2020: the next horizon in mechanisms and management. Nat Rev Gastroenterol Hepatol 2020;17:557–88. - PMC - PubMed
    1. Banales JM, Cardinale V, Carpino G, Marzioni M, Andersen JB, Invernizzi P, et al. . Expert consensus document: Cholangiocarcinoma: current knowledge and future perspectives consensus statement from the European Network for the Study of Cholangiocarcinoma (ENS-CCA). Nat Rev Gastroenterol Hepatol 2016;13:261–80. - PubMed
    1. Howlader N, Noone AM, Krapcho M, Miller D, Brest A, Yu M, et al. . SEER Cancer Statistics Review, 1975–2018, NCI. Bethesda, MD, https://seer.cancer.gov/csr/1975_2018/, based on November 2020 SEER data submission, posted to the SEER web site; 2021.
    1. Bruna A, Rueda OM, Greenwood W, Batra AS, Callari M, Batra RN, et al. . A biobank of breast cancer explants with preserved intra-tumor heterogeneity to screen anticancer compounds. Cell 2016;167:260–74. - PMC - PubMed
    1. DeRose YS, Wang G, Lin YC, Bernard PS, Buys SS, Ebbert MT, et al. . Tumor grafts derived from women with breast cancer authentically reflect tumor pathology, growth, metastasis and disease outcomes. Nat Med 2011;17:1514–20. - PMC - PubMed

Publication types

MeSH terms

Substances