

What was the Epidemiology and Global Burden of Disease of Hip Fractures From 1990 to 2019? Results From and Additional Analysis of the Global Burden of Disease Study 2019
- PMID: 36374576
- PMCID: PMC10194687
- DOI: 10.1097/CORR.0000000000002465
What was the Epidemiology and Global Burden of Disease of Hip Fractures From 1990 to 2019? Results From and Additional Analysis of the Global Burden of Disease Study 2019
Abstract
Background: Hip fractures are associated with a high risk of death; among those who survive a hip fracture, many experience substantial decreases in quality of life. A comprehensive understanding of the epidemiology and burden of hip fractures by country, age, gender, and sociodemographic factors would provide valuable information for healthcare policymaking and clinical practice. The Global Burden of Disease (GBD) study 2019 was a global-level study estimating the burden of 369 diseases and injuries in 204 countries and territories. An exploration and additional analysis of the GBD 2019 would provide a clearer picture of the incidence and burden of hip fractures.
Questions/purposes: Using data from the GBD 2019, we asked, (1) What are the global, regional, and national incidences of hip fractures, and how did they change over a recent 30-year span? (2) What is the global, regional, and national burden of hip fractures in terms of years lived with disability, and how did it change over that same period? (3) What is the leading cause of hip fractures? (4) How did the incidence and years lived with disability of patients with hip fractures change with age, gender, and sociodemographic factors?
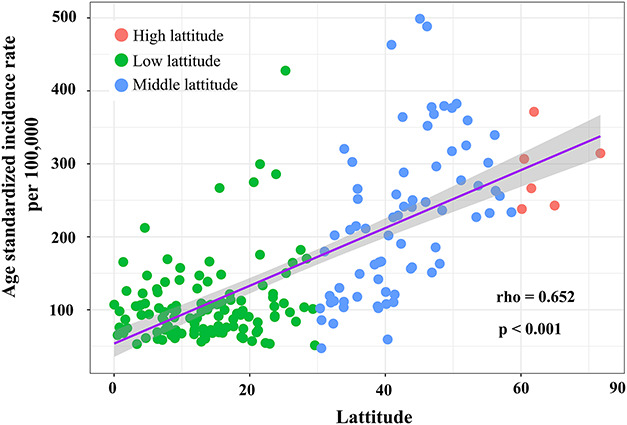
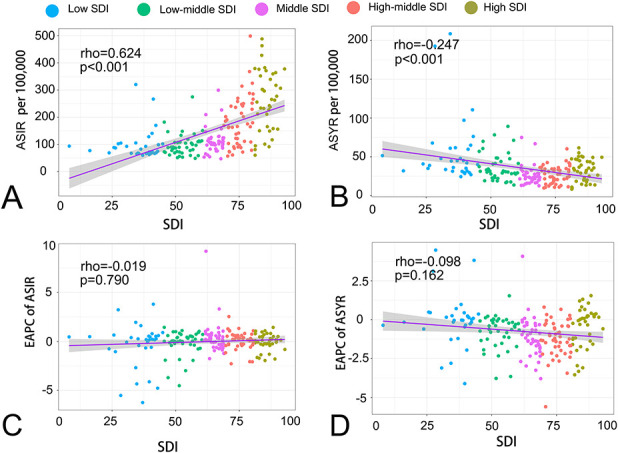
Methods: This was a cross-sectional study. Participant data were obtained from the GBD 2019 ( http://ghdx.healthdata.org/gbd-results-tool ). The GBD study is managed by the WHO, coordinated by the Institute of Health Metrics and Evaluation, and funded by the Bill and Melinda Gates Foundation. It estimates the burden of disease and injury for 204 countries by age, gender, and sociodemographic factors, and can serve as a valuable reference for health policymaking. All estimates and their 95% uncertainty interval (UI) were produced using DisMod-MR 2.1, a Bayesian meta-regression tool in the GBD 2019. In this study, we directly pulled the age-standardized incidence rate and years lived with disability rate of hip fractures by location, age, gender, and cause from the GBD 2019. Based on these data, we analyzed the association between the incidence rate and latitude of each country. Then, we calculated the estimated annual percentage change to represent trends from 1990 to 2019. We also used the Spearman rank-order correlation analysis to determine the correlation between the incidence or burden of hip fractures and the sociodemographic index, a composite index of the income per capita, average years of educational attainment, and fertility rates in a country.
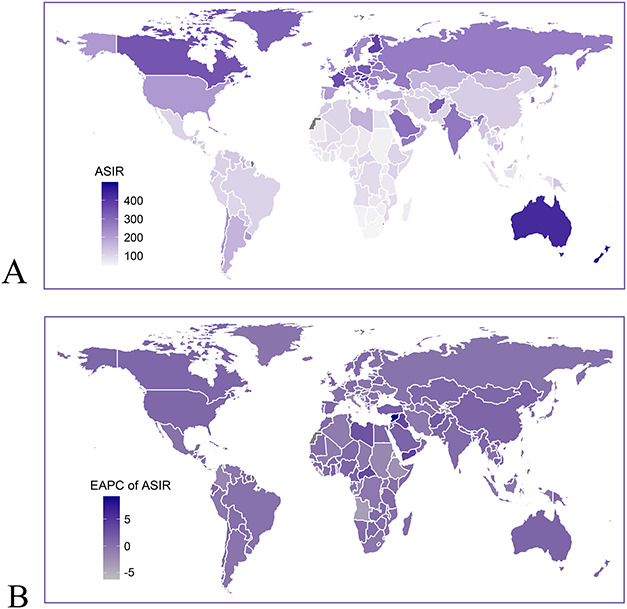
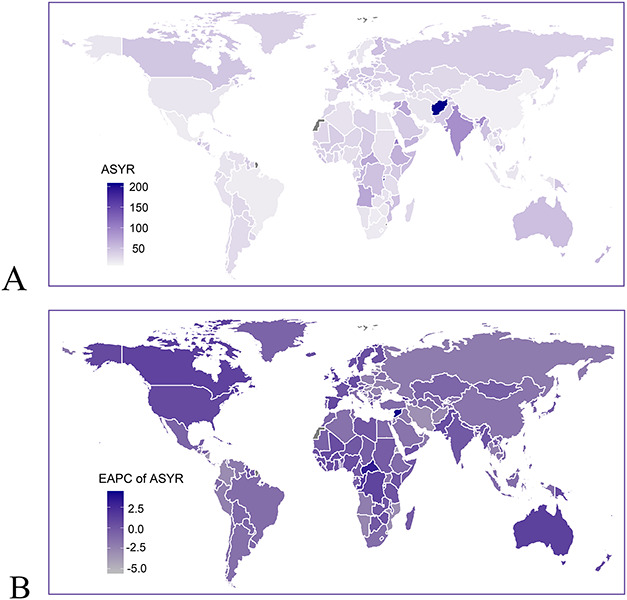
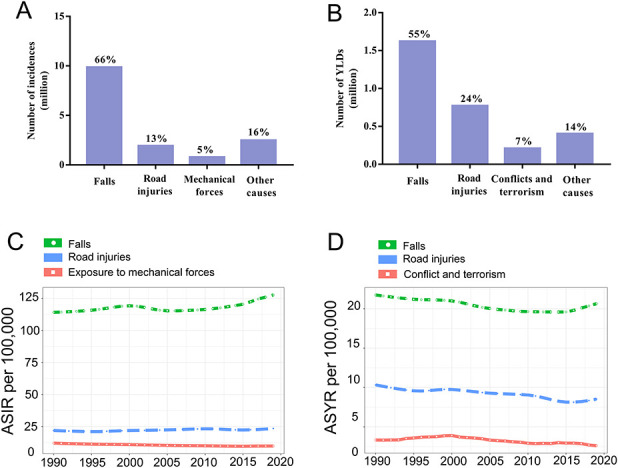
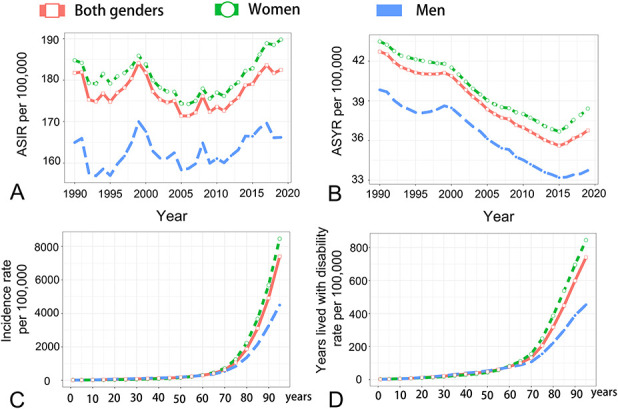
Results: Globally, hip fracture incidences were estimated to be 14.2 million (95% UI 11.1 to 18.1), and the associated years lived with disability were 2.9 million (95% UI 2.0 to 4.0) in 2019, with an incidence of 182 (95% UI 142 to 231) and 37 (95% UI 25 to 50) per 100,000, respectively. A strong, positive correlation was observed between the incidence rate and the latitude of each country (rho = 0.65; p < 0.001). From 1990 to 2019, the global incidence rate for both genders remained unchanged (estimated annual percentage change 0.01 [95% confidence interval -0.08 to 0.11]), but was slightly increased in men (estimated annual percentage change 0.11 [95% CI 0.01 to 0.2]). The years lived with disability rate decreased slightly (estimated annual percentage change 0.66 [95% CI -0.73 to -0.6]). These rates were standardized by age. Falls were the leading cause of hip fractures, accounting for 66% of all patients and 55% of the total years lived with disability. The incidence of hip fractures was tightly and positively correlated with the sociodemographic index (rho 0.624; p < 0.001), while the years lived with disability rate was slightly negatively correlated (rho -0.247; p < 0.001). Most hip fractures occurred in people older than 70 years, and women had higher incidence rate (189.7 [95% UI 144.2 to 247.2] versus 166.2 [95% UI 133.2 to 205.8] per 100,000) and years lived with disability (38.4 [95% UI 26.9 to 51.6] versus 33.7 [95% UI 23.1 to 45.5] per 100,000) than men.
Conclusion: Hip fractures are common, devastating to patients, and economically burdensome to healthcare systems globally, with falls being the leading cause. The age-standardized incidence rate has slightly increased in men. Many low-latitude countries have lower incidences, possibly because of prolonged sunlight exposure. Policies should be directed to promoting public health education about maintaining bone-protective lifestyles, enhancing the knowledge of osteoporosis management in young resident physicians and those in practice, increasing the awareness of osteoporosis screening and treatment in men, and developing more effective antiosteoporosis drugs for clinical use.
Level of evidence: Level III, prognostic study.
Copyright © 2022 by the Association of Bone and Joint Surgeons.
Conflict of interest statement
Each author certifies that there are no funding or commercial associations (consultancies, stock ownership, equity interest, patent/licensing arrangements, etc.) that might pose a conflict of interest in connection with the submitted article related to the author or any immediate family members. All ICMJE Conflict of Interest Forms for authors and Clinical Orthopaedics and Related Research® editors and board members are on file with the publication and can be viewed on request.
Figures
Comment in
-
CORR Insights®: What was the Epidemiology and Global Burden of Disease of Hip Fractures From 1990 to 2019? Results From and Additional Analysis of the Global Burden of Disease Study 2019.Clin Orthop Relat Res. 2023 Jun 1;481(6):1221-1223. doi: 10.1097/CORR.0000000000002511. Epub 2022 Dec 13. Clin Orthop Relat Res. 2023. PMID: 36512761 Free PMC article. No abstract available.
-
Letter to the Editor: What was the Epidemiology and Global Burden of Disease of Hip Fractures From 1990 to 2019? Results From and Additional Analysis of the Global Burden of Disease Study 2019.Clin Orthop Relat Res. 2023 Mar 1;481(3):625. doi: 10.1097/CORR.0000000000002547. Epub 2023 Jan 17. Clin Orthop Relat Res. 2023. PMID: 36727952 Free PMC article. No abstract available.
References
-
- Ahmadi-Abhari S, Moayyeri A, Abolhassani F. Burden of hip fracture in Iran. Calcif Tissue Int. 2007;80:147-153. - PubMed
-
- Ballane G, Cauley JA, Luckey MM, Fuleihan Gel H. Secular trends in hip fractures worldwide: opposing trends East versus West. J Bone Miner Res. 2014;29:1745-1755. - PubMed
-
- Burge R, Dawson-Hughes B, Solomon DH, Wong JB, King A, Tosteson A. Incidence and economic burden of osteoporosis-related fractures in the United States, 2005-2025. J Bone Miner Res. 2007;22:465-475. - PubMed
-
- Close JC. How can you prevent falls and subsequent fractures? Best Pract Res Clin Rheumatol. 2013;27:821-834. - PubMed
MeSH terms
LinkOut - more resources
Full Text Sources
Medical
Research Materials
