. 2022 Nov:85:104314.
doi: 10.1016/j.ebiom.2022.104314. Epub 2022 Oct 29.

Long-term progression of retinal degeneration in a preclinical model of CLN7 Batten disease as a baseline for testing clinical therapeutics

Affiliations

Long-term progression of retinal degeneration in a preclinical model of CLN7 Batten disease as a baseline for testing clinical therapeutics

Ashley A Rowe et al. EBioMedicine. 2022 Nov.

Abstract

Background: Batten disease is characterized by cognitive and motor impairment, retinal degeneration, and seizures leading to premature death. Recent studies have shown efficacy for a gene therapy approach for CLN7 Batten disease. This gene therapy approach is promising to treat cognitive and motor impairment, but is not likely to delay vision loss. Additionally, the natural progression of retinal degeneration in CLN7 Batten disease patients is not well-known.

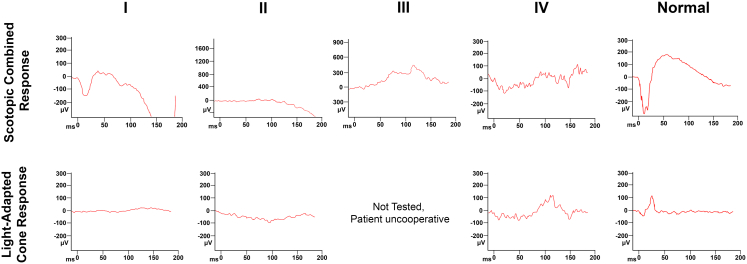
Methods: We performed visual examinations on five patients with CLN7 Batten disease and found that patients were far progressed in degeneration within their first five years of life. To better understand the disease progression, we characterized the retina of a preclinical mouse model of CLN7 Batten disease, through the age at which mice present with paralysis and premature death.

Findings: We found that this preclinical model shows signs of photoreceptor to bipolar synaptic defects early, and displays rod-cone dystrophy with late loss of bipolar cells. This vision loss could be followed not only via histology, but using clinical live imaging similar to that used in human patients.

Interpretation: Natural history studies of rare paediatric neurodegenerative conditions are complicated by the rapid degeneration and limited availability of patients. Characterization of degeneration in the preclinical model allows for future experiments to better understand the mechanisms underlying the retinal disease progression in order to find therapeutics to treat patients, as well as to evaluate these therapeutic options for future human clinical trials.

Funding: Van Sickle Family Foundation Inc., NIHP30EY030413, Morton Fichtenbaum Charitable Trust and 5T32GM131945-03.

Keywords: Bipolar cell degeneration; Electroretinography; Mfsd8; Neuronal ceroid lipofuscinoses; Optical coherence tomography; Photoreceptor synapse.


Conflict of interest statement

Declaration of interests Ms. Rowe has nothing to disclose. Dr. Chen has nothing to disclose. Ms. Nettesheim has nothing to disclose. Mr..ßIssioui has nothing to disclose. Dr. Dong has nothing to disclose. Ms. Hu has nothing to disclose. Dr. Messahel has nothing to disclose. Dr. Kayani has nothing to disclose. Dr. Gray has nothing to disclose. Dr. Wert has nothing to disclose.

Figures

Fig. 1
Fig. 1
Severe loss of visual function in human patients with CLN7 Batten disease. Average electroretinography (ERG) traces for patients I–IV (see Table 1) and a normal control patient for the dark-adapted, scotopic combined response (top row) and light-adapted, cone response (bottom row). Light intensities were 3.0 Hz.
Fig. 2
Fig. 2
Significant loss of the outer nuclear layer (ONL) and inner nuclear layer (INL) during progression of retinal degeneration in the Cln7 knockout (KO) mouse model. (a) Representative hematoxylin and eosin (H&E)-stained sections from a wild-type (left) and a Cln7 heterozygous (right) mouse eye at six months of age. Spider plot quantification of (b) ONL thickness and (c) INL thickness at six different regions of wild-type (black) and Cln7 heterozygous (teal) mice at six months of age. (d) Representative H&E-stained sections from Cln7 KO mice monthly through six months of age. Spider plot quantification of three month Cln7 heterozygous (teal) and Cln7 KO (orange) mice for (e) ONL thickness and (f) INL thickness. Spider plot quantification of six month Cln7 heterozygous (teal) and Cln7 KO (orange) mice for (g) ONL thickness and (h) INL thickness. N = five eyes per group and five sections per eye. GCL, ganglion cell layer; IS/OS, inner segment/outer segment; RPE, retinal pigmented epithelium; ONH, optic nerve head. Scale bar = 50 μm. Error bars = SD. Multiple comparisons test with Holm-Šidák's correction. ∗∗∗P = 0.00018 and P = 0.00017; ∗∗∗∗P < 0.0001.
Fig. 3
Fig. 3
Immunostaining displays glial activation and a reduction in the bipolar cells and photoreceptor synapses by five months of age in the Cln7 knockout (KO) mouse. Representative immunostained sections of retinas of two and five month wild-type and Cln7 KO mice. Staining was performed for GS (glutamine synthetase), GFAP (glial fibrillary acidic protein), IBA1 (ionized calcium-binding adaptor molecule 1), RBPMS (RNA binding protein with multiple splicing), PKCα (protein kinase c alpha), PSD95 (post synaptic density protein 95), and VGLUT1 (vesicular glutamine transporter 1) in either red or green fluorescence. DAPI staining shown in blue. N = three mice per group, at least three retinal sections per eye. Scale bar = 25 μm. GCL, ganglion cell layer; INL, inner nuclear layer; ONL, outer nuclear layer.
Fig. 4
Fig. 4
Five month old Cln7 knockout (KO) mice show increased microglial activation and reduced bipolar cells and photoreceptor synapses. Retinal lysates were collected from eyes of two and five month old wild-type and Cln7 KO mice. (a) Representative Western blot membrane for RBPMS (RNA binding protein with multiple splicing), PKCα (protein kinase c alpha), PSD95 (post synaptic density protein 95), PROX1 (prospero homeobox 1), VGLUT1 (vesicular glutamine transporter 1), IBA1 (ionized calcium-binding adaptor molecule 1), B Opsin (blue cone opsin), and R/G Opsin (red/green cone opsin) along with respective GAPDH loading controls. (b) Densitometry of the Western blot results. N = three mice per group, two or more technical replicates per mouse per antibody. Error bars = SEM. One-way ANOVA with Tukey's multiple comparisons test. PKCA (∗P = 0.013; ∗∗P = 0.0038); PSD95 (∗∗∗∗P < 0.0001); IBA1 (∗∗P = 0.0032 for comparison to two month wild-type and 0.0028 for comparison to five month wild-type; ∗∗∗∗P < 0.0001); VGLUT1 (∗P = 0.028); B Opsin (∗∗∗P = 0.0004); R/G Opsin (∗P = 0.039 for comparison to two month wild-type, 0.038 for five month wild-type compared to two month KO, and 0.049 for comparison of five month wild-type and five month KO).
Fig. 5
Fig. 5
Long-term live imaging indicates progressive photoreceptor cell degeneration in the Cln7 KO mice. Representative images for wild-type, Cln7 heterozygous and Cln7 KO mice (left, middle, and right, respectively) at three and five months of age for (a) infrared (IR) scanning laser ophthalmoscope (SLO) and (b) blue autofluorescence SLO. (c) Representative OCT images for wild-type, Cln7 heterozygous and Cln7 KO mice (left, middle, and right, respectively) at three and five months of age. Spider plot quantification of the retinal thickness, measured at six regions of the OCT image for wild-type, Cln7 heterozygous and Cln7 KO mice (black, teal, and orange, respectively) at three (d) and five (e) months of age. RNFL, retinal nerve fiber layer; INL, inner nuclear layer; ONL, outer nuclear layer; RPE, retinal pigmented epithelium; ONH, optic nerve head. N ≥ five mice per group. Scale bar = 200 μm. Error bars = SD. Two-way ANOVA with Tukey's multiple comparisons test. Three months (∗P = 0.041; ∗∗P = 0.0013 and 0.0031; ∗∗∗∗P < 0.0001) and five months (∗P = 0.014; ∗∗P = 0.0022; ∗∗∗∗P < 0.0001).
Fig. 6
Fig. 6
The CLN7 preclinical model shows a progressive loss of visual function prior to one month of age. Representative low-light (0.01 cd.s/m2 flash intensity) scotopic electroretinography (ERG) traces for wild-type (black) and Cln7 knockout (KO; orange) mice at (a) post-natal day (P)21 and (b) P28. (c) ERG b-wave maximal amplitudes at P21 and P28 for the low-light scotopic ERG. Representative bright-light (1.0 cd.s/m2 flash intensity) scotopic ERG traces for wild-type (black) and Cln7 knockout (KO; orange) mice at (d) P21 and (e) P28. (f) ERG a-wave maximal amplitudes and (g) b-wave maximal amplitudes at P21 and P28 for the bright-light scotopic ERG. Y-axis is in μV. N ≥ eight eyes per group. Error bars = SEM. Two-way ANOVA with Šidák's multiple comparisons test. ∗∗P = 0.0027; ∗∗∗∗P < 0.0001.
Fig. 7
Fig. 7
The CLN7 preclinical model shows a progressive loss of visual function over time. Representative scotopic electroretinography (ERG) traces for wild-type (black), Cln7 heterozygous (teal) and Cln7 knockout (KO; orange) mice at (a) two, (b) four, and (c) 6 months of age. Y-axis is in μV. (d–f) ERG a-wave, (g–i) b-wave, and (j–l) oscillatory potential (OP) responses in wild-type, Cln7 heterozygous and Cln7 KO mice at (d, g, j) two, (e, h, k) four, and (f, i, l) six months of age. A-wave and b-wave ERGs were analysed with one-way ANOVA with Tukey's multiple comparisons test; OPs were analysed with two-way ANOVA with Tukey's multiple comparisons test. A-wave (∗∗∗∗P < 0.0001); b-wave (∗∗P = 0.0012 compared to wild-type and P = 0.0033 compared to heterozygous mice); Two month OPs (∗P = 0.0495 and 0.034 for P5); Four month OPs (∗P = 0.033 for P3 and P = 0.011 for P5; ∗∗P = 0.0098; ∗∗∗P = 0.0002); Six month OPs (∗P = 0.044; ∗∗∗∗P < 0.0001). ERGs for the Cln7 KO mice over time for the (m) a-wave and (n) b-wave. A-wave (∗∗P = 0.0042; ∗∗∗P = 0.0003); B-wave (∗P = 0.014; ∗∗∗∗P < 0.0001). All ERG measurements were recorded at a 2.5 log cd.s/m2 flash intensity setting and measured in μV. N≥ eight eyes per group. Error bars = SEM.
Fig. 8
Fig. 8
The CLN7 preclinical model shows a progressive loss of rod photoreceptor function over time. Representative scotopic electroretinography (ERG) traces for wild-type (black), Cln7 heterozygous (teal) and Cln7 knockout (KO; orange) mice at (a) two, (b) four, and (c) 6 months of age. Y-axis is in μV. ERG b-wave responses in wild-type, Cln7 heterozygous and Cln7 KO mice at (d) two, (e) four, and (f) six months of age. One-way ANOVA with Tukey's multiple comparisons test. Two month (∗P = 0.022); Four month (∗P = 0.029; ∗∗P = 0.002); Six month (∗∗∗∗P < 0.0001). (g) ERGs for the Cln7 KO mice over time for the b-wave amplitude. ∗∗P = 0.0084; ∗∗∗∗P < 0.0001. All ERG measurements were recorded at a −1.1 log cd.s/m2 flash intensity setting and measured in μV. N ≥ eight eyes per group. Error bars = SEM.
Fig. 9
Fig. 9
The CLN7 preclinical model shows a loss of cone photoreceptor function before one month of age. Representative photopic electroretinography (ERG) traces for wild-type (black) and Cln7 knockout (KO; orange) mice at post-natal day (P)21, P28 and five months of age. (a) 10.0 Hz light intensity setting and (b) 30.0 Hz flicker response. Photopic ERG amplitudes were compared between wild-type and Cln7 KO mice for (c) 10.0 Hz photopic at P21 and P28, (d) 3.0 Hz photopic and 10.0 Hz photopic at five months, (e) 30.0 Hz flicker at P21 and P28, and (f) 10.0 Hz and 30.0 Hz flicker at five months. ERG recordings were measured in μV. N ≥ eight eyes per group. Error bars = SEM. P21 and P28 data were analysed with two-way ANOVA with Tukey's multiple comparisons test. Five month data were analysed with unpaired student's t-test. Flash photopic ERG (∗∗∗P = 0.0006 at P21 and P = 0.0002 at P28; ∗∗∗∗P < 0.0001); Flicker ERG (∗P = 0.028; ∗∗P = 0.0051; ∗∗∗P = 0.0004). (g) Immunostaining of two and five month wild-type and Cln7 KO mouse retinas for Blue Opsin (top panels) and Red/Green (R/G) Opsin (bottom panels). DAPI staining in blue. Scale Bar = 25 μm. N = three mice per group and at least three retinal sections per eye. ONL, outer nuclear layer; IS/OS, inner segment/outer segment.
Fig. 10
Fig. 10
The CLN7 knockout (KO) mice exhibit reduced sensitivity toward intraperitoneally (IP) delivered anaesthetics. The body weight in grams of wild-type (black), Cln7 heterozygous (teal), and Cln7 KO (orange) mice was recorded prior to anesthetized events at (a) two months and (b) six months of age, separated by gender. (c) Anaesthesia administered via IP injection was recorded in mg/kg body weight at two and six months of age. N = five mice per group. Error bars = SEM. Two-way ANOVA with Tukey's multiple comparisons test. ∗∗P = 0.0049 compared to wild-type and P = 0.0086 compared to heterozygous mice; ∗∗∗∗P < 0.0001.
Figure S1
Figure S1
Figure S2
Figure S2
Figure S3
Figure S3
Figure S4
Figure S4
Figure S5
Figure S5
Figure S6
Figure S6

References

    1. Nita D.A., Mole S.E., Minassian B.A. Neuronal ceroid lipofuscinoses. Epileptic Disord. 2016;18(S2):73–88. - PubMed
    1. Chang C.H. Neuronal ceroid lipofuscinoses. 2017. https://emedicine.medscape.com/article/1178391-overview
    1. Mink J.W., Augustine E.F., Adams H.R., Marshall F.J., Kwon J.M. Classification and natural history of the neuronal ceroid lipofuscinoses. J Child Neurol. 2013;28(9):1101–1105. - PMC - PubMed
    1. Wisniewski K.E., Kida E., Golabek A.A., Kaczmarski W., Connell F., Zhong N. Neuronal ceroid lipofuscinoses: classification and diagnosis. Adv Genet. 2001;45:1–34. - PubMed
    1. Wisniewski K.E., Zhong N., Philippart M. Pheno/genotypic correlations of neuronal ceroid lipofuscinoses. Neurology. 2001;57(4):576–581. - PubMed