. 2022 Nov:85:104308.
doi: 10.1016/j.ebiom.2022.104308. Epub 2022 Oct 27.

SHERLOCK4HAT: A CRISPR-based tool kit for diagnosis of Human African Trypanosomiasis

Affiliations

SHERLOCK4HAT: A CRISPR-based tool kit for diagnosis of Human African Trypanosomiasis

Núria Sima et al. EBioMedicine. 2022 Nov.

Abstract

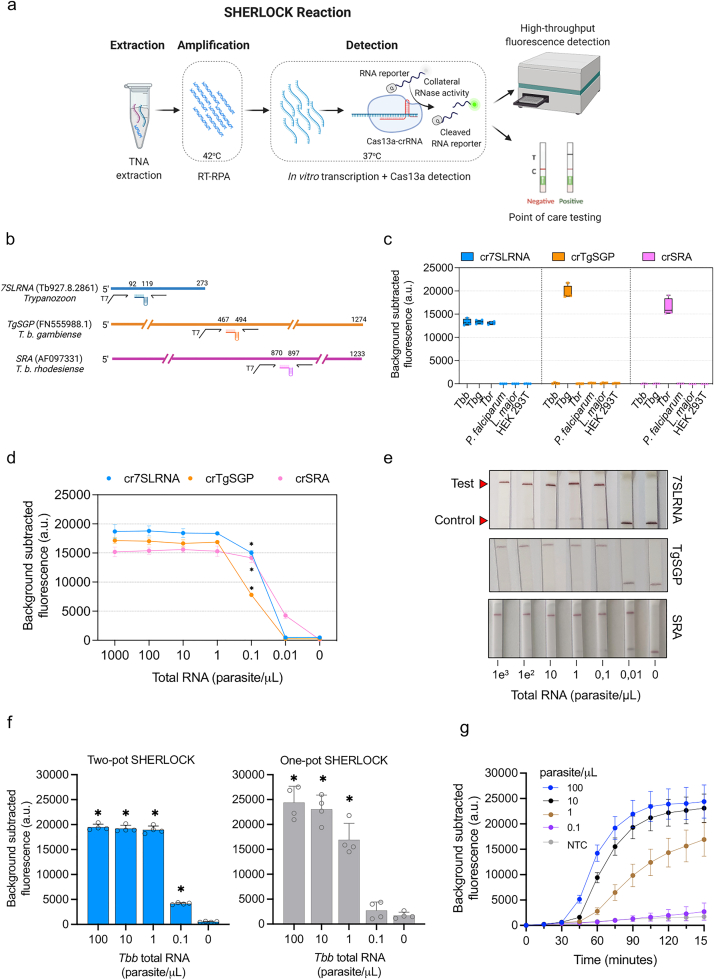
Background: To achieve elimination of Human African Trypanosomiasis (HAT) caused by Trypanosoma brucei gambiense (gHAT), the development of highly sensitive diagnostics is needed. We have developed a CRISPR based diagnostic for HAT using SHERLOCK (Specific High-sensitivity Enzymatic Reporter unLOCKing) that is readily adaptable to a field-based setting.

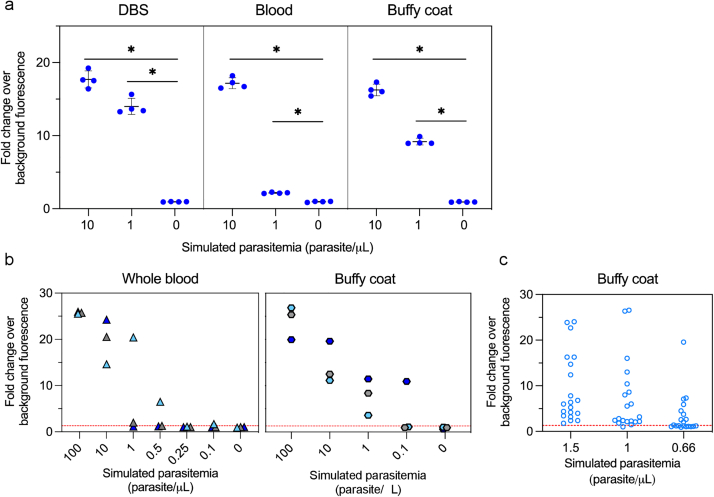
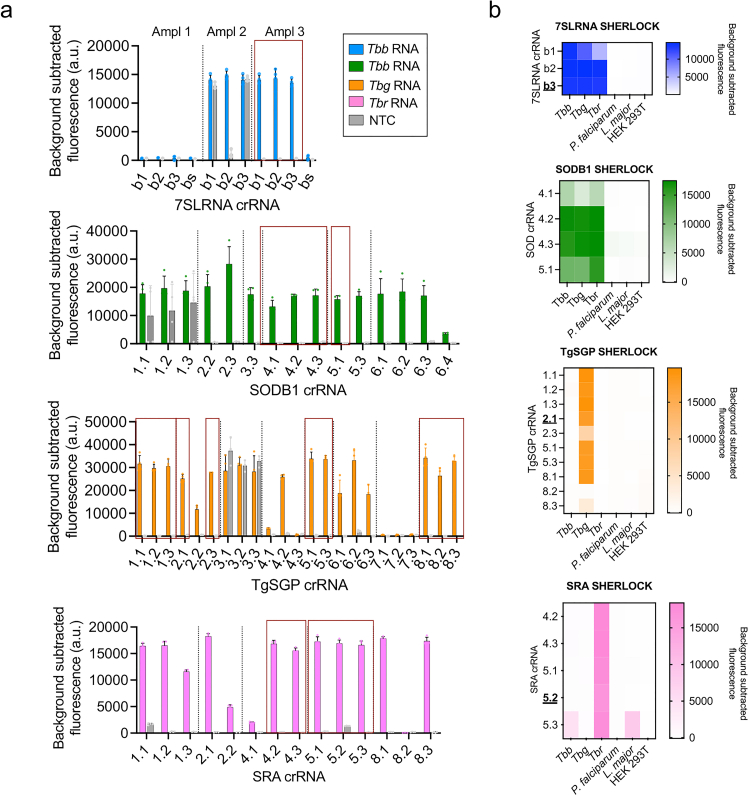
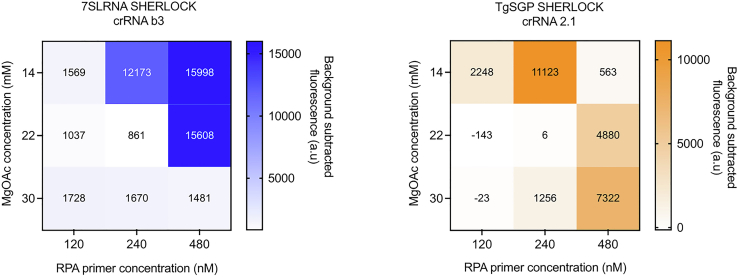
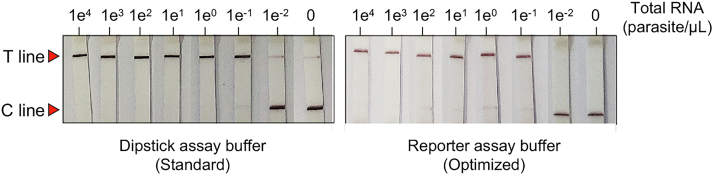
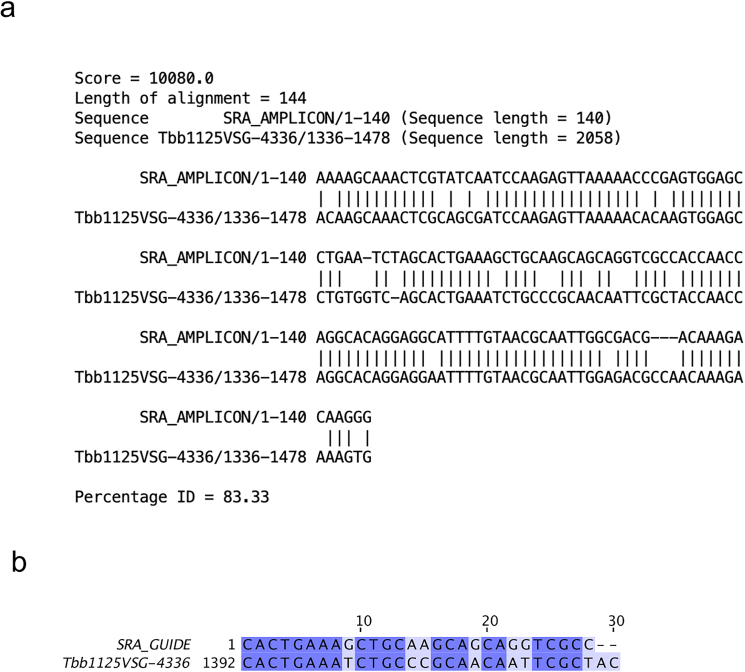
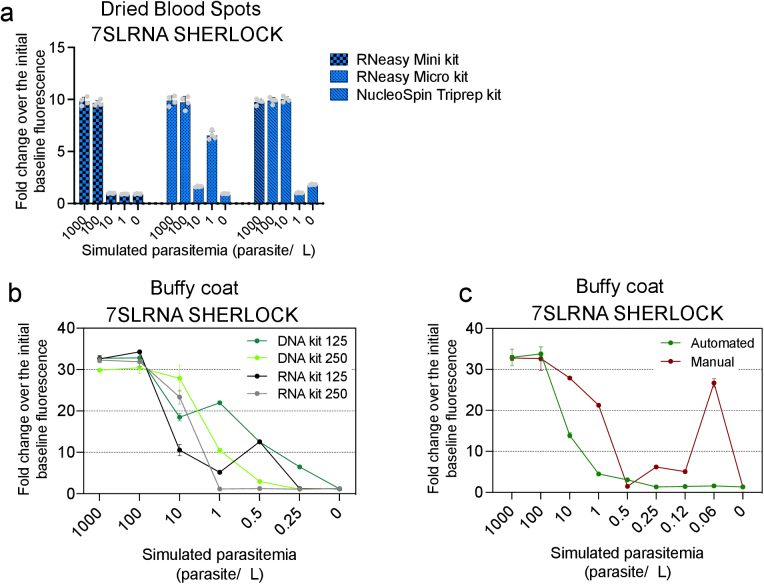
Methods: We adapted SHERLOCK for the detection of T. brucei species. We targeted 7SLRNA, TgSGP and SRA genes and tested SHERLOCK against RNA from blood, buffy coat, dried blood spots (DBS), and clinical samples.

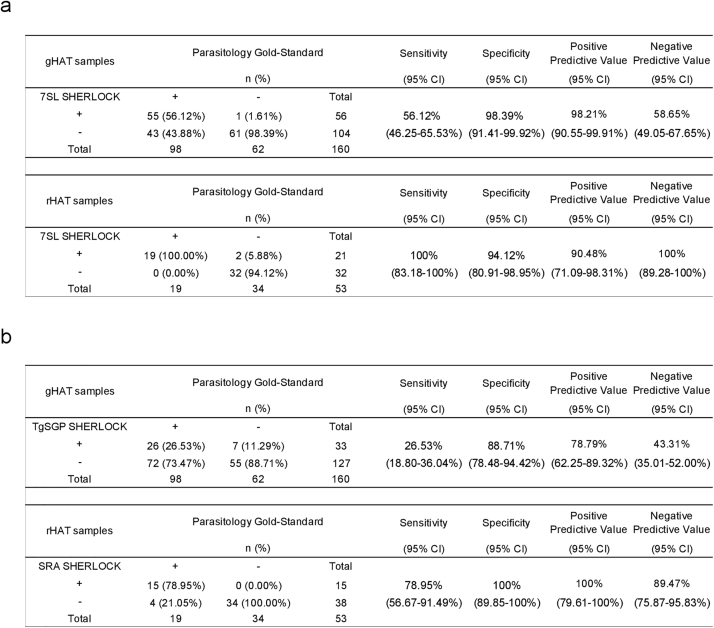
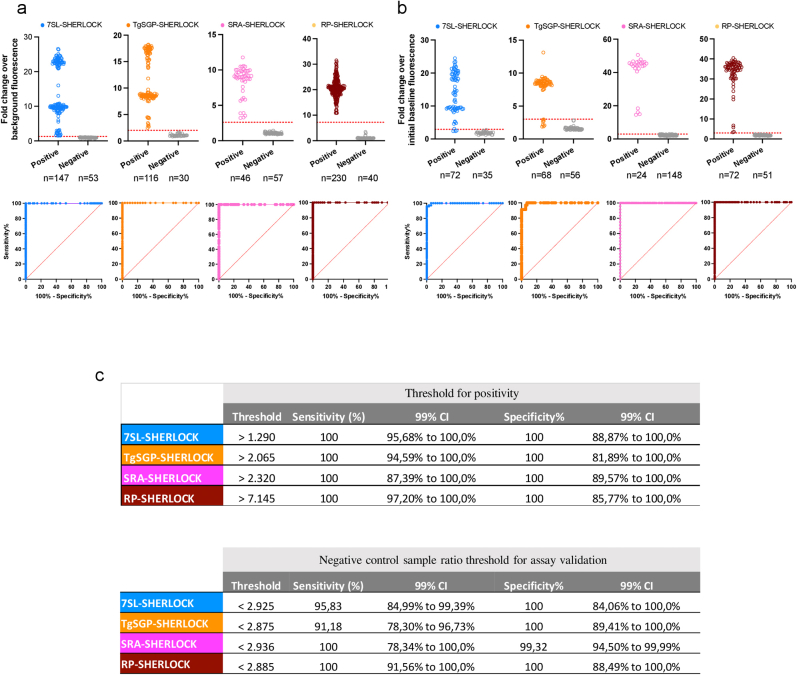
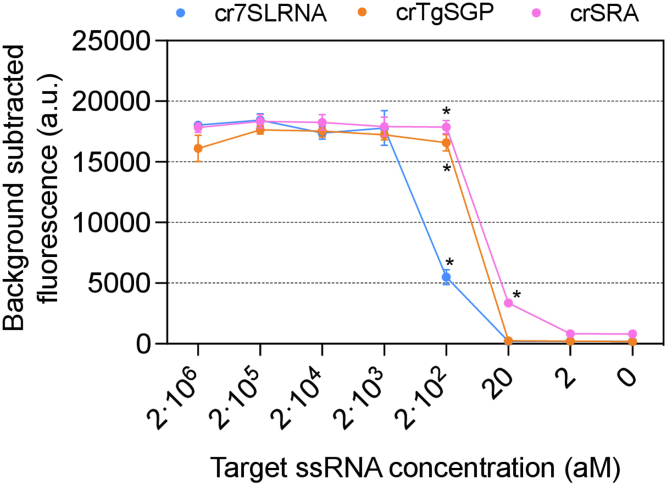
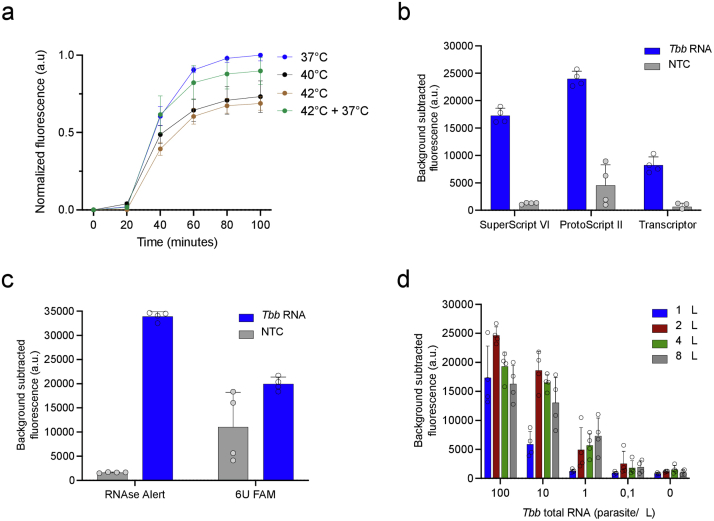
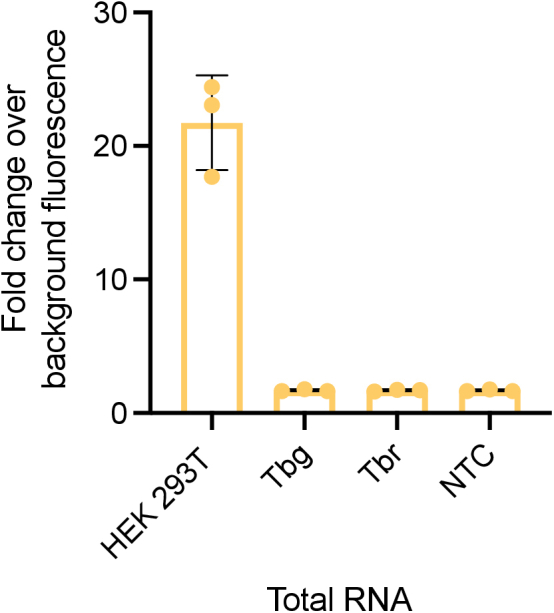
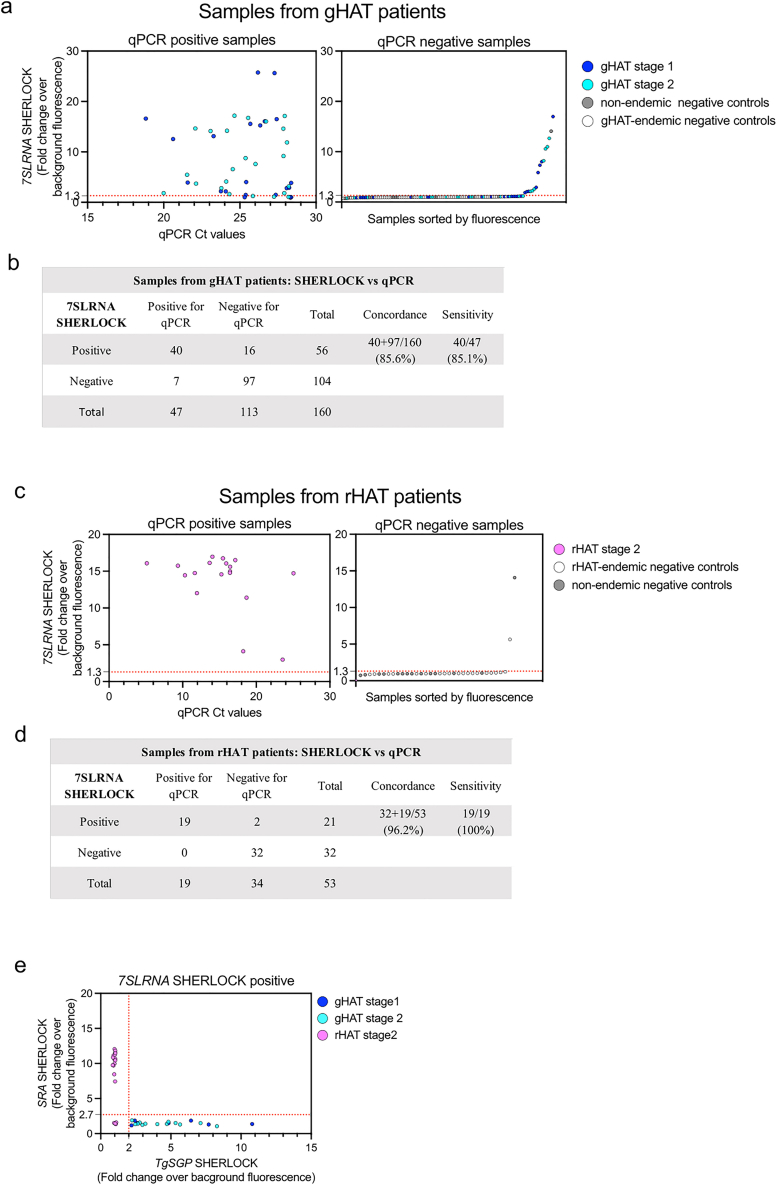
Findings: The pan-Trypanozoon 7SLRNA and T. b. gambiense-specific TgSGP SHERLOCK assays had a sensitivity of 0.1 parasite/μL and a limit of detection 100 molecules/μL. T. b. rhodesiense-specific SRA had a sensitivity of 0.1 parasite/μL and a limit of detection of 10 molecules/μL. TgSGP SHERLOCK and SRA SHERLOCK detected 100% of the field isolated strains. Using clinical specimens from the WHO HAT cryobank, the 7SLRNA SHERLOCK detected trypanosomes in gHAT samples with 56.1%, 95% CI [46.25-65.53] sensitivity and 98.4%, 95% CI [91.41-99.92] specificity, and rHAT samples with 100%, 95% CI [83.18-100] sensitivity and 94.1%, 95% CI [80.91-98.95] specificity. The species-specific TgSGP and SRA SHERLOCK discriminated between the gambiense/rhodesiense HAT infections with 100% accuracy.

Interpretation: The 7SLRNA, TgSGP and SRA SHERLOCK discriminate between gHAT and rHAT infections, and could be used for epidemiological surveillance and diagnosis of HAT in the field after further technical development.

Funding: Institut Pasteur (PTR-175 SHERLOCK4HAT), French Government's Investissement d'Avenir program Laboratoire d'Excellence Integrative Biology of Emerging Infectious Diseases (LabEx IBEID), and Agence Nationale pour la Recherche (ANR-PRC 2021 SherPa).

Keywords: Diagnostic; HAT; SHERLOCK; Trypanosoma brucei.


Conflict of interest statement

Declaration of interests The authors declare that they have no competing interests.

Figures

Fig. 1
Fig. 1
Detection of Trypanosoma brucei sspp. RNA with SHERLOCK. (a), Schematic overview of the SHERLOCK assay principle. Two-step SHERLOCK reaction is performed after TNA extraction. First, target NA is retro-transcribed and/or amplified during the RT-/RPA reaction at 42 °C. Second, the amplified target is in vitro transcribed and detected by Cas13a that cuts the RNA reporter upon target activation. Finally, the released reporter can be quantified with a fluorescence plate reader and/or with a LFA, making the methodology suitable for both mass screening and PoC testing. Panel created using BioRender.com. (b), Schematic showing selected target genes, RPA primer pairs and CRISPR guides. (c), Specificity of 7SLRNA, TgSGP and SRA in a two-step SHERLOCK reaction using RNA from T. b. brucei Lister 427, T. b. gambiense ELIANE strain, T. b. rhodesiense EATRO strain, Plasmodium falciparum, Leishmania major and Human Embryonic Kidney (HEK) T cells. Fluorescence was measured after 150 min. Background subtracted fluorescence of 4 technical replicates is plotted as mean ± standard deviation (SD). a.u., arbitrary units. (d), Limits of detection of the 7SLRNA, TgSGP and SRA targets in two-step SHERLOCK reactions. Dilution series of total RNA extracted from cultured parasites. T. b. brucei Lister 427, T. b. gambiense ELIANE strain, T. b. rhodesiense EATRO strain were used for the 7SLRNA, TgSGP and SRA SHERLOCK reactions, respectively. Fluorescence was measured after 150 min. Coloured circles represent the mean ± SD of 4 technical replicates. Mann–Whitney test between fluorescence outputs of samples vs. no-template controls. ∗p < 0.05. a.u., arbitrary units. (e), Limit of detection of 7SLRNA, TgSGP and SRA in a two-step SHERLOCK reaction with a lateral flow assay (LFA) read-out after 5 min. (f), Limits of detection of two-step vs. single-step 7SLRNA SHERLOCK reactions on total RNAs from T. b. brucei Lister 427. Fluorescence was measured after 150 min. Blue bars represent the mean background subtracted fluorescence ± SD of 4 technical replicates shown as open circles. Mann–Whitney test between fluorescence outputs of samples vs. no-template controls. ∗p < 0.05. a.u., arbitrary units; a.u., arbitrary units. (g), Kinetics of the single step reaction in f. Each coloured circle represents the average of 4 technical replicates ± SD.
Fig. 2
Fig. 2
Validation of SHERLOCK4HAT using field isolated samples. SHERLOCK detection of 7SLRNA, TgSGP or SRA targets using RNA extracted from field isolated trypanosome strains. TgSGP (left panel) and SRA (right panel) target readouts are plotted against 7SLRNA readouts in fold change over background fluorescence. Each dot represents the average readout of 4 technical replicates. The thresholds for each target (red lines) were determined using ROC curve analyses of positive and negative sample data. In brackets, after the name of the species, number of strains analysed.
Fig. 3
Fig. 3
Performance of SHERLOCK4HAT on dried blood spots, whole blood and buffy coat. (a), A comparison of the performance of the 7SLRNA SHERLOCK on trypanosome RNA extracted from dried blood spots (DBS), whole blood and buffy coat. All experiments were done in 4 replicates from a single pool of simulated infected blood. Fold changes over background fluorescence were plotted as mean ± SD. Mann–Whitney test between readout of samples vs. no-template controls. ∗p < 0.05. (b), Samples with known parasitemia were used to assess the analytical sensitivity of the 7SLRNA SHERLOCK. Three replicates of each dilution were tested. The tentative limit of detection (LoD) was the lowest concentration where 3/3 replicates were positive for the test. The detection threshold (red line) was determined using ROC curve analyses of positive and negative sample data. (c), The LoD was confirmed by using samples at 0.66×, 1× and 1.5× the estimated LoD concentration of the buffy coat only. The experiment was done on 20 replicates and the LoD was determined to be the concentration at which 95% of the samples were positive for the test. The detection threshold (red line) was determined using ROC curve analyses of positive and negative sample data.
Fig. 4
Fig. 4
Validation of SHERLOCK4HAT diagnostic using biobanked clinical samples. Diagnostic performances of (a), subgenus-specific 7SL SHERLOCK and (b), sub-species specific TgSGP and SRA SHERLOCK assays on gHAT and rHAT buffy coat samples from the HAT WHO specimen Biobank. Concordance rates are shown as proportions of gold-standard diagnosis results. Sensitivity, specificity, positive and negative predictive values are assessed with a 95% confidence interval as compared to the initial parasitological gold-standard diagnosis performed prior to sample freezing. n, number of samples; CI, confidence interval.
Fig. S1
Fig. S1
LwaCas13a protein expression and purification. Protein fractions collected during purification were analyzed by SDS-PAGE followed by Coomassie Blue staining. 1, cell pellet after clearing cell lysate; 2, cleared cell lysate supernatant; 3, flow-through following Strep-Tactin resin binding; 4, Strep-Tactin resin after SUMO protease cleavage; 5, eluted fraction post SUMO protease cleavage; L: Ladder; 7, eluted fraction after ion exchange chromatography (HiTrap column); 8, final product after size exclusion chromatography (Superdex column). The red ∗ at 135 kDa indicates the band corresponding to the purified LwaCas13a protein used in this study.
Fig. S2
Fig. S2
Receiver operating characteristic (ROC) curve analyses of positive and negative samples and threshold ratio calculation. (a), Laboratory generated positive and negative sample SHERLOCK ratios (fold change over background fluorescence) and ROC curves for 7SLRNA, TgSGP, SRA and RNase P targets to calculate threshold for positivity. (b), Laboratory generated positive and negative sample SHERLOCK ratios (fold change over initial fluorescence) and ROC curves for 7SLRNA, TgSGP, SRA and RNase P targets to calculate threshold ratio for assay validation. (c), Tables summarizing threshold ratios for each target and estimated sensitivity and specificity with the 99% CI.
Fig. S3
Fig. S3
Criteria for validation qPCR reads. (a), Cumulative distribution of the Ct values from Tb177bp qPCR of 82 reference negative samples to stablish the Ct value cut-off. Samples were considered positive when the identity of the amplicon is been confirmed by dissociation analysis (specific melt temperature ±0.5°). The red dots represent the values of the empirical cumulative distribution function, while the black line represents its interpolation using the Gaussian smoothing proposed by GraphPad Prism 9.1.2. The Gaussian modelling of the cumulative distribution function was used to determine a threshold of Ct = 28.5 corresponding to an estimated probability of 0. The Gaussian approximation seems relevant as the overlap of the observations (in red) and the model (in black) is visually valid. (b), Dissociation analysis of the qPCR amplicons from a dilution series of TNA using cultured parasites. The specific melt temperature for the Tb177bp repeats amplicon is 78.
Fig. S4
Fig. S4
Comparison of SRA sequences AF097331, AJ345058.1 and AJ345057.1.
Fig. S5
Fig. S5
RPA primer pair and CRISPR RNA guide screening for Trypanosoma brucei spp. target genes. (a), SHERLOCK performance using multiple combinations of RPA primer pairs and crRNA covering 7SLRNA, SODB1, TgSGP and SRA gene sequences. Bars represent the mean background subtracted fluorescence of 4 technical replicates +SD. Total RNA at 5 ng/mL from T. b. b. Lister 427, T. b. g. ELIANE strain or T. b. r. EATRO strain was used for the 7SLRNA and SODB1, TgSGP and SRA reactions, respectively. Red boxes highlight the crRNA that were further analysed. (b), Specificity of selected RPA primers and crRNA guides was assessed using RNA from T. b. b. Lister 427, T. b. g. ELIANE strain, T. b. r. EATRO strain, P. falciparum, L. major and human embryonic kidney (HEK) 293T cells. In bolt, the selected guides for following experiments. NTC, non-template control; Tbb, T. b. brucei; Tbg, T. b. gambiense; Tbr, T. b. rhodesiense.
Fig. S6
Fig. S6
Heat maps of RPA primer and MgOAc concentration combinations to detect 7SLRNA and TgSGP targets. RPA screens comprised of 9 set combinations of 3 MgOAc and 3 primer pair concentrations for best-performing condition to amplify sequence targets. Input ssRNA at 2000 aM for 7SLRNA and 200 aM for TgSGP.
Fig. S7
Fig. S7
SHERLOCK limit of detection (LoD) in the attomolar range. Dilution series of in vitro transcribed target 7SLRNA, TgSGP and SRA RNAs were used for the 7SLRNA, TgSGP and SRA SHERLOCK reactions respectively. Mann–Whitney test between fluorescence output of samples versus no-template controls. ∗p < 0.05.
Fig. S8
Fig. S8
Lateral Flow Assay (LFA) optimization. Performance of two LFA buffers. A reporter assay buffer or a dipstick assay buffer were used to dilute the 7SLRNA SHERLOCK reaction prior the lateral flow assay. The signal was read after 5 min of incubation. Left panel is the experiment shown in Fig. 1e for comparison.
Fig. S9
Fig. S9
Optimization of one-tube reaction. (a), Comparison of different incubation temperatures. Three different temperatures were assessed, 37 °C, 40 °C and 42 °C, and a combination of 42 °C for 10 min (optimal for RT-PCR) followed by 37 °C for the rest of the reaction (optimal for Cas13a). Incubation at 37 °C resulted to be the best performance temperature, in terms of speed and signal. RNA from 100 parasite/mL was used in each reaction. (b), Retro transcriptase enzymes from different manufacturers were compared. ProtoScript II from NEB was selected for the optimized reaction as it gave higher signal and was more cost-effective. RNA from 100 parasite/mL was used in each reaction. (c), Two RNA quenched fluorescent RNA reporters were tested. RNase Alert was selected for the optimized reaction as it led to a higher signal-to-noise ratio. RNA from 100 parasite/mL was used in each reaction. (d), Different input volumes were assessed in the one-tube reaction. For the optimized reaction 8 mL of input volume was used to increase the sensitivity of the test.
Fig. S10
Fig. S10
Alignment of SRA amplicon and guide with Tbb1125VSG-4336. (a), Clustal alignment of SRA SHERLOCK amplicon with Tbb1125VSG-4336 expressed in the triple positive field isolated sample AnTat 22.1. (b), Nucleotide mismatches between the SRA crRNA and Tbb1125VSF-4336.
Fig. S11
Fig. S11
Total nucleic acid extraction optimization. (a), Comparison of TNA extraction from DBS. Fifty microliters of spiked sheep blood was dried on Whatman 903™ Cards and stored for 24 h at room temperature. TNA were extracted from 3 punches of 6 mm using the RNeasy mini kit (QIAGEN), RNeasy micro kit (QIAGEN) or the NucleoSpin Triprep (Macherey–Nagel). Bars represent mean readout + SD of 4 SHERLOCK replicates, shown as grey circles. (b), Trypanosome TNAs extraction from spiked human buffy coat using Maxwell automated system. Two Maxwell RSC kits (simplyRNA blood kit and Blood DNA kit) and two different input volumes (125 μL and 250 μL) were compared. (c), SHERLOCK assay for 7SLRNA target. Uninfected human blood was spiked with 1000 p/μL followed by dilution series. Buffy coat was obtained by centrifugation and TNAs were purified either with Maxwell automated system (Maxwell RSC Blood DNA kit) or with the manual column-based QIAGEN RNeasy mini kit, with minor modifications (see materials and methods). The data from the Maxwell extraction system is also shown in Fig. 3b.
Fig. S12
Fig. S12
Human RNase P SHERLOCK assay. Total RNA from human cells (1 ng/μL) or cultured parasites (5 ng/μL) was assessed with RNase P SHERLOCK. RNase P test performed well and showed no cross-reactivity with parasite RNA. Bars represent the mean of three technical replicates ±SD.
Fig. S13
Fig. S13
Validation of SHERLOCK4HAT diagnostic using bio-banked clinical samples. (a), 7SLRNASHERLOCK analysis of 160 gHAT qPCR positive (left) and negative (right) buffy coat samples obtained from human subjects in gHAT endemic and non-endemic regions. Each dot indicates one sample analysed by both 7SLRNA SHERLOCK and Tb177bp-repeats-qPCR. The dashed red line is the threshold above which samples were considered positive for SHERLOCK. The dot colours indicate the classification according to the original diagnosis in the field. (b), Concordance tables, sensitivity and specificity of 7SLRNA SHERLOCK for detection of trypanosome NA in buffy coat samples from individuals in gHAT endemic and non-endemic regions. qPCR indicates samples that were analysed by Tb177bp-repeats-qPCR. nC, negative controls from non-endemic regions, gC, gHAT negative endemic controls. (c), 7SLRNA SHERLOCK analysis of 53 rHAT qPCR positive (left) and negative (right) buffy coat samples obtained from human subjects in rHAT endemic and non-endemic regions. Each dot indicates one sample analysed by both 7SLRNA SHERLOCK and Tb177bp-repeats-qPCR. The dashed red line is the threshold above which samples were considered positive for SHERLOCK. The dot colours indicate the classification according to the original diagnostic in the field. (d), Concordance tables, sensitivity and specificity of 7SLRNA SHERLOCK for detection of trypanosome NA in buffy coat samples from individuals in rHAT endemic and non-endemic regions. qPCR indicates samples that were analysed by Tb177bp-repeats-qPCR. nC, non-endemic negative controls, rC, rHAT endemic negative controls. (e), TgSGP and SRA SHERLOCK discriminate between T. b. gambiense and T. b. rhodesiense NA in patients. All gHAT and rHAT patient samples positive for 7SLRNA were plotted according to their TgSGP and SRA SHERLOCK results. The thresholds for each target (red lines) were determined using ROC curve analyses of positive and negative sample data.

References

    1. Büscher P., Cecchi G., Jamonneau V., Priotto G. Human African trypanosomiasis. Lancet. 2017;390:2397–2409. - PubMed
    1. Franco J.R., Cecchi G., Priotto G., et al. Monitoring the elimination of human African trypanosomiasis at continental and country level: update to 2018. PLoS Negl Trop Dis. 2020;14(5) doi: 10.1371/journal.pntd.0008261. - DOI - PMC - PubMed
    1. Büscher P., Gilleman Q., Lejon V. Rapid diagnostic test for sleeping sickness. N Engl J Med. 2013;368:1069–1070. - PubMed
    1. Büscher P., Deborggraeve S. How can molecular diagnostics contribute to the elimination of human African trypanosomiasis? Expert Rev Mol Diagn. 2015;15:607–615. - PubMed
    1. Deborggraeve S., Büscher P. Recent progress in molecular diagnosis of sleeping sickness. Expert Rev Mol Diagn. 2012;12:719–730. - PubMed