. 2022 Nov 14;13(11):956.
doi: 10.1038/s41419-022-05419-y.

GALNT14-mediated O-glycosylation on PHB2 serine-161 enhances cell growth, migration and drug resistance by activating IGF1R cascade in hepatoma cells

Affiliations

GALNT14-mediated O-glycosylation on PHB2 serine-161 enhances cell growth, migration and drug resistance by activating IGF1R cascade in hepatoma cells

Yu-De Chu et al. Cell Death Dis. .

Abstract

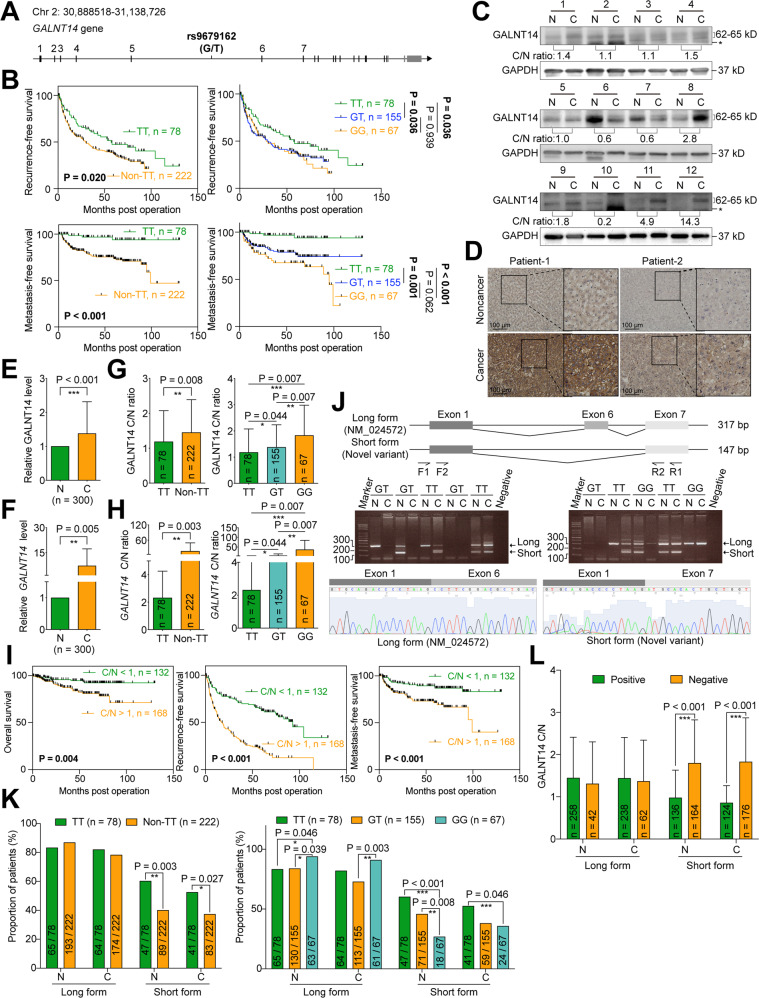
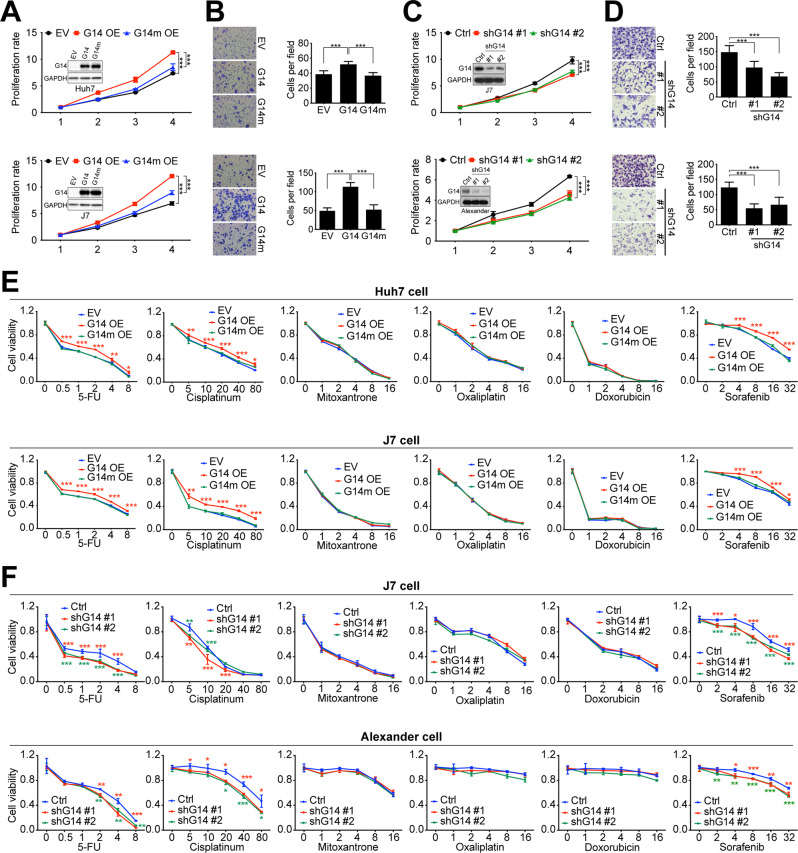
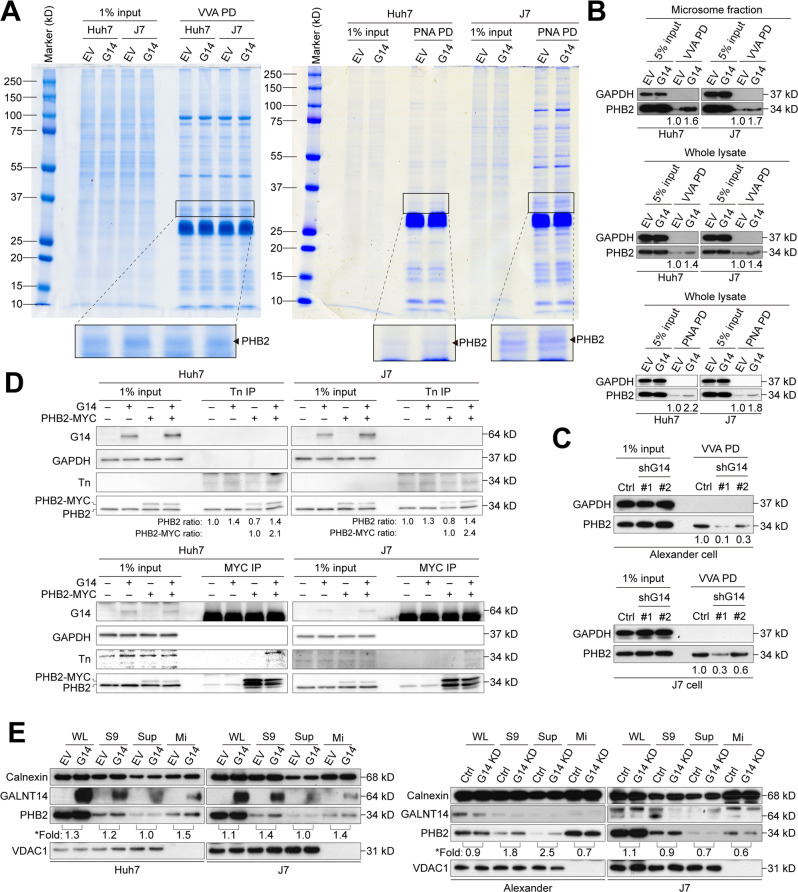
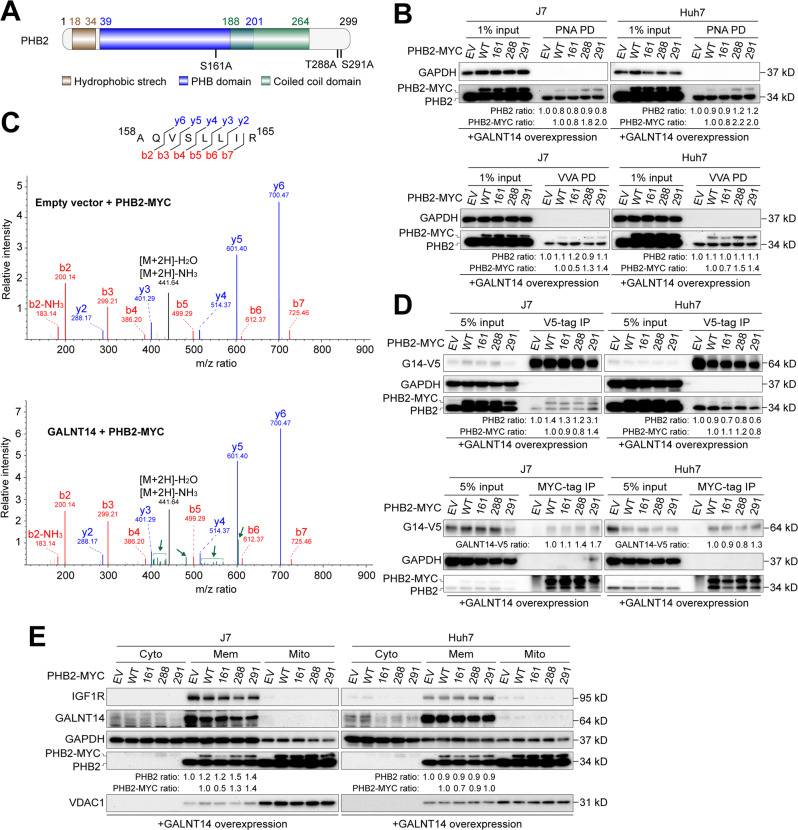
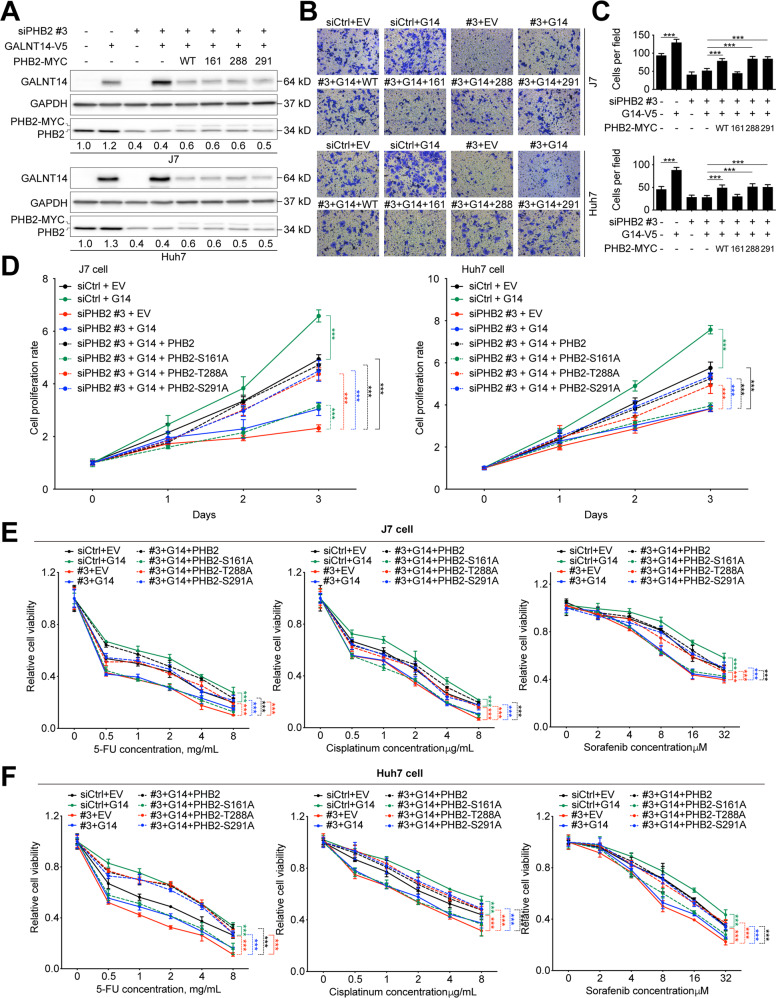
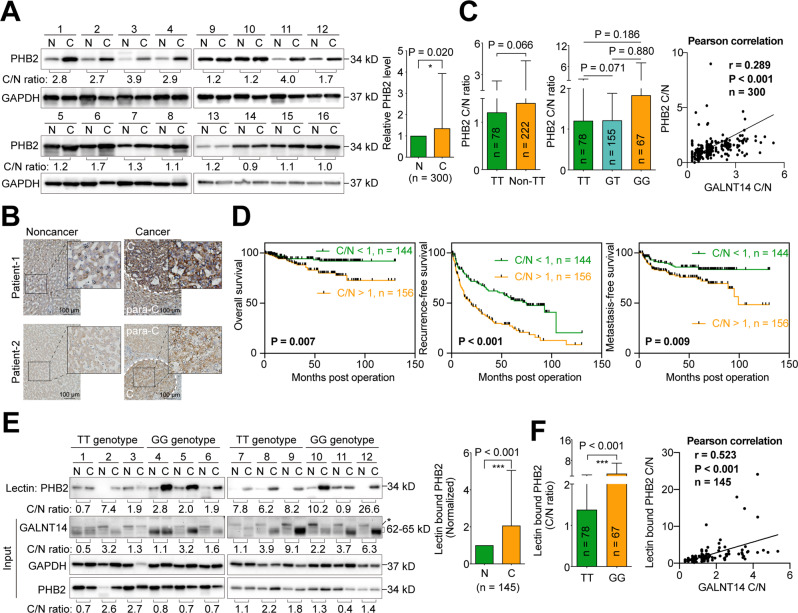
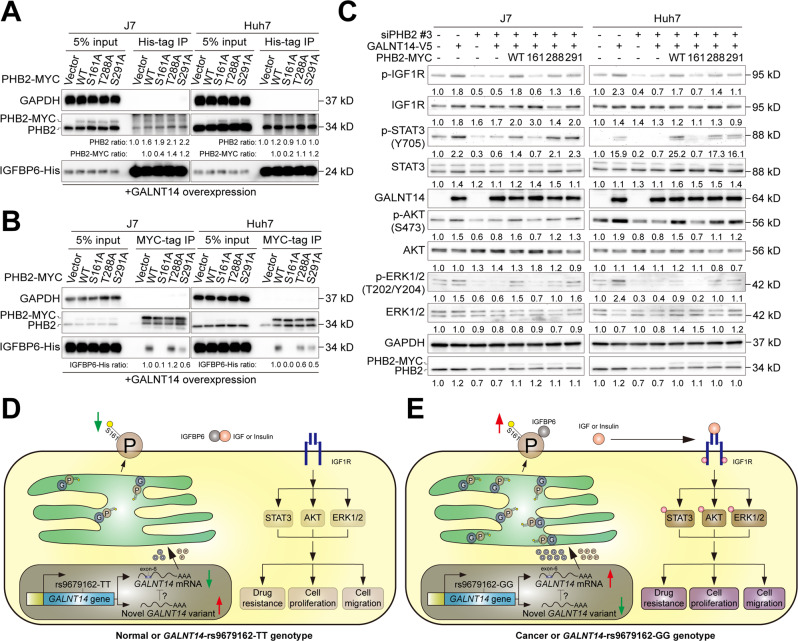
The single nucleotide polymorphism (SNP) rs9679162 located on GALNT14 gene predicts therapeutic outcomes in patients with intermediate and advanced hepatocellular carcinoma (HCC), but the molecular mechanism remains unclear. Here, the associations between SNP genotypes, GALNT14 expression, and downstream molecular events were determined. A higher GALNT14 cancerous/noncancerous ratio was associated with the rs9679162-GG genotype, leading to an unfavorable postoperative prognosis. A novel exon-6-skipped GALNT14 mRNA variant was identified in patients carrying the rs9679162-TT genotype, which was associated with lower GALNT14 expression and favorable prognosis. Cell-based experiments showed that elevated levels of GALNT14 promoted HCC growth, migration, and resistance to anticancer drugs. Using a comparative lectin-capture glycoproteomic approach, PHB2 was identified as a substrate for GALNT14-mediated O-glycosylation. Site-directed mutagenesis experiments revealed that serine-161 (Ser161) was the O-glycosylation site. Further analysis showed that O-glycosylation of PHB2-Ser161 was required for the GALNT14-mediated growth-promoting phenotype. O-glycosylation of PHB2 was positively correlated with GALNT14 expression in HCC, resulting in increased interaction between PHB2 and IGFBP6, which in turn led to the activation of IGF1R-mediated signaling. In conclusion, the GALNT14-rs9679162 genotype was associated with differential expression levels of GALNT14 and the generation of a novel exon-6-skipped GALNT14 mRNA variant, which was associated with a favorable prognosis in HCC. The GALNT14/PHB2/IGF1R cascade modulated the growth, migration, and anticancer drug resistance of HCC cells, thereby opening the possibility of identifying new therapeutic targets against HCC.


Conflict of interest statement

The authors declare no competing interests.

Figures

Fig. 1
Fig. 1. Higher cancerous/noncancerous ratios for GALNT14 and the rs9679162-non-TT genotype are associated with unfavorable postoperative outcomes in patients with HCC.
A Genomic structure of the GALNT14 locus. Black vertical lines indicate predicted translatable regions, while gray lines indicate non-coding regions. B Kaplan–Meier analysis of postoperative outcomes in patients with HCC stratified according to rs9679162 genotypes. P values were obtained by log-rank test. C Representative images of western blots of patient samples. N noncancerous part, C cancerous part. The anti-GALNT14 reactive bands migrating between 62-65 kD were verified to be GALNT14-derived protein species by mass spectrometry. However, the band migrating below 62 kD, marked by “*”, was not GALNT14-related. D Representative IHC images obtained from patients with HCC are shown. Statistical comparison of GALNT14 protein (E) and mRNA (F) levels between noncancerous (N) and cancerous (C) tissues. P values were calculated by paired two-tailed student’s t test. Cancerous/noncancerous (C/N) ratios of GALNT14 in protein (G) and mRNA (H) levels were compared between rs9679162-TT and non-TT (GT or GG) genotypes. P values were calculated by the two-tailed Mann–Whitney U test. I Kaplan–Meier analysis of overall (left), recurrence-free (middle), and metastasis-free (right) survival, stratified by the cancerous/noncancerous (C/N) ratio of GALNT14. P values were calculated by log-rank test. J Schematic representation of alternative splicing occurring on designated exons, with exon-6 deleted in the short form GALNT14 mRNA (a novel variant). Agarose gel images show the presence of long (NM_024572, with product size 317 bp) and short (product size 147 bp) forms of GALNT14 mRNA in HCC tissues. K Comparison of the proportion of patients carrying the long and short forms of GALNT14 mRNA between the TT and non-TT (GG or GT) genotypes. Comparisons were made within the noncancerous (N) and cancerous (C) groups, respectively. P values were calculated by Fisher’s exact test. L Comparison of GALNT14 cancerous/noncancerous (C/N) ratios between patients positive and negative for the long or short form of GALNT14 mRNAs. Again, comparisons were made between the noncancerous (N) and cancerous (C) groups. P values were calculated by the two-tailed Mann–Whitney U test.
Fig. 2
Fig. 2. Altered expression of GALNT14 affects the growth, migration, and sensitivity of HCC cells to anticancer drugs.
A Cell proliferation rate of mock cells (EV), cells overexpressing GALNT14 (G14 OE), and cells overexpressing the GALNT14 mutant (G14m OE). The latter carried three enzyme-inactivating mutations. P values were calculated by two-way ANOVA. Western blot images are inserted to demonstrate overexpression of GALNT14 or GALNT14 mutant. Horizontal axis, days after cell seeding; vertical axis, fold increase normalized to day 1 value. B Representative images of transwell assays for HCC cells, Huh7 (upper) and J7 (lower), with or without overexpression of GALNT14 (or GALNT14 mutant). Quantitative results are displayed in the right panel. P values were calculated by paired two-tailed student’s t test. C Cell proliferation rate of HCC cells with or without GALNT14 silencing. P values were calculated by two-way ANOVA. Western blot images are shown indicating successful silencing of GALNT14. These blots were overexposed to demonstrate endogenous GALNT14. D Representative images of transwell assays for the HCC cells, Huh7 (upper) and J7 (lower), with or without GALNT14 silencing. Quantitative results are displayed in the right panel. P values were calculated by paired two-tailed student’s t test. G14 GALNT14, Ctrl mock control for shRNA (shLacZ). E, F Relative cell viability of HCC cells treated with anticancer drugs. E Evaluation of the sensitivity of cells overexpressing GALNT14 (G14 OE) or GALNT14 mutant (G14m OE) to anticancer drugs 5-FU (in mg/mL as marked in the horizontal axis), Cisplatin (in μg/mL), Mitoxantrone (in μg/mL), Oxaliplatin (in μg/mL), Doxorubicin (in mg/mL), and Sorafenib (in μM). F A similar assessment was performed on cells with GALNT14 silencing. Vertical axis, relative fold change normalized by the value of concentration “0”. P values at each concentration were obtained by comparing cells transfected with empty vector (EV) or control shRNA (Ctrl), and cells transfected with G14/G14m or shG14 #1/2. Unpaired two-tailed student’s t test was used. *P < 0.05; **P < 0.01; ***P < 0.001.
Fig. 3
Fig. 3. PHB2 is a promising GALNT14 substrate.
A Microsomal fractions isolated from Huh7 and J7 cells were subjected to Vicia villosa (VVA)- or peanut agglutinin (PNA)-mediated pulldown (PD). Pulldown proteins were separated by 10% SDS-PAGE and stained by the colloidal blue silver stain. Protein bands with significant density changes were excised for LC/MS/MS identification. B, C Representative western blots demonstrating enriched PHB2 levels by VVA- or PNA-mediated pulldown in HCC cells with or without GALNT14 overexpression or silencing. D Western blotting following Tn antigen or MYC-tag immunoprecipitation (IP) using lysates of HCC cells transfected with the indicated plasmids. E Distribution of PHB2 and GALNT14 in microsomal fractions assessed by western blot using lysates of Huh7 and J7 cells with GALNT14 overexpression (upper) and silencing (lower). Calnexin was used as a specific marker for microsome fraction, while VDAC1 was used as a marker for the mitochondrial fraction. *Fold, fold of increase upon GALN14 (G14) overexpression.
Fig. 4
Fig. 4. Serine residue 161 of PHB2 serves as a target site for GALNT14-mediated O-glycosylation.
A Schematic representation of predicted PHB2 domains and residues as O-glycosylation hotspots. B PNA- or VVA-mediated pulldown of PHB2 was performed using lysates of cells transfected with the indicated plasmids. C Spectrum of Serine-161-containing peptides derived from LC/MS/MS. Green bars and arrows indicate that there were certain uncharacterized modifications on the fragmented peptides. m/z, the mass-to-charge ratio, where m is the molecular or atomic mass number and z is the charge number of the ion. D Western blot analysis following co-immunoprecipitation using samples of HCC cells transfected with the indicated plasmids. E Western blot analysis of subcellular fractions fractionated from cells transfected with the indicated plasmids, including cytosolic (Cyto), membranous (Mem) and mitochondrial (Mito). IGF1R was used as a specific marker for the membrane fraction, while VDAC1 was used as a marker for the mitochondrial fraction.
Fig. 5
Fig. 5. O-glycosylation of PHB2 at Ser161 is crucial to orchestrate the GALNT14-induced phenotype.
A Western blot analysis of lysates of cells transfected with the indicated plasmids. B Representative images of transwell-based migration assays. Quantitative results of migrated cells are shown in (C). P values were calculated by the two-tailed Mann–Whitney U test. D Alarmar blue-based cell growth assay using cells transfected with the indicated plasmids. P values were calculated by the two-way ANOVA. E, F Relative cell viability of anticancer drug-treated HCC cells transfected with the indicated plasmids. Three anticancer drugs were tested, including 5-FU, Cisplatin, and Sorafenib. P values were calculated by the two-way ANOVA. ***P < 0.001.
Fig. 6
Fig. 6. PHB2 and its O-glycosylated forms are upregulated in HCC.
A Representative images of western blots of HCC patient samples. N noncancerous part, C cancerous part. Statistical comparison between PHB2 levels in the noncancerous and cancerous parts is given in the right panel. P values were calculated by paired two-tailed student’s t test. B Representative IHC images of HCC patient tissues. The scale bar is given in the right lower corner. C cancerous tissue, para-C para-cancerous tissue. C Statistical comparison of PHB2 cancerous/noncancerous (C/N) ratios between tissues from patients with the indicated rs9679162 genotypes (left and middle panel). P values were calculated by the two-tailed Mann–Whitney U test. The C/N ratios of GALNT14 protein and PHB2 protein were correlated using the Pearson correlation (right panel). D Kaplan–Meier analysis of overall (left), recurrence-free (middle), and metastasis-free (right) survival, stratified by the C/N ratio of PHB2 protein. P values were calculated by log-rank test. E Representative image of western blots of samples of lectin pulldown assays using lysates extracted from HCC tissues (upper panel). A statistical comparison of PHB2 protein levels between the noncancerous (N) and cancerous (C) tissues is given in the right panel. P value was calculated by paired two-tailed student’s t test. F Statistical comparison of the C/N ratio of lectin-bound PHB2 in HCC tissues between patients with the indicated rs9679162 genotype (left panel). The C/N ratios of GALNT14 protein and lectin-bound PHB2 protein were correlated using the Pearson correlation (right panel). TT rs9679162-TT genotype, Non-TT rs9679162-non-TT genotype, GT rs9679162-GT genotype, GG rs9679162-GG genotype.
Fig. 7
Fig. 7. GALNT14-mediated O-glycosylation of PHB2 at Ser161 promotes IGF1R-mediated signaling through the association of PHB2 with IGFBP6.
A, B Western blot analysis of co-immunoprecipitation assays using HCC cell samples treated as indicated. C Western blot analysis of HCC cell lysates treated as indicated. D, E Working model of this study. The newly discovered short RNA variant of GALNT14 is present and able to attenuate the expression of exon-6-containing mRNA in normal hepatocytes or in patients carrying the rs9679162-TT genotype. Consequently, lower levels of GALNT14, PHB2, and O-glycosylated PHB2 are produced, preventing activation of IGF1R-mediated signaling (D). However, in cancerous hepatocytes or patients carrying the rs9679162-GG genotype, the novel RNA variant of GALNT14 was absent and failed to suppress the expression of mRNA containing exon-6, resulting in increased levels of GALNT14, PHB2, and O-glycosylated PHB2. The increase in O-glycosylated PHB2 competes for binding with IGFBP6, thereby increasing IGF (or insulin) release to activate the IGF1R-mediated signaling cascade.

Similar articles

Cited by

References

    1. Siegel RL, Miller KD, Jemal A. Cancer statistics, 2016. CA Cancer J Clin. 2016;66:7–30. doi: 10.3322/caac.21332. - DOI - PubMed
    1. Clark T, Maximin S, Meier J, Pokharel S, Bhargava P. Hepatocellular Carcinoma: Review of Epidemiology, Screening, Imaging Diagnosis, Response Assessment, and Treatment. Curr Probl Diagn Radiol. 2015;44:479–86. doi: 10.1067/j.cpradiol.2015.04.004. - DOI - PubMed
    1. Janevska D, Chaloska-Ivanova V, Janevski V. Hepatocellular Carcinoma: Risk Factors, Diagnosis and Treatment. Open Access Maced J Med Sci. 2015;3:732–6. doi: 10.3889/oamjms.2015.111. - DOI - PMC - PubMed
    1. Pang TC, Lam VW. Surgical management of hepatocellular carcinoma. World J Hepatol. 2015;7:245–52. doi: 10.4254/wjh.v7.i2.245. - DOI - PMC - PubMed
    1. Pascual S, Herrera I, Irurzun J. New advances in hepatocellular carcinoma. World J Hepatol. 2016;8:421–38. doi: 10.4254/wjh.v8.i9.421. - DOI - PMC - PubMed

Publication types

MeSH terms

Substances