. 2022 Nov 14;14(1):53.
doi: 10.1038/s41368-022-00207-y.

Low intensity near-infrared light promotes bone regeneration via circadian clock protein cryptochrome 1

Affiliations

Low intensity near-infrared light promotes bone regeneration via circadian clock protein cryptochrome 1

Jinfeng Peng et al. Int J Oral Sci. .

Abstract

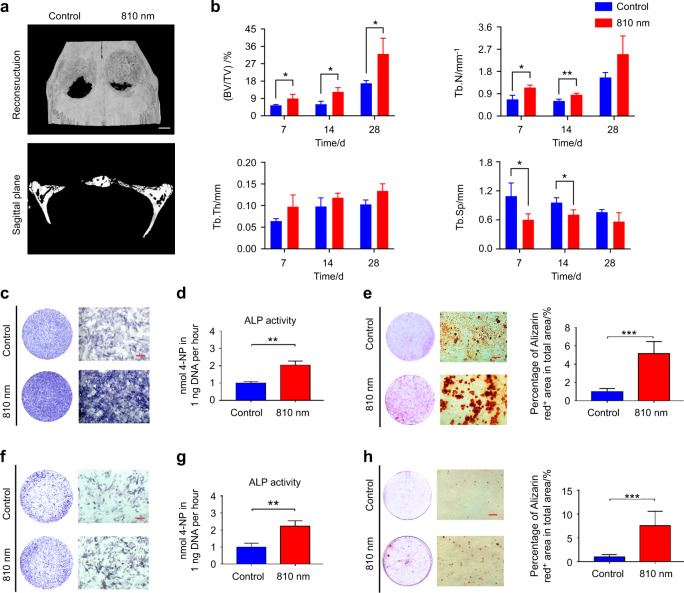
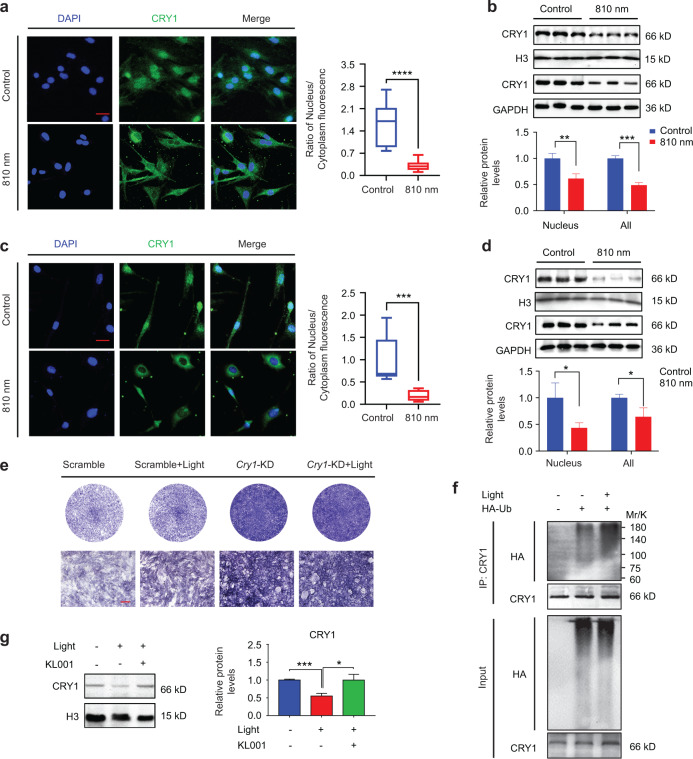
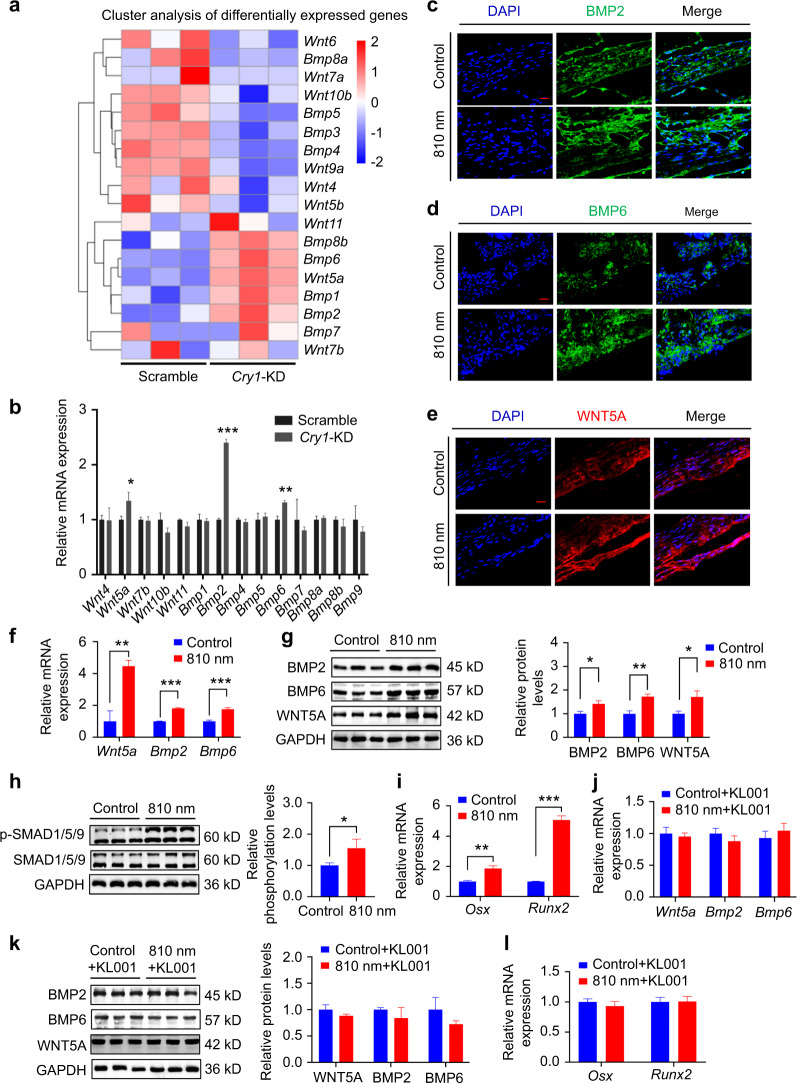
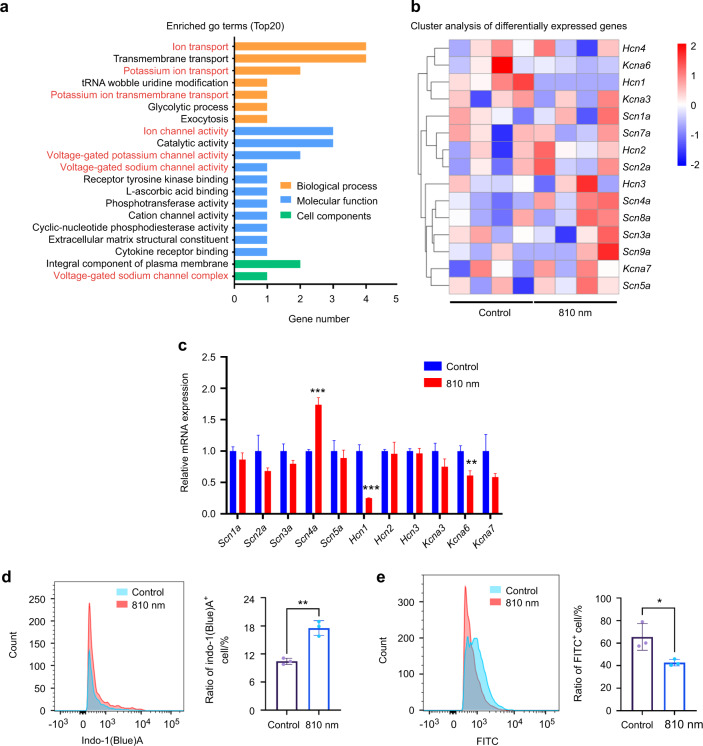
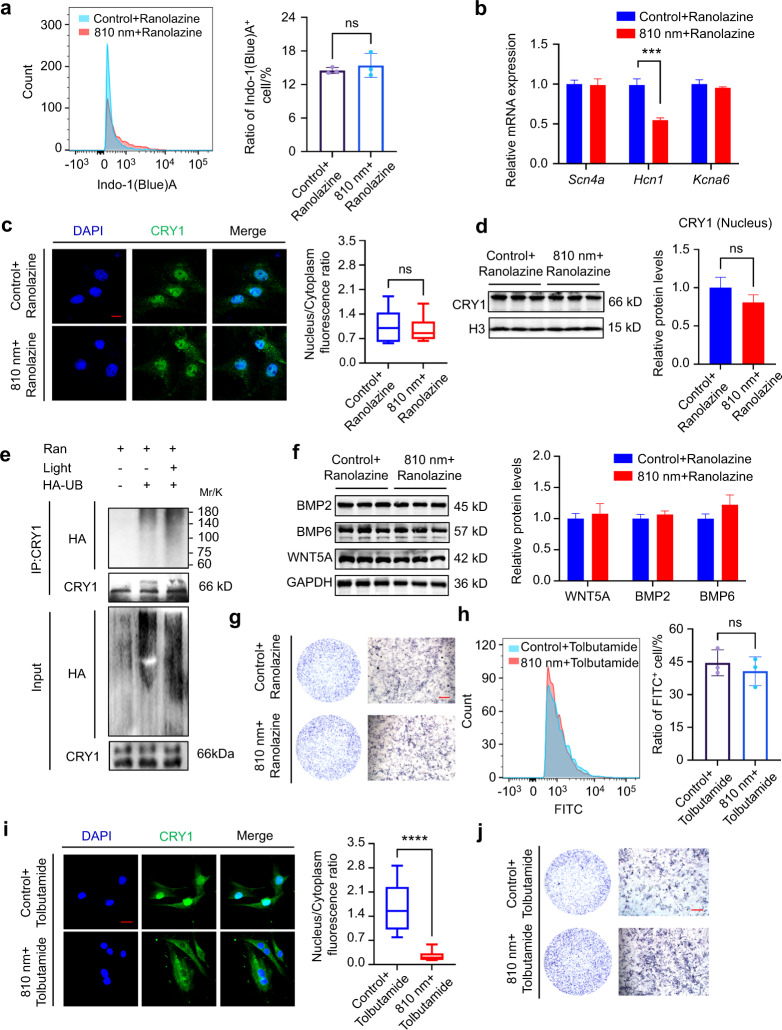
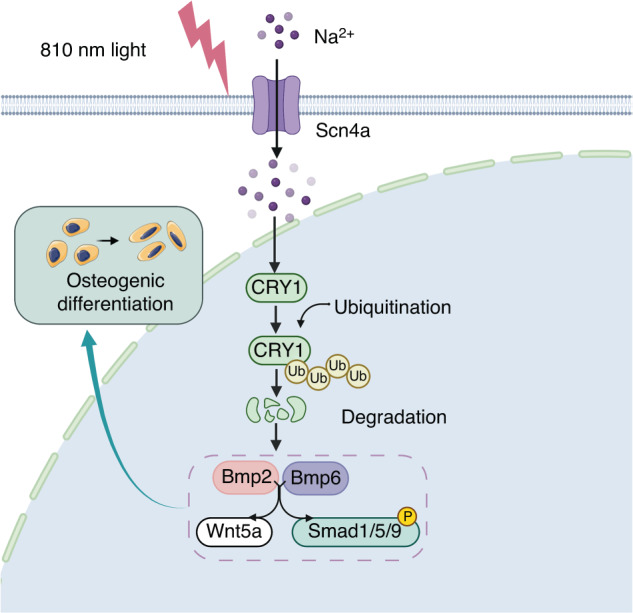
Bone regeneration remains a great clinical challenge. Low intensity near-infrared (NIR) light showed strong potential to promote tissue regeneration, offering a promising strategy for bone defect regeneration. However, the effect and underlying mechanism of NIR on bone regeneration remain unclear. We demonstrated that bone regeneration in the rat skull defect model was significantly accelerated with low-intensity NIR stimulation. In vitro studies showed that NIR stimulation could promote the osteoblast differentiation in bone mesenchymal stem cells (BMSCs) and MC3T3-E1 cells, which was associated with increased ubiquitination of the core circadian clock protein Cryptochrome 1 (CRY1) in the nucleus. We found that the reduction of CRY1 induced by NIR light activated the bone morphogenetic protein (BMP) signaling pathways, promoting SMAD1/5/9 phosphorylation and increasing the expression levels of Runx2 and Osterix. NIR light treatment may act through sodium voltage-gated channel Scn4a, which may be a potential responder of NIR light to accelerate bone regeneration. Together, these findings suggest that low-intensity NIR light may promote in situ bone regeneration in a CRY1-dependent manner, providing a novel, efficient and non-invasive strategy to promote bone regeneration for clinical bone defects.


Conflict of interest statement

The authors declare no competing interests.

Figures

Fig. 1
Fig. 1
The 810 nm low-intensity NIR light promotes bone regeneration. a, b Representative images (a) of micro-CT reconstruction of skull in rats with or without 810 nm NIR light irradiation at 7, 14, 28 days and analysis (b) of bone volume/total volume (BV/TV), trabecular number (Tb.N), trabecular thickness (Tb.Th), trabecular separation (Tb.Sp) of skull defect area. c, d Representative ALP staining images (c) and quantitative detection of ALP activity (d) in BMSCs with or without 810 nm NIR light irradiation for 7 days. e At 3 weeks after the induction of osteogenic differentiation in BMSCs with or without 810 nm NIR light irradiation, each wells was stained with ARS (left). The ARS-positive areas were quantified from each individual culture plate (right). f, g Representative ALP staining images (f) and quantitative detection of ALP activity (g) in MC3T3-E1 cells with or without 810 nm NIR light irradiation for 7 days. h At 3 weeks after the induction of osteogenic differentiation in MC3T3-E1 cells with or without 810 nm NIR light irradiation, each wells was stained with ARS (left). The AR-positive areas were quantified from each individual culture plate (right). Data are presented as the mean ± SD. *P < 0.05, **P < 0.01, ***P < 0.001. Scale bar: 1 mm for (a) and 100 μm for (c, e, f, h)
Fig. 2
Fig. 2
The effect of 810 nm NIR light on osteogenic differentiation was related to the ubiquitination degradation of CRY1. a Immunofluorescence staining of CRY1 (green) in BMSCs with or without 810 nm NIR light irradiation, together with nuclei (blue) (left), and the quantitative analysis of nucleus/cytoplasm fluorescence ratio (right) were represented. b BMSCs were treated with or without 810 nm NIR light for the indicated minutes. The protein expressions of CRY1 and H3 in the nucleus and the protein expressions of CRY1 and GAPDH in the whole cell were analyzed by Western blot. c Immunofluorescence staining of CRY1 (green) in MC3T3-E1 cells with or without 810 nm NIR light irradiation, together with nuclei (blue) (left), and the quantitative analysis of nucleus/cytoplasm fluorescence ratio (right) were represented. d MC3T3-E1 cells were treated with or without 810 nm NIR light for the indicated minutes. The protein expressions of CRY1 and H3 in the nucleus and the protein expressions of CRY1 and GAPDH in the whole cell were analyzed by Western blot. e Representative ALP staining images in scramble BMSCs and Cry1-knockdown BMSCs with or without 810 nm NIR light irradiation for 7 days. f MC3T3-E1 cells were transfected with HA-Ub for 24 h and then treated with or without 810 nm NIR light. The ubiquitination level of CRY1 in the nucleus was detected using an anti-HA antibody. g BMSCs were treated with or without KL001 (1 μg·mL−1) for 2 h before 810 nm light irradiation. The protein expressions of CRY1 and H3 in the nucleus were analyzed by Western blot. Data are presented as the mean ± SD. *P < 0.05, **P < 0.01, ***P < 0.001, ****P < 0.000 1. Scale bar: 50 μm for (a, c) and 100 μm for (e)
Fig. 3
Fig. 3
CRY1 reduction activates the BMP signaling pathways to promote osteogenesis. a Cluster analysis of differentially expressed genes associated with osteogenesis in scramble BMSCs and Cry1-knockdown BMSCs. b The transcript levels of differentially expressed genes in (a) were determined by qPCR analysis in scramble BMSCs and Cry1-knockdown BMSCs. ce Immunofluorescence staining of BMP2 (Green), BMP6 (Green) and WNT5A (Red) in skull defect tissues of SD rats at 28 days with or without 810 nm NIR light irradiation, together with nuclei (blue). f, g At 2 weeks after the induction of osteogenic differentiation in BMSCs with or without 810 nm NIR light irradiation, the mRNA expressions of Wnt5a, Bmp2, and Bmp6 and the protein expressions of WNT5A, BMP2, BMP6 and GAPDH were analyzed by qPCR (f) and Western blot (g). h At 2 weeks after the induction of osteogenic differentiation in BMSCs with or without 810 nm NIR light irradiation, the protein expressions of SMAD1/5/9, p-SMAD1/5/9 and GAPDH were analyzed by Western blot (left). Densitometry quantification of p-SMAD1/5/9 compared to SMAD1/5/9 was represented (right). i qPCR analysis of the mRNA expressions of Osx and Runx2 in BMSCs treated with or without 810 nm NIR light for 14-day induction of osteogenic differentiation. j, k BMSCs were treated with or without KL001 (1 μg·mL−1) for 2 h before 810 nm light irradiation. The mRNA expressions (j) of Wnt5a, Bmp2, and Bmp6 were analyzed by qPCR, and the protein expressions (k) of WNT5A, BMP2, BMP6 and GAPDH were analyzed by Western blot. l qPCR analysis of the mRNA expressions of Osx and Runx2 in BMSCs treated with or without 810 nm NIR light and KL001 (1 μg·mL−1) for the indicated time. Data are presented as the mean ± SD. *P < 0.05, **P < 0.01, ***P < 0.001. Scale bar: 20 μm for (ce)
Fig. 4
Fig. 4
The 810 nm NIR light altered the expression of sodium channel Scn4a and potassium channels Kcna6 and Hcn1a. a Gene ontology enrichment analysis of the top 20 enriched GO terms in BMSCs with or without 810 nm NIR light irradiation. b Cluster analysis of differentially expressed genes associated with potassium and sodium channels in BMSCs with or without 810 nm NIR light irradiation. c The transcript levels of differentially expressed genes in (b) were determined by qPCR analysis in in BMSCs with or without 810 nm NIR light irradiation. d, e The concentrations of sodium (d) and potassium (e) ions in BMSCs were detected by flow cytometry before and after 810 nm NIR light irradiation (left), and the quantitative statistical analysis is represented (right). Data are presented as the mean ± SD. *P < 0.05, **P < 0.01, ***P < 0.001
Fig. 5
Fig. 5
The 810 nm light-induced change in sodium channel Scn4a was related to CRY1 reduction and osteogenesis. a BMSCs were treated with Ranolazine (30 μmol·L−1) for 2 h before 810 nm light irradiation. The concentrations of sodium ions in BMSCs were detected by flow cytometry (left), and the quantitative statistical analysis is represented (right). b After treated with Ranolazine (30 μmol·L−1) for 2 h, the mRNA expressions of Scn4a, Hcn1, and Kcna6 in BMSCs with or without 810 nm NIR light irradiation were determined by qPCR analysis. c-d BMSCs were treated with Ranolazine (30 μmol·L−1) for 2 h. The distribution (CRY1: green, DAPI: blue) (c) and the protein expression (d) of CRY1 in nucleus with or without 810 nm NIR light irradiation were detected by immunofluorescence staining and Western blot. e MC3T3-E1 cells were transfected with HA-Ub for 24 h and then treated with or without 810 nm NIR light. All groups were treated with Ranolazine (Ran) (30 μmol·L−1) for 2 h before 810 nm light irradiation. The ubiquitination level of CRY1 in the nucleus was detected using an anti-HA antibody. f BMSCs were treated with Ranolazine (30 μmol·L−1) for 2 h before 810 nm light irradiation. At 2 weeks after the induction of osteogenic differentiation in BMSCs with or without 810 nm NIR light irradiation, the protein expressions of WNT5A, BMP2, BMP6 and GAPDH were analyzed by Western blot. g Representative ALP staining images in 810 nm NIR irradiation BMSCs and no irradiation BMSCs treated with Ranolazine (30 μmol·L−1). h BMSCs were treated with Tolbutamide (40 μmol·L−1) for 2 h before 810 nm light irradiation. The concentrations of potassium in BMSCs were detected by flow cytometry(left), and the quantitative statistical analysis is represented (right). i BMSCs were treated with Tolbutamide (40 μmol·L−1) for 2 h. Immunofluorescence staining of CRY1 (green) in BMSCs with or without 810 nm NIR light irradiation, together with nuclei (blue) (left), and the quantitative analysis of nucleus/cytoplasm fluorescence ratio (right) were represented. j Representative ALP staining images in 810 nm NIR irradiation BMSCs and no irradiation BMSCs treated with Tolbutamide (40 μmol·L−1). Data are presented as the mean ± SD. ***P < 0.001, ****P < 0.000 1, ns = not significant. Scale bar: 50 μm for (c, i) and 100 μm for (g, j)
Fig. 6
Fig. 6
Schematic illustration of the mechanism by which the low-intensity NIR light promotes bone regeneration via CRY1

Similar articles

Cited by

References

    1. De Santis, R., Guarino, V. & Ambrosio, L. In Bone Repair Biomaterials (eds. Planell, J.A.et al.) 252–270 (Woodhead Publishing, 2009).
    1. Campana V, et al. Bone substitutes in orthopaedic surgery: from basic science to clinical practice. J. Mater. Sci. Mater. Med. 2014;25:2445–2461. - PMC - PubMed
    1. Sun H, et al. CD271 antibody-functionalized microspheres capable of selective recruitment of reparative endogenous stem cells for in situ bone regeneration. Biomaterials. 2022;280:121243. - PubMed
    1. Holt, B. D., Wright, Z. M., Arnold, A. M. & Sydlik, S. A. Graphene oxide as a scaffold for bone regeneration. Wiley Interdiscip. Rev. Nanomed. Nanobiotechnol.10.1002/wnan.1437 (2017). - PubMed
    1. Walmsley GG, et al. Nanotechnology in bone tissue engineering. Nanomed. Nanotechnol. Biol. Med. 2015;11:1253–1263. - PMC - PubMed

Publication types