. 2022 Nov 15;14(1):54.
doi: 10.1038/s41368-022-00204-1.

Metformin can mitigate skeletal dysplasia caused by Pck2 deficiency

Affiliations

Metformin can mitigate skeletal dysplasia caused by Pck2 deficiency

Zheng Li et al. Int J Oral Sci. .

Abstract

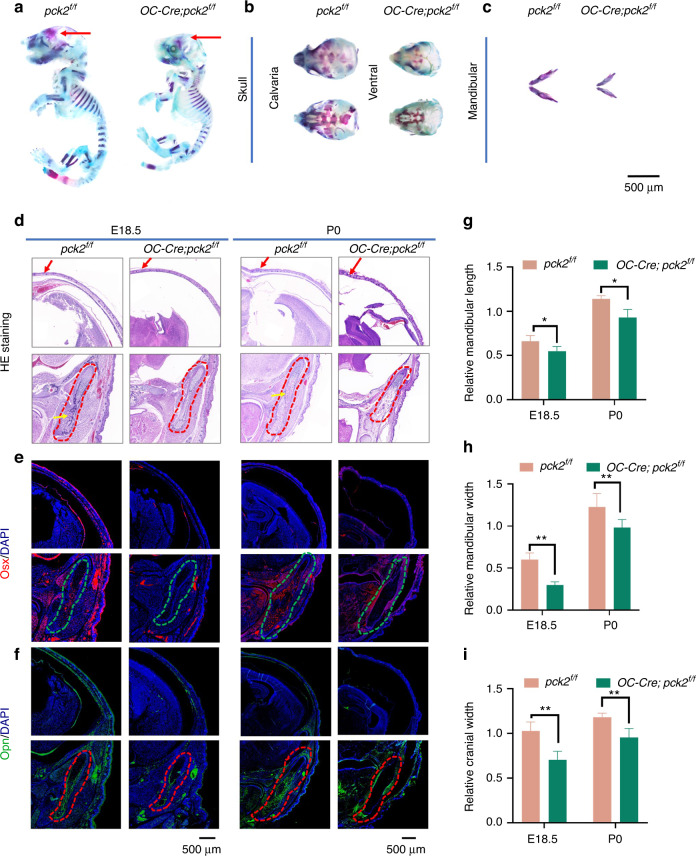
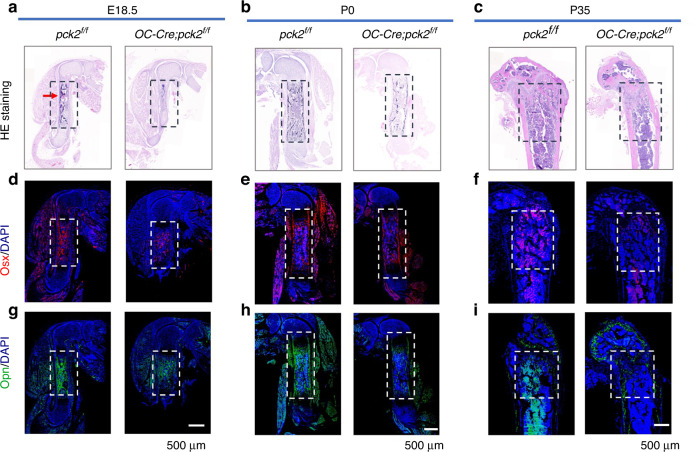
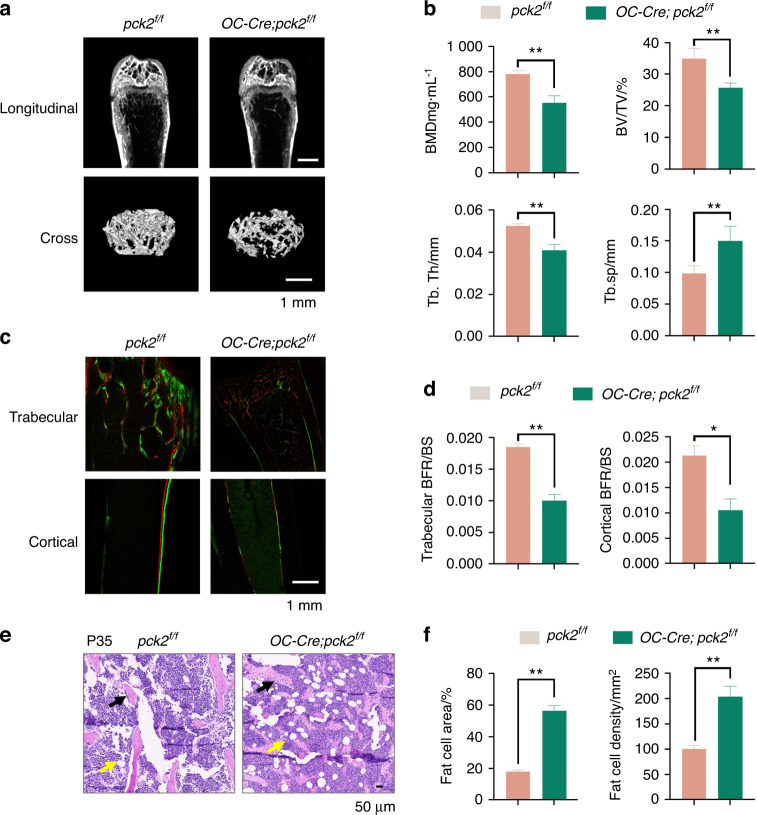
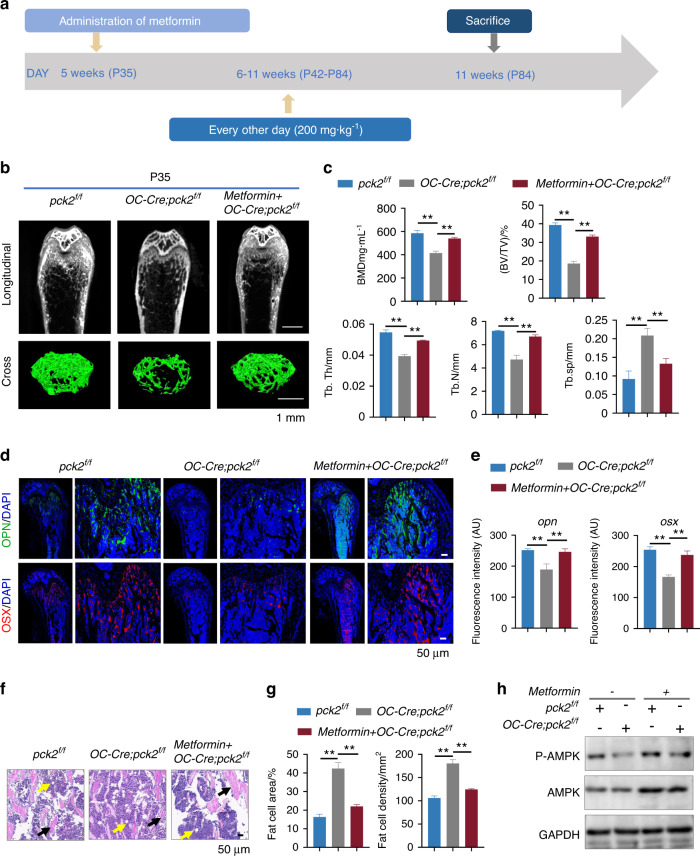
As an important enzyme for gluconeogenesis, mitochondrial phosphoenolpyruvate carboxykinase (PCK2) has further complex functions beyond regulation of glucose metabolism. Here, we report that conditional knockout of Pck2 in osteoblasts results in a pathological phenotype manifested as craniofacial malformation, long bone loss, and marrow adipocyte accumulation. Ablation of Pck2 alters the metabolic pathways of developing bone, particularly fatty acid metabolism. However, metformin treatment can mitigate skeletal dysplasia of embryonic and postnatal heterozygous knockout mice, at least partly via the AMPK signaling pathway. Collectively, these data illustrate that PCK2 is pivotal for bone development and metabolic homeostasis, and suggest that regulation of metformin-mediated signaling could provide a novel and practical strategy for treating metabolic skeletal dysfunction.


Conflict of interest statement

The authors declare no competing interests.

Figures

Fig. 1
Fig. 1
Pck2 is indispensable for craniofacial skeletal development. ac Whole-mount Alizarin red and Alcian blue staining of Pck2 KO and littermate control mice at E18.5, including skulls (b) and mandibles (c). Arrows (skull in a) indicate that the KO mice displayed less bone formation compared with the control mice. Scale bars: 500 μm. n = 3. df Images of HE staining (d), Osx IF staining (e), Opn IF staining (f) of the head sections from E18.5 embryos or P0 pups with indicated genotypes. Cranial bone width was indicated with arrows in d. Scale bars: 500 μm. n = 3. g–i Quantitative analysis of relative mandibular length (n = 3), relative mandibular width (n = 3), and relative cranial width (n = 3). **P < 0.01; *P < 0.05
Fig. 2
Fig. 2
Pck2 is necessary for long bone development. ac HE staining of the femur sections from E18.5 (a) or P0 (b) or P35 (c) with indicated genotypes. Scale bars: 500 μm. n = 3. Arrows in a indicated the micro-vessel-like structure in the femur of E18.5 Pck2f/f mice. di Representative images of Osx IF staining (df), Opn IF staining (gi) of the femur sections from E18.5 (d, g) or P0 (e, h) or P35 (f, i) with indicated genotypes. Scale bars: 500 μm. n = 3
Fig. 3
Fig. 3
Pck2 deficiency in osteoblasts caused decreased long bone mass and accumulated marrow adiposity. a Representative images of femur micro-CT from P35 mice with indicated genotypes. Scale bars, 1 mm, n ≥ 3. b Quantitative analysis of micro-CT scanning, including BMD, BV/TV%, Tb.Th, Tb.Sp. **P < 0.01, n ≥ 3. c Images of femur calcein-alizarin red S double labeling from P35 mice with indicated genotypes. d Analysis of trabecular and cortical bone formation rate (BFR). **P < 0.01, *P < 0.05, n = 3. e Images of adipose in the femur distal femur marrow in OC-Cre; Pck2f/f mice and Pck2f/f mice at P35. Black arrows present trabecular bones, and yellow arrows point to marrow adipose tissues. Scale bar, 50 μm, n = 3. f Quantification of adipocytes, including number and adipocyte area per tissue area in the femur distal marrow, which were analyzed with the ImageJ software. **P < 0.01, n = 3
Fig. 4
Fig. 4
Pck2 ablation in osteoblasts brought about changes in the metabolic profiles of developing long bones. a Scheme illustration of the process for isolating E18.5 and P0 pups for metabolic analysis, n = 3. b, c Volcano plot showing both the statistical significance (P value) and the magnitude of change (fold change) of differentially expressed metabolites in the KO and control mice at E18.5 and P0. d Heatmap analysis of representative differentially expressed metabolites between control and OC-Cre; Pck2f/f KO Samples. e, f Metabolite set enrichment overview in OC-Cre; Pck2f/f mice and Pck2f/f mice at E18.5 (e) and P0 (f). The P value was less than 0.05
Fig. 5
Fig. 5
Skeleton dysplasia in OC-Cre; Pck2f/f mice were mitigated by metformin treatment. a The timetable of metformin administration for pregnant mice of indicated phenotypes. be HE staining of the head sections from P0 (b, d), P5 (c, e) mice with indicated phenotypes. Cranial bone width was indicated with arrows in b, c. Scale bars: 500 µm. n = 3. f, g HE staining of the femur sections from P0 (f), P5 (g) mice with indicated phenotypes. Scale bars: 500 µm. n = 3. hj Quantitative analysis of relative mandibular length (n = 3), relative mandibular width (n = 3), and relative cranial width (n = 3). *P < 0.05, ns not significant
Fig. 6
Fig. 6
Metformin mitigated the bone loss of the OC-Cre; Pck2f/f mice. a Scheme of metformin administration plan. b Representative femur micro-CT images from P35 mice of indicated genotypes. Scale bars, 1 mm. n ≥ 3. c Quantification of micro-CT parameters in femur bones from P35 mice of indicated genotypes. **P < 0.01. n ≥ 3. d Representative IF staining images of Opn and Osx in the femur sections of P35 with indicated genotypes. Scale bars 50 μm. n ≥ 3. e Quantitative analysis of IF staining of Opn and Osx in the femur sections of P35 with indicated genotypes. **P < 0.01. n ≥ 3. f Representative adipocyte images of the distal femur marrow in OC-Cre; Pck2f/f mice and Pck2f/f mice at P35. Black arrows suggest trabecular bones, and yellow arrows mean marrow adipose tissues. Scale bar 50 μm, n = 3. g Quantification of adipocytes, including number and adipocyte area per tissue area in the femur distal marrow, which were analyzed with the ImageJ software. **P < 0.01, n = 3. h Western blotting analyses of p-AMPK and AMPK in the tissue lysates from the bone of P0 pups with indicated genotypes/treatments. The experiment was repeated twice (n = 2)

Similar articles

Cited by

References

    1. Shah HN, et al. Craniofacial and long bone development in the context of distraction osteogenesis. Plast. Reconstr. Surg. 2021;147:54e–65e. - PMC - PubMed
    1. Yadav, P. S. et al. Stat3 loss in mesenchymal progenitors causes Job syndrome-like skeletal defects by reducing Wnt/β-catenin signaling. Proc. Natl. Acad. Sci. USA118, e2020100118 (2021). - PMC - PubMed
    1. Zhou S, et al. STAT3 is critical for skeletal development and bone homeostasis by regulating osteogenesis. Nat. Commun. 2021;12:6891. - PMC - PubMed
    1. Kwon EK, et al. The role of Ellis-Van Creveld 2(EVC2) in mice during cranial bone development. Anat. Rec. (Hoboken) 2018;301:46–55. - PMC - PubMed
    1. Suzuki, A. et al. Role of metabolism in bone development and homeostasis. Int. J. Mol. Sci. 21, 8992 (2020). - PMC - PubMed

Publication types

MeSH terms

Substances

Supplementary concepts