. 2022 Nov 14;13(1):6754.
doi: 10.1038/s41467-022-34095-x.

Altered glycolysis triggers impaired mitochondrial metabolism and mTORC1 activation in diabetic β-cells

Affiliations

Altered glycolysis triggers impaired mitochondrial metabolism and mTORC1 activation in diabetic β-cells

Elizabeth Haythorne et al. Nat Commun. .

Abstract

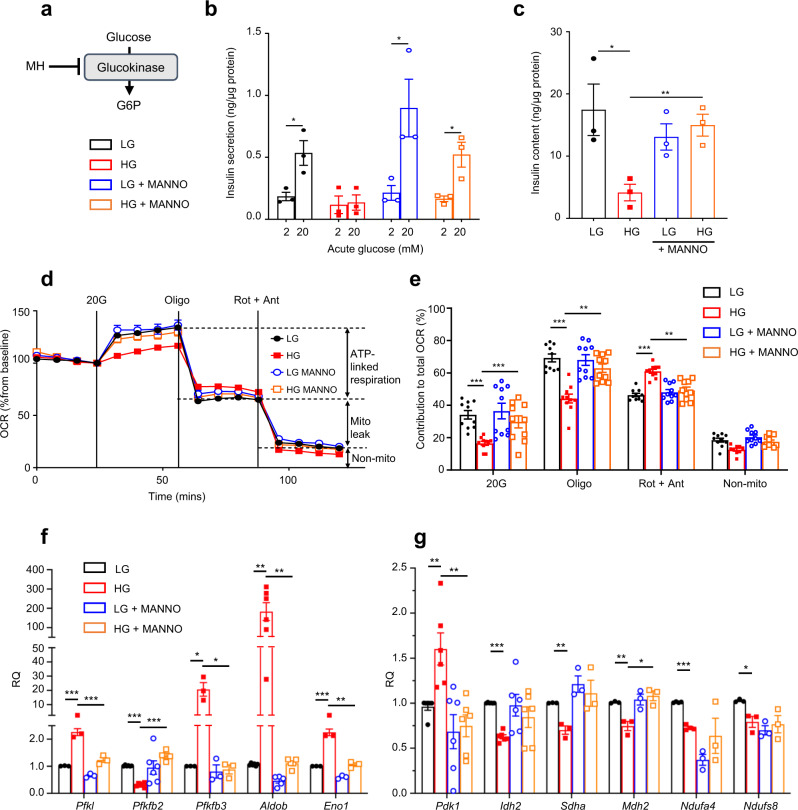
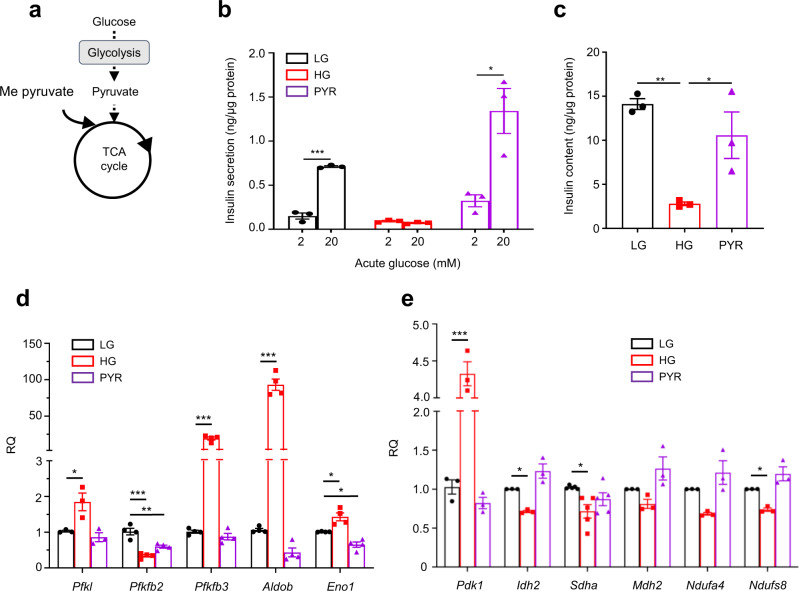
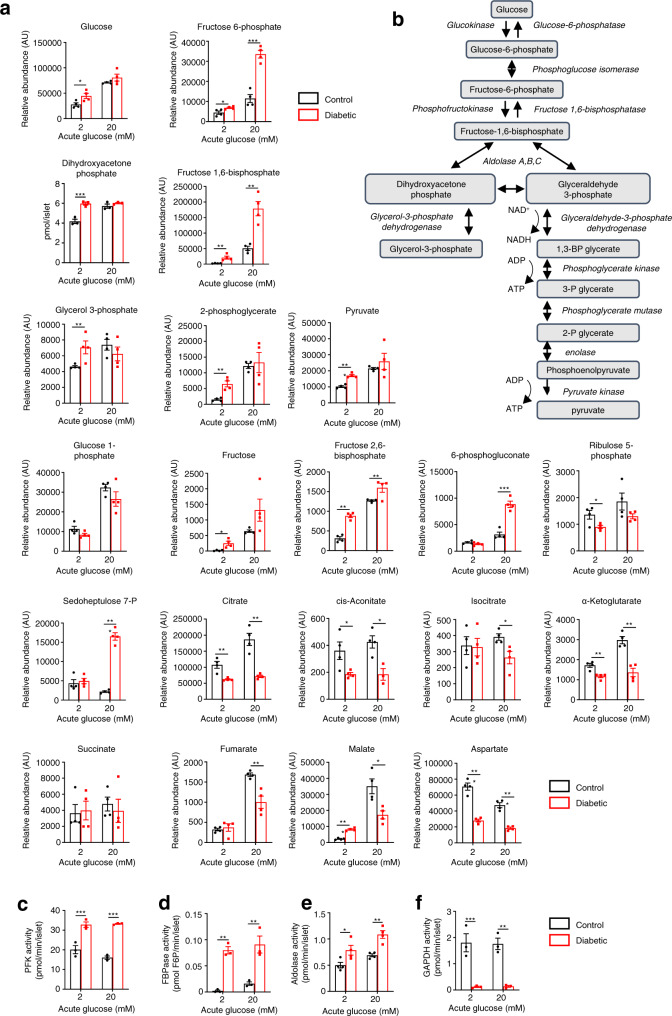
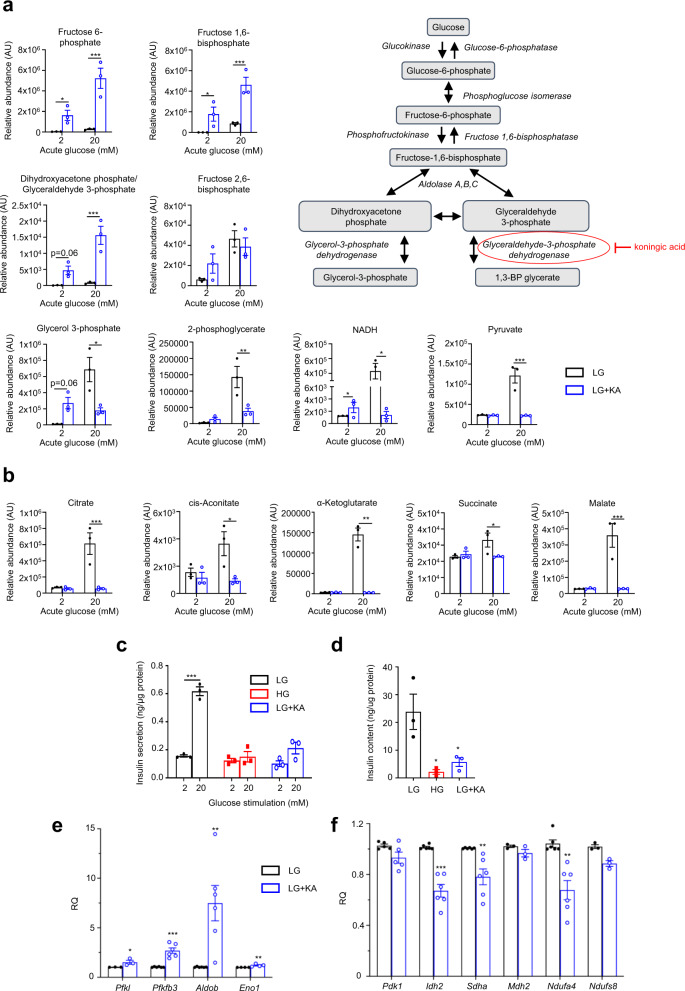
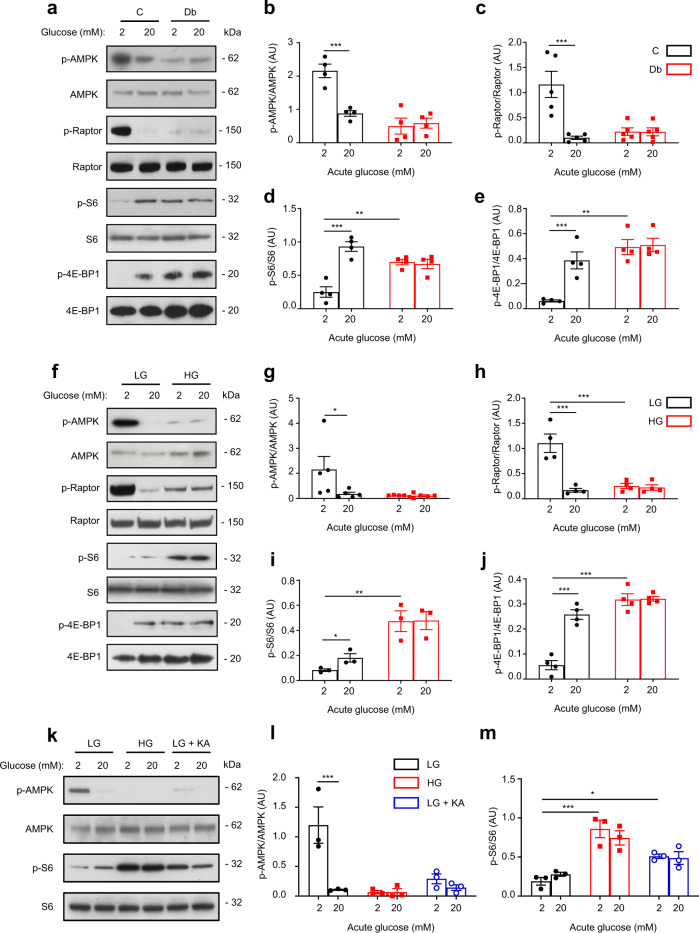
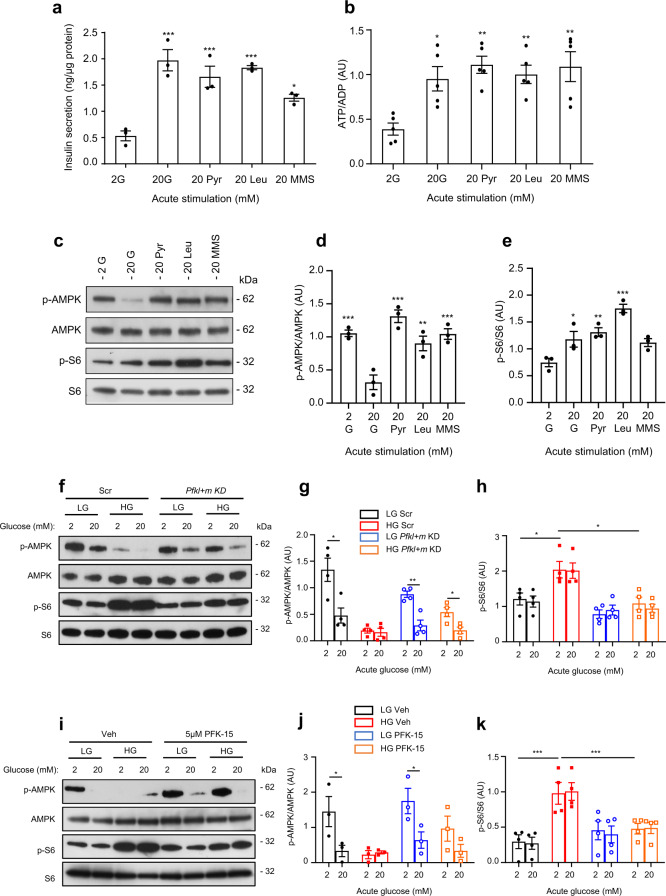
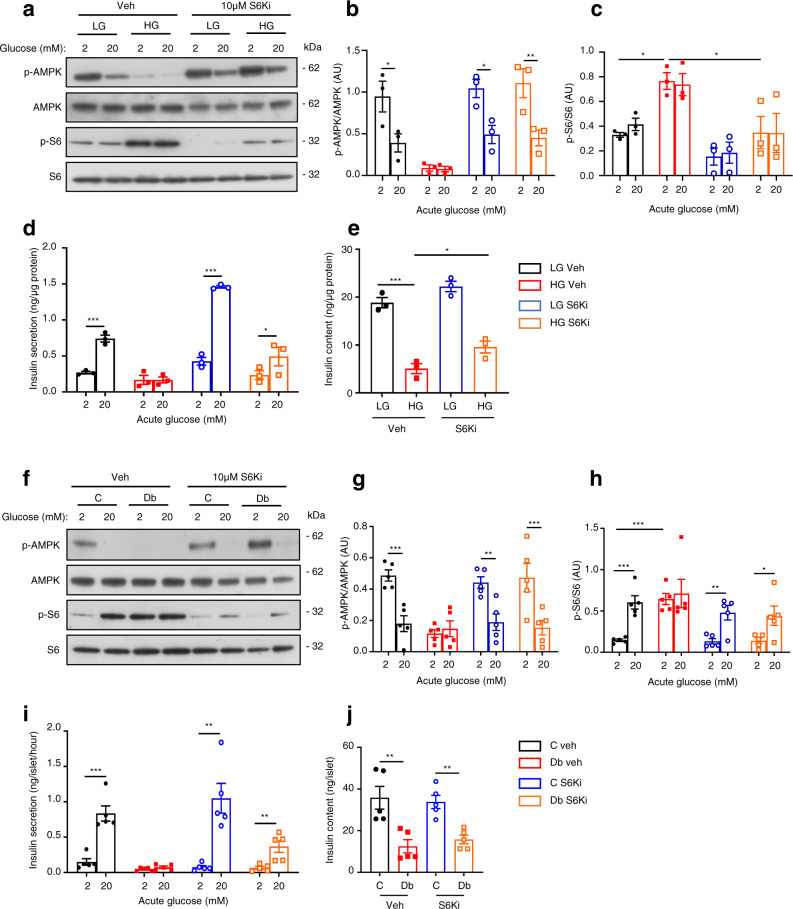
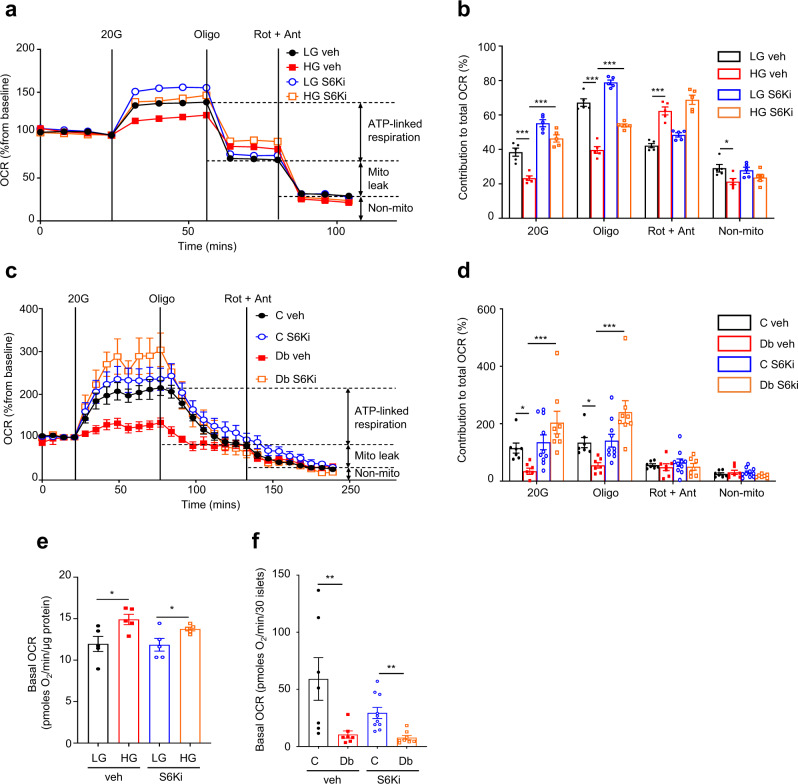
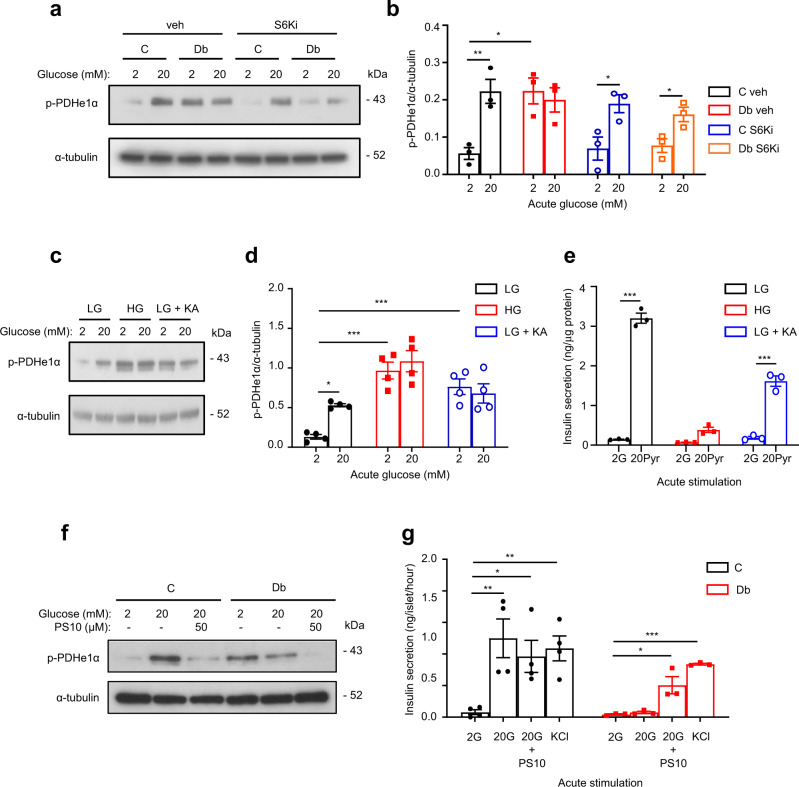
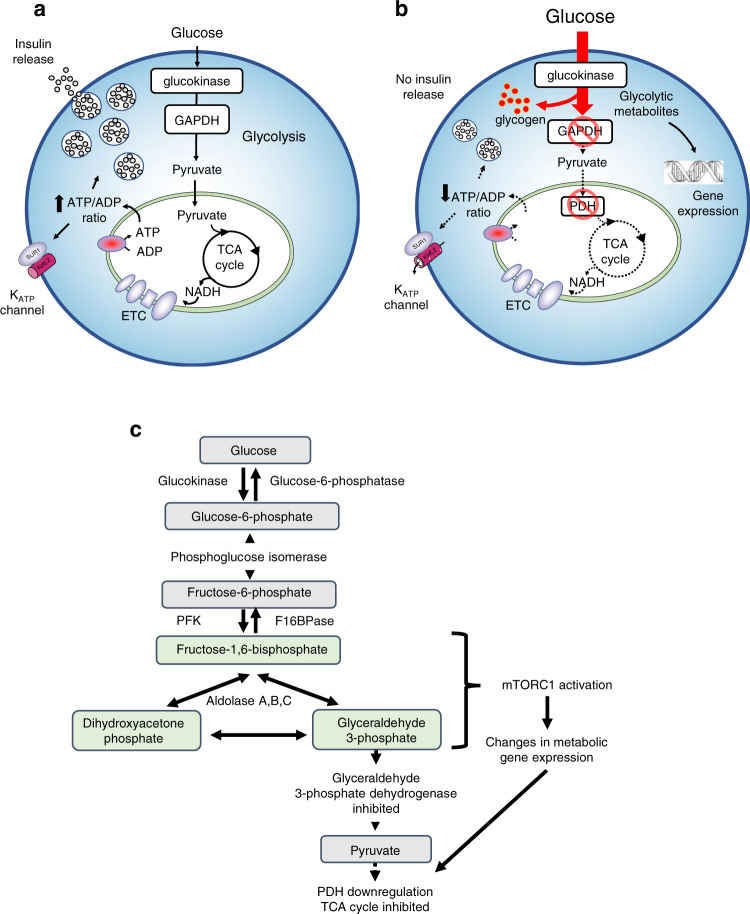
Chronic hyperglycaemia causes a dramatic decrease in mitochondrial metabolism and insulin content in pancreatic β-cells. This underlies the progressive decline in β-cell function in diabetes. However, the molecular mechanisms by which hyperglycaemia produces these effects remain unresolved. Using isolated islets and INS-1 cells, we show here that one or more glycolytic metabolites downstream of phosphofructokinase and upstream of GAPDH mediates the effects of chronic hyperglycemia. This metabolite stimulates marked upregulation of mTORC1 and concomitant downregulation of AMPK. Increased mTORC1 activity causes inhibition of pyruvate dehydrogenase which reduces pyruvate entry into the tricarboxylic acid cycle and partially accounts for the hyperglycaemia-induced reduction in oxidative phosphorylation and insulin secretion. In addition, hyperglycaemia (or diabetes) dramatically inhibits GAPDH activity, thereby impairing glucose metabolism. Our data also reveal that restricting glucose metabolism during hyperglycaemia prevents these changes and thus may be of therapeutic benefit. In summary, we have identified a pathway by which chronic hyperglycaemia reduces β-cell function.


Conflict of interest statement

The authors declare no competing interests.

Figures

Fig. 1
Fig. 1. Inhibition of glucokinase prevents the effects of chronic hyperglycaemia.
a Schematic showing how mannoheptulose (MH) inhibits glucose metabolism. b, c Insulin secretion (b) and insulin content (c) in LG-cells and HG-cells cultured for 48 h ± 10 mM mannoheptulose (MANNO) and then stimulated with 2 mM or 20 mM glucose. Mannoheptulose was omitted during the assay (n = 3 biologically independent experiments). d Oxygen-consumption rate (OCR) in LG-cells and HG-cells cultured for 48 h ± 10 mM MANNO. OCR was recorded at 2 mM glucose and after sequential addition of 20 mM glucose (20 G), 1 μM oligomycin (Oligo) and 0.5 μM rotenone + 0.5 μM antimycin A (Rot + Ant). Data are expressed as the percentage change from baseline (2 mM glucose); n = 10 biologically independent experiments per group. e Percentage change in OCR when glucose was raised from 2 to 20 mM (20 G), ATP-linked OCR (Oligo), OCR required to maintain the mitochondrial leak (Rot + Ant) and non-mitochondrial OCR (non-mito); n = 10 biologically independent experiments per group. Same data as in (d). f, g mRNA levels of the indicated genes involved in glycolytic (f) and mitochondrial (g) metabolism as assessed by qPCR in LG-cells and HG-cells cultured for 48 h ± 10 mM mannoheptulose (Pdk1, Idh2 and Ndufs8, n = 6 biologically independent experiments; Ndufa4, n = 4 biologically independent experiments; Pfkl, Pfkfb3, Eno1, Sdha and Mdh2, n = 3 biologically independent experiments; Aldob, n = 6 biologically independent experiments for LG and HG but n = 5 for LG + MANNO and HG + MANNO; Ndufs8, n = 6 biologically independent experiments for LG but n = 3 for LG + MANNO, HG and HG + MANNO). All panels show individual data points and mean ± s.e.m. *P < 0.05, **P < 0.01, ***P < 0.001; two-tailed unpaired Student’s t test. LG-cells (black), HG-cells (red), LG-cells + mannoheptulose (blue), HG-cells + mannoheptulose (orange). Source data are provided as a Source Data file.
Fig. 2
Fig. 2. Chronic effects of the mitochondrial substrate pyruvate on insulin secretion.
a Schematic showing where methyl pyruvate (Me-pyruvate) enters metabolism. b, c Insulin secretion (b) and insulin content (c) in LG- and HG-cells, or cells cultured with 20 mM methyl pyruvate for 48 h (PYR) (n = 3 biologically independent experiments). d, e mRNA levels for the indicated genes involved in glycolytic (d) and mitochondrial (e) metabolism assessed by qPCR in LG- and HG-cells, or cells cultured with 20 mM methyl pyruvate for 48 h (Pfkl, Pdk1, Idh2, Mdh2, Ndufa4 and Ndufs8, n = 3 biologically independent experiments; Pfkfb2, Pfkfb3, Aldob and Eno1, n = 4 biologically independent experiments; Sdha, n = 5 biologically independent experiments). All panels show individual data points and mean ± s.e.m. *P < 0.05, **P < 0.01, ***P < 0.001, two-tailed unpaired Student’s t test. LG-cells (black), HG-cells (red), PYR-cells (purple). Source data are provided as a Source Data file.
Fig. 3
Fig. 3. Changes in metabolite abundance induced by chronic hyperglycaemia.
a Abundances of selected glycolytic, pentose phosphate pathway and TCA cycle metabolites in control (black bars) and diabetic (red bars) islets stimulated with 2 mM or 20 mM glucose. (n = 4 animals/genotype). Metabolites were measured by mass spectrometry, except for DHAP which was measured with a fluorimetric assay. b Schematic of glycolysis. cf Activity of the indicated glycolytic enzymes in control (black) and diabetic (red) islets stimulated with 2 or 20 mM glucose. c Phosphofructokinase (PFK, n = 3 animals/genotype). d Fructose-1,6-bisphosphatase (FBPase, n = 3 animals/genotype). e Aldolase (n = 4 animals/genotype). f Glyceraldehyde-3-phosphate dehydrogenase (GAPDH, n = 3 animals/genotype). All panels show individual data points and mean ± s.e.m. *P < 0.05, **P < 0.01, ***P < 0.001, two-tailed unpaired Student’s t test. Source data are provided as a Source Data file, and relative abundances of all metabolites identified are provided as Supplementary Data file 1.
Fig. 4
Fig. 4. Inhibition of GAPDH induces changes similar to those caused by chronic hyperglycaemia.
a Schematic of glycolysis showing where Koningic acid acts. a, b Glycolytic (a) and TCA cycle (b) metabolite abundances in LG-cells cultured for 48 h without (black) or with (blue) 5 µM koningic acid (KA) and subsequently stimulated with 2 mM or 20 mM glucose in the absence of KA (n = 3 biologically independent experiments). c, d Insulin secretion (c) and insulin content (d) in HG-cells (red) and in LG-cells cultured in the absence (black) or presence (blue) of 5 µM KA for 48 h and then stimulated with 2 mM or 20 mM glucose in the absence of KA (n = 3 biologically independent experiments). e, f mRNA levels for the indicated glycolytic (e) and mitochondrial (f) genes assessed by qPCR in LG-cells cultured in the absence (black) or presence (blue) of 5 µM KA. Pfkl, Mdh2 and Ndufs8, n = 3 biologically independent experiments; Eno1, n = 4 biologically independent experiments; Pdk1, n = 5 biologically independent experiments; Pfkfb3, Pfkl, Aldob, Idh2, Sdha and Ndufa4, n = 6 biologically independent experiments. All panels show individual data points and mean ± s.e.m. *P < 0.05, **P < 0.01, ***P < 0.001, two-tailed unpaired Student’s t test. Source data are provided as a Source Data file.
Fig. 5
Fig. 5. Chronic hyperglycaemia decreases AMPK and increases mTORC1 signalling.
a Representative Western blot of lysates from control (C) and diabetic (Db) islets stimulated with 2 mM or 20 mM glucose for 1 h. Phosphorylated (p) and total AMPK, Raptor, S6 and 4E-BP1. Uncropped blots in Source data. be Quantitative densitometry analysis of p-AMPK/AMPK (b, n = 4, 12–15 animals/genotype), p-Raptor/Raptor (c, n = 5, 14–17 animals/genotype), p-S6/S6 (d, n = 4, 12–15 animals/genotype) and p-4E-BP1/4E-BP1 (e, n = 4, 12–15 animals/genotype). Control, black bars. Diabetic, red bars. f Representative Western blot of lysates from LG-cells and HG-cells stimulated with 2 mM or 20 mM glucose for 1 h. Phosphorylated (p) and total AMPK, Raptor, S6 and 4E-BP1. Uncropped blots in Source data. g–j Quantitative densitometry analysis of p-AMPK/AMPK (g, n = 5), p-Raptor/Raptor (h, n = 4 biologically independent experiments), p-S6/S6 (i, n = 3 biologically independent experiments) and p-4E-BP1/4E-BP1 (j, n = 4 biologically independent experiments). LG-cells, black bars. HG-cells, red bars. k Representative Western blot of lysates from LG-cells, HG-cells and LG-cells cultured for 48 h with 5 µM koningic acid (KA), and then stimulated with 2 or 20 mM glucose for 1 h. Phosphorylated (p) and total AMPK and S6. Uncropped blots in source data. l, m Quantitative densitometry analysis of p-AMPK/AMPK (l, n = 3 biologically independent experiments) and p-S6/S6 (m, n = 3 biologically independent experiments). LG-cells, black bars. HG-cells, red bars. LG-cells + KA, blue bars. All panels show individual data points plus mean ± s.e.m. *P < 0.05, **P < 0.01, ***P < 0.001, two-tailed unpaired Student’s t test. Source data are provided as a Source Data file.
Fig. 6
Fig. 6. Mitochondrial substrates elevate ATP and insulin secretion but do not suppress AMPK signalling.
a, b Insulin secretion (a, n = 3 biologically independent experiments) and ATP/ADP ratio (b, n = 5 biologically independent experiments) in LG-cells stimulated with 20 mM glucose (G), methyl pyruvate (Pyr), leucine (Leu) or monomethylsuccinate (MMS) for 1 h. c Representative Western blot of lysates from LG-cells acutely exposed to 2 mM glucose or 20 mM of the indicated mitochondrial substrates for 1 h. Uncropped blots in source data. d, e Quantitative densitometry analysis of p-AMPK/AMPK (d) and p-S6/S6 (e) in LG-cells stimulated with 20 mM glucose (G), methyl pyruvate (Pyr), leucine (leu) or monomethysuccinate (MMS) for 1 h (n = 3 biologically independent experiments). f Representative Western blot of lysates from cells transfected with scrambled siRNA (Scr) or Pfkl and Pfkm siRNA (Pfkl + m KD) and cultured at low (LG) or high (HG) glucose for 48 h. Cells were subsequently stimulated with 2 mM or 20 mM glucose for 1 h. Phosphorylated (p) and total AMPK and S6. Uncropped blots in source data. g, h Quantitative densitometry analysis of p-AMPK/AMPK (b, n = 4 biologically independent experiments) and p-S6/S6 (c, n = 4 biologically independent experiments). LG-cells (black), HG-cells (red), LG-cells with Pfkl+m KD (blue), HG-cells with Pfkl+m KD (orange). i Representative Western blot of lysates from LG- and HG-cells cultured for 48 h in the presence of 0.05% DMSO (veh) or 5 µM of the PFKFB3 inhibitor, PFK-15, and then stimulated with 2 mM or 20 mM glucose for 1 h. Phosphorylated (p) and total AMPK and S6. Uncropped blots in source data. j, k Quantitative densitometry analysis of p-AMPK/AMPK (b, n = 3 biologically independent experiments) and p-S6/S6 (c, n = 4 biologically independent experiments). LG-cells (black), HG-cells (red), LG-cells + PFK-15 (blue), HG-cells + PFK-15 (orange). Veh, vehicle (0.05% DMSO). Panels show individual data points and mean ± sem. *P < 0.05, **P < 0.01, ***P < 0.001. One-way ANOVA with Bonferroni post hoc test (a, b, d, e) and two-tailed unpaired Student’s t test (g, h, j, k). Source data are provided as a Source Data file.
Fig. 7
Fig. 7. S6-kinase inhibition partially reverses the effects of chronic hyperglycaemia.
a Representative Western blot of lysates from LG- and HG-cells cultured for 48 h ± 10 µM of the S6-kinase inhibitor PF-4708671 (S6Ki), and then stimulated with 2 mM or 20 mM glucose for 1 h in the absence of S6Ki. Phosphorylated (p) and total AMPK and S6. Uncropped blots in source data. b, c Quantitative densitometry analysis of p-AMPK/AMPK (b, n = 3 biologically independent experiments) and p-S6/S6 (c, n = 3 biologically independent experiments). LG-cells (black), HG-cells (red), LG-cells+S6Ki (blue), HG-cells+S6Ki (orange). d Insulin secretion and (e) insulin content from LG- and HG-cells cultured for 48 h ± 10 µM S6Ki and stimulated with 2 or 20 mM glucose for 30 min in the absence of S6Ki (n = 3 biologically independent experiments). f Representative Western blot of lysates from control (C) and diabetic (Db) islets incubated for 48 h ± 10 µM S6Ki and then stimulated with 2 mM or 20 mM glucose for 1 h in the absence of S6Ki. Phosphorylated (p) and total AMPK and S6. Uncropped blots in source data. g, h Quantitative densitometry analysis of p-AMPK/AMPK (g, n = 5, 13–16 animals/genotype) and p-S6/S6 (h, n = 5, 15–18 animals/genotype). Control islets (black), Diabetic islets (red), Control islets + S6Ki (blue), Diabetic islets + S6Ki (orange). i Insulin secretion and j insulin content from control and diabetic islets incubated for 48 h ± 10 µM S6Ki and then stimulated with 2 mM or 20 mM glucose for 1 h (n = 5 animals/genotype). All panels show individual data points and mean ± s.e.m. *P < 0.05, **P < 0.01, ***P < 0.001, two-tailed unpaired Student’s t test. Veh, vehicle (0.05% DMSO). Source data are provided as a Source Data file.
Fig. 8
Fig. 8. Inhibition of S6 kinase prevents the effects of chronic hyperglycaemia on oxidative metabolism.
a Oxygen-consumption rate (OCR) of LG- and HG-cells cultured for 48 h ± 10 µM S6-kinase inhibitor PF-4708671 (S6Ki). OCR is expressed as the percentage change from the OCR baseline (2 mM glucose) following sequential addition of 20 mM glucose (20 G), 1 μM oligomycin (Oligo) and 0.5 μM rotenone + 0.5 μM antimycin A (Rot + Ant) (n = 5 biologically independent experiments per group). LG-cells (black), HG-cells (red), LG-cells+S6Ki (blue), HG-cells+S6Ki (orange). b Percentage change in OCR when glucose was raised from 2 mM to 20 mM (20 G, n = 5 replicates/group), ATP-linked OCR (Oligo), OCR required to maintain the mitochondrial leak (Rot + Ant) and non-mitochondrial OCR (non-mito) (n = 5 replicates/group). Same data as in (a). c OCR in control and diabetic islets cultured for 48 h ± 10 µM S6Ki. OCR is expressed as the percentage change from the OCR baseline (2 mM glucose) and after sequential addition of 20 mM glucose (20 G), 5 μM oligomycin (Oligo) and 5 μM rotenone + 5 µM antimycin A (Rot + Ant). Control islets (black, n = 7 mice examined over seven independent experiments), Diabetic islets (red, n = 7 animals examined over seven independent experiments), Control islets + S6Ki (blue, n = 7 mice examined over ten independent experiments), Diabetic islets + S6Ki (orange, n = 7 mice examined over 8 independent experiments). d Percentage change in OCR of control and diabetic islets when glucose was raised from 2 mM to 20 mM (20 G), ATP-linked OCR (Oligo), OCR required to maintain the mitochondrial leak (Rot + Ant) and non-mitochondrial OCR (non-mito). Same data as in (c). e Basal OCR at 2 mM glucose in LG- and HG-cells cultured for 48 h ± 10 µM S6Ki (n = 5 biologically independent experiments per group). f Basal OCR at 2 mM glucose in control and diabetic islets cultured for 48 h ± 10 µM S6Ki Control islets (black, n = 7 mice examined over seven independent experiments), Diabetic islets (red, n = 7 animals examined over seven independent experiments), Control islets + S6Ki (blue, n = 7 mice examined over ten independent experiments), Diabetic islets + S6Ki (orange, n = 7 mice examined over 8 independent experiments). All panels show individual data points and mean ± sem. *P < 0.05, **P < 0.01, ***P < 0.001. ± s.e.m. two-tailed unpaired Student’s t test. Veh, vehicle (0.05% DMSO). Source data are provided as a Source Data file.
Fig. 9
Fig. 9. Effects of chronic hyperglycaemia, koningic acid and PS10 on PDH signalling.
a Representative Western blot of lysates from control (C) and diabetic islets (Db) cultured in the presence or absence of 10 µM S6-kinase inhibitor PF-4708671 (S6Ki) and then stimulated with 2 mM or 20 mM glucose for 1 h. Phosphorylated (p) PDHe1α. Loading control, α-tubulin. Uncropped blots in source data. b Quantitative densitometry analysis of p-PDHe1α/ α-tubulin (n = 3, 11 animals/genotype). Control islets (black), Diabetic islets (red), Control islets + S6Ki (blue), Diabetic islets + S6Ki (orange). Veh, vehicle (0.05% DMSO). c Representative Western blot of lysates from LG-cells, HG-cells and LG-cells cultured for 48 h with 5 µM koningic acid (KA), then stimulated with 2 mM or 20 mM glucose for 1 h. Phosphorylated (p) PDHe1α. Loading control, α-tubulin. Uncropped blots in source data. d Quantitative densitometry analysis of p-PDHe1α/α-tubulin (n = 4 biologically independent experiments). LG-cells (black), HG-cells (red), LG-cells+KA (blue). e Insulin secretion from HG-cells, and LG-cells cultured with or without 5 µM koningic acid (KA) for 48 h and subsequently stimulated acutely with 2 mM glucose (G) or 20 mM methyl pyruvate (Pyr) for 30 min (n = 3 biologically independent experiments). f Representative Western blot of lysates from control (C) and diabetic (Db) islets stimulated with 2 mM or 20 mM glucose ± 50 µM of the PDK inhibitor PS10 for 1 h. Uncropped blots in source data. g Insulin secretion from control and diabetic islets stimulated with 2 mM or 20 mM glucose (G), 20 mM glucose + 50 µM PS10, or 20 mM KCl for 1 h. Control islets (black, n = 4 animals), Diabetic islets (red, n = 4 animals). All panels show individual data points and mean ± s.e.m. *P <  0.05, **P < 0.01, ***P < 0.001, two-tailed unpaired Student’s t test. Source data are provided as a Source Data file.
Fig. 10
Fig. 10. Effects of chronic hyperglycaemia on β-cell metabolism.
a, b Cartoons illustrating metabolism in normoglycaemic/non-diabetic (a) and chronic hyperglycaemic/diabetic (b) conditions. a In non-diabetic cells glucose is metabolised via glycolysis and oxidative phosphorylation to produce an increase in the ATP/ADP ratio which closes KATP channels and initiates electrical activity, calcium influx and insulin secretion. b In diabetic β-cells glucose uptake is markedly increased due to the elevated extracellular glucose concentration. However, the activity of GAPDH and PDH are inhibited leading to the accumulation of metabolites upstream of GAPDH which cause changes in gene expression that downregulate PDH and GAPDH activity further. Because metabolism is reduced, glucose-dependent changes in the ATP/ADP ratio, KATP channel activity and insulin secretion are impaired. The enhanced activity of glucokinase also leads to a build-up of G6P which is channelled into glycogen. c Schematic of glycolysis showing the metabolic steps (highlighted) implicated in mTORC1 activation and consequent changes in metabolic gene expression. Metabolic steps that are inhibited are also indicated.

References

    1. UK Prospective Diabetes Study Group. UK Prospective Diabetes Study 16: overview of 6 years’ therapy of type II diabetes: a progressive disease. Diabetes44, 1249–1258 (1995). - PubMed
    1. Brereton, M. F. et al. Reversible changes in pancreatic islet structure and function produced by elevated blood glucose. Nat. Commun.5, 4639 (2014). - PMC - PubMed
    1. Marselli, L. et al. Are we overestimating the loss of beta cells in type 2 diabetes? Diabetologia57, 362–365 (2014). - PubMed
    1. Cinti, F. et al. Evidence of β-cell dedifferentiation in human type 2 diabetes. J. Clin. Endocrinol. Metab.101, 1044–1054 (2016). - PMC - PubMed
    1. Haythorne, E. et al. Diabetes causes marked inhibition of mitochondrial metabolism in pancreatic β-cells. Nat. Commun.10, 2474 (2019). - PMC - PubMed

Publication types

MeSH terms