. 2022 Nov 14;13(1):6942.
doi: 10.1038/s41467-022-34574-1.

Conformational motions and ligand-binding underlying gating and regulation in IP3R channel

Affiliations

Conformational motions and ligand-binding underlying gating and regulation in IP3R channel

Guizhen Fan et al. Nat Commun. .

Abstract

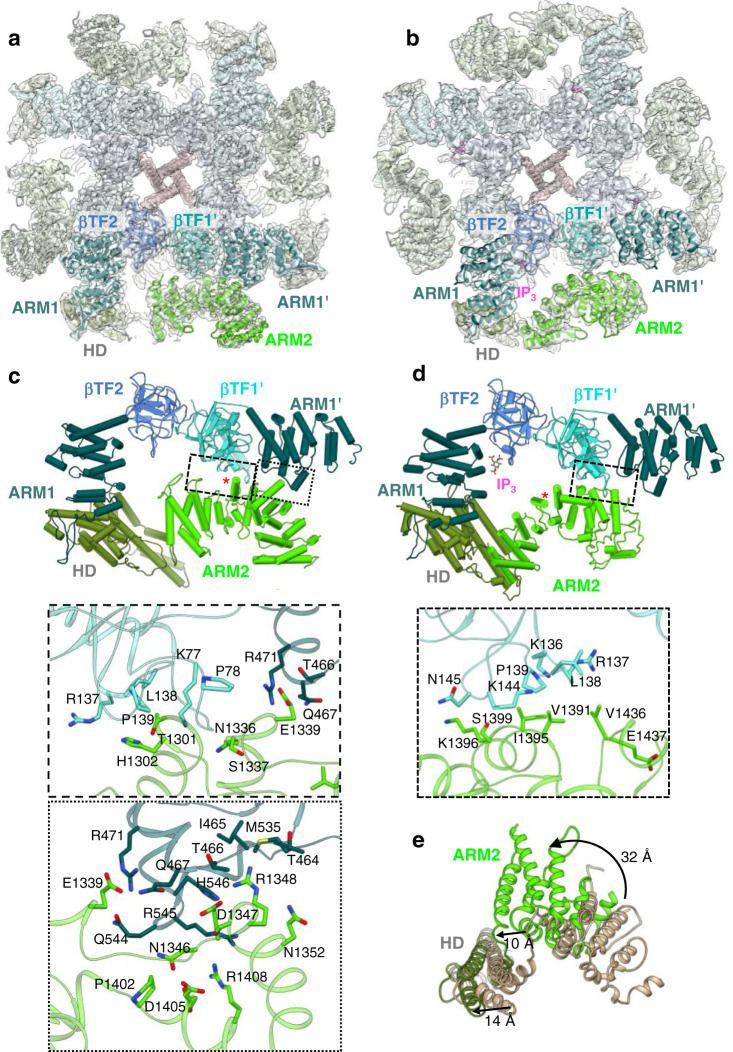
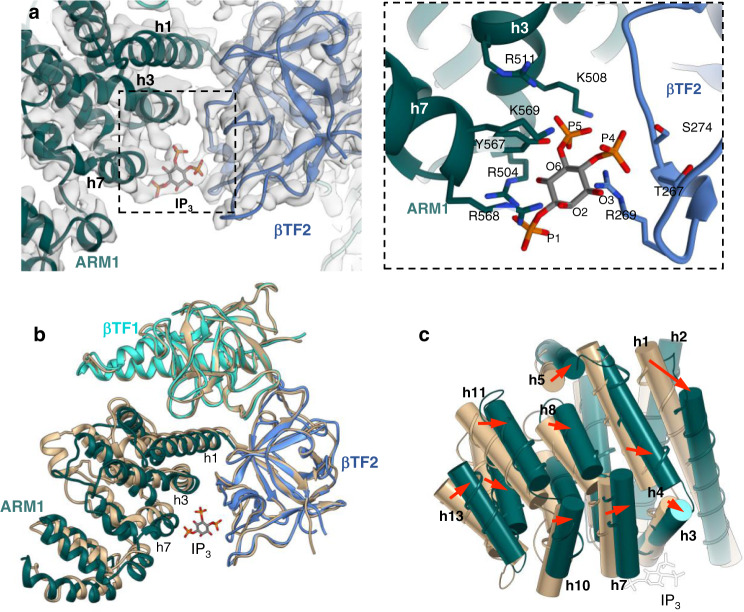
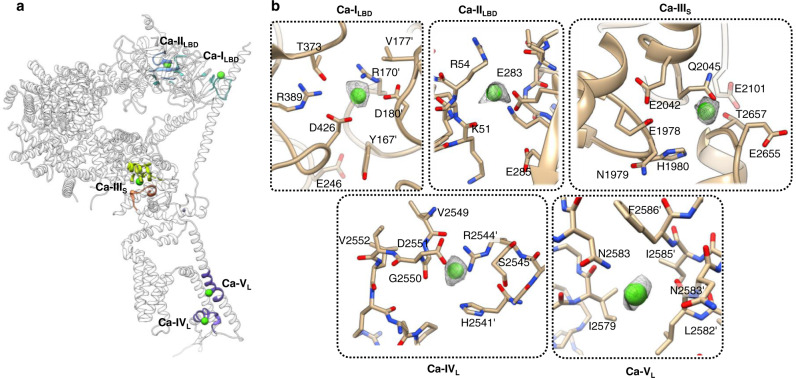
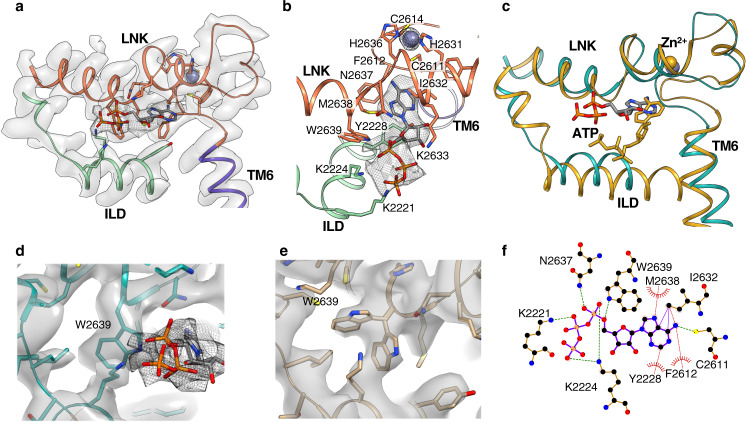
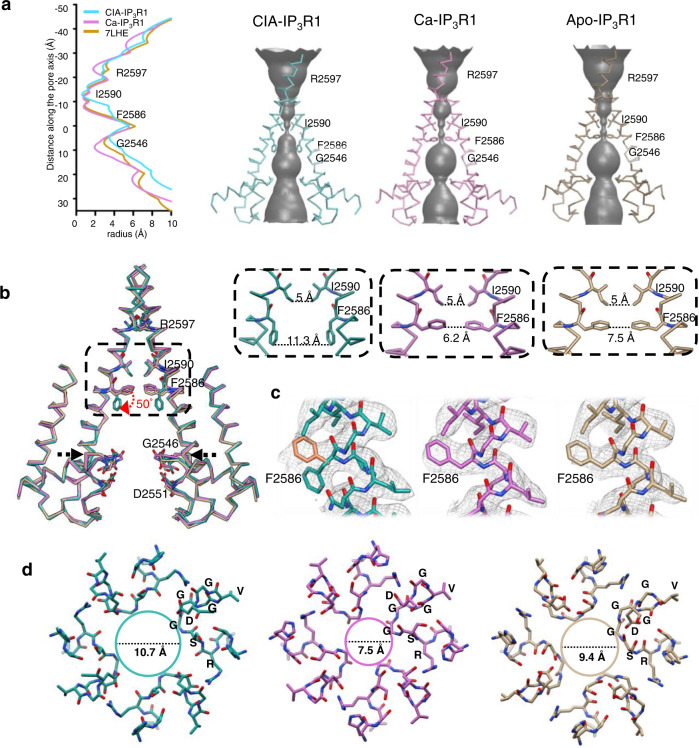
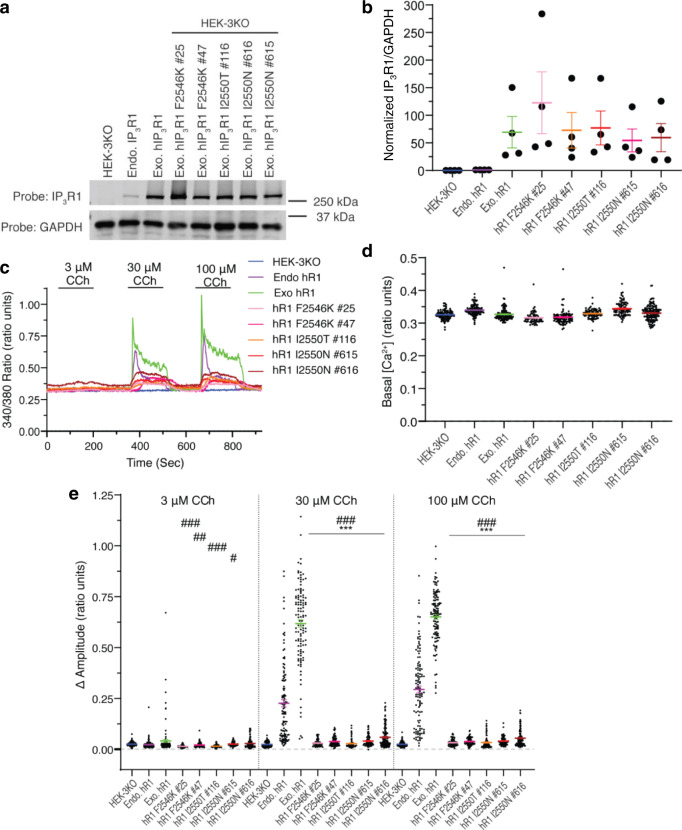
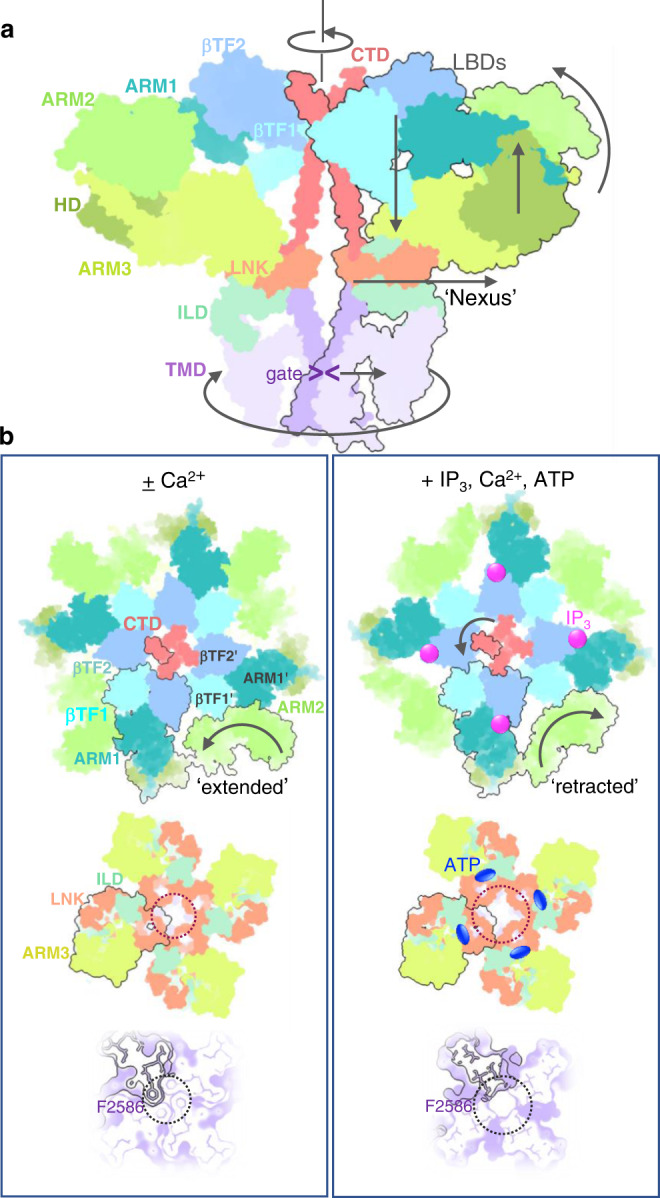
Inositol-1,4,5-trisphosphate receptors (IP3Rs) are activated by IP3 and Ca2+ and their gating is regulated by various intracellular messengers that finely tune the channel activity. Here, using single particle cryo-EM analysis we determined 3D structures of the nanodisc-reconstituted IP3R1 channel in two ligand-bound states. These structures provide unprecedented details governing binding of IP3, Ca2+ and ATP, revealing conformational changes that couple ligand-binding to channel opening. Using a deep-learning approach and 3D variability analysis we extracted molecular motions of the key protein domains from cryo-EM density data. We find that IP3 binding relies upon intrinsic flexibility of the ARM2 domain in the tetrameric channel. Our results highlight a key role of dynamic side chains in regulating gating behavior of IP3R channels. This work represents a stepping-stone to developing mechanistic understanding of conformational pathways underlying ligand-binding, activation and regulation of the channel.


Conflict of interest statement

The authors declare no competing interests.

Figures

Fig. 1
Fig. 1. Interactions between the ARM2 and LBDs in ligand-bound IP3R1 structures.
a, b Cryo-EM density maps and corresponding models of Ca2+ bound IP3R1 (a) and Ca2+/IP3/ATP bound IP3R1 (b) are viewed along central four-fold axis from the cytosol. Domains involved in inter-subunit interactions are color coded and labeled. Bound IP3 density is colored magenta. The neighboring subunit is indicated by a single quote symbol. c, d Molecular models for ligand-binding and interfacial domains are rendered as pipes and planks for Ca-IP3R1 (c) and CIA-IP3R1 (d). ARM2 inter-subunit interfaces are indicated by boxes and enlarged in the lower panels. Zoomed in boxed areas depict the amino acids present at the molecular interfaces. The red asterisk marks the same helix in each structure. e HD and ARM2 domains from an aligned subunit from Ca-IP3R1 (tan) and CIA-IP3R1 (colored by domain) are superimposed. Arrows indicate 32 Å rotation of ARM2 and a 10 Å translation of HD.
Fig. 2
Fig. 2. IP3 induced conformational changes in the ligand binding pocket.
a The IP3 molecule is fitted to the density bridging βTF2 and ARM1 domains in the CIA-IP3R1 cryo-EM map overlaid with the corresponding molecular model (left panel). Zoomed-in view of the IP3 binding pocket structure with coordinating side-chain residues indicated (right panel). b Alignment of CIA-IP3R1 and Ca-IP3R1 models at the βTF1 domain shows the closure of the IP3 binding pocket and nearly identical βTF1 and βTF2 backbone structures. c ARM1 helices in CIA-IP3R1 are shifted toward the occupied ligand binding pocket. ARM1 domains (CIA-IP3R1 colored green; Ca-IP3R1 colored tan) are shown as thin ribbons overlaid with helices rendered as cylinders and numbered sequentially within the domain. The IP3 molecule is white.
Fig. 3
Fig. 3. Ca2+ binding sites in Ca-IP3R1.
a Overall topology of Ca2+ binding sites is shown for a single subunit of IP3R1 (white ribbon) with the region surrounding the Ca2+ binding site highlighted in the corresponding domain color: Ca-ILBD and Ca-IILBD sites in the ligand binding domains (blue/turquoise); Ca-IIIs site in the Ca2+ sensor region located within the ARM3 domain (lime green/orange); Ca-IVL and Ca-VL sites in luminal vestibule of the TMD (purple). b Zoomed-in views of the Ca2+ binding sites. Ca2+ ions are shown as green spheres and overlaid with corresponding densities displayed at 2-5 σ cutoff values. Residues within 5 Å of the Ca2+ ions are displayed in a stick representation and labeled.
Fig. 4
Fig. 4. Structural determinants in the ATP binding pocket.
a Cryo-EM densities (transparent gray) are overlaid with a generated model of the ATP binding site identified in the CIA-IP3R1 structure; the model is colored by domains. The ATP molecule fits to the additional density (gray mesh) observed between the ILD and LNK domains, colored blue-green and orange respectively. b Zoomed-in view of the ATP binding pocket with the ATP densities shown in gray mesh; side chain residues within 5 Å of the ATP molecule are displayed. A zinc ion (overlaid with densities at ~15σ) is located within the C2H2-like Zn2+ finger domain adjacent to the ATP binding pocket. c Conserved 3D architecture of the ATP binding pocket in CIA-IP3R1 (blue-green) and RyR1 (gold; PBD ID: 5TAP); structures are shown as thin ribbon models and ATP molecule shown in sticks. ATP within the RyR1 binding pocket is angled 40° toward the membrane plane with respect to the bound ATP in CIA-IP3R1. d, e Zoomed-in view of cryoEM density maps for CIA-IP3R1 (d) and Ca-IP3R1 (e) overlaid with their respective molecular models; cryo-EM densities corresponding two alternative side chain conformers for W2639 are clearly resolved in Ca-IP3R1 structure. ATP molecule is fit to the mesh density in ‘d’. f Schematic plot of the ATP molecule interacting with surrounding side chains in CIA-IP3R1 structure. Arcs represent hydrophobic interactions, green dashed lines are H-bonds as calculated in LigPlot+.
Fig. 5
Fig. 5. Ion conduction pathway in IP3R1 upon ligand binding.
a Solvent-accessible pathways in CIA-IP3R1, Ca-IP3R1 and apo-IP3R1. The left panel plots the pore dimensions along the ion conduction pathway and the right panels reveal the solvent accessible volume. b The ion conduction pathways in CIA-IP3R1 (blue-green), Ca-IP3R1 (pink), apo-IP3R1 (PDB ID: 7LHE, tan) are aligned and overlaid. The backbone structures for two opposing subunits with several solvent lining side chains are shown and labeled. Red arrow indicates the change in side chain position of F2586 observed in CIA-IP3R1. Upper right panels show zoomed in views of the area indicated by the box in the left panel. Distances across the ion conduction pathway at I2590 and F2586 are measured from side-chain atoms from two opposite subunits. c Cryo-EM densities overlaid with atomic models for the TM6 gate residue F2586. Two rotamers of F2586 (orange and blue-green) are shown for CIA-IP3R1. Densities in Ca-IP3R1 and apo-IP3R1 permit only one rotamer fit for F2586. d Luminal view of the selectivity filter (2544-RSGGGVGD−2551) for CIA-IP3R1, Ca-IP3R1, and apo-IP3R1 at the region indicated by black arrows in ‘b’ and colored respectively. Distance across the SF is measured between the G2546 Cα atoms from two opposite subunits.
Fig. 6
Fig. 6. Functional validation of gating residues in ion conduction pathway.
a Immunoblots of lysates prepared from the indicated HEK cell lines. HEK-3KO and endogenous hIP3R1 (Endo. hIP3R1) were generated by CRISPR/Cas 9 technology, the former is null for all IP3R subtypes while the latter expresses only IP3R1. Mutations and exogenously expressed IP3R1 (Exo. hR1) were stably expressed in HEK-3KO cells. All stable clonal cell lines result in expression levels above that of Endo. hIP3R1, as quantified in b. Data are presented as mean values + /- SEM (n = 4 independent experiments). HEK cell lines are color coded: blue—HEK-3KO, purple—endo hIP3R1, green—exo hIP3R1, pink—hIP3R1 F2546K #25, magenta—hIP3R1 F2546K #47, orange—hIP3R1 F2550T #116, red—hIP3R1 F2550N #615. brown—hIP3R1 F2550N #616. c Representative single cell Ca2+ traces in fura-2 loaded HEK cell lines stimulated with increasing concentrations of the muscarinic agonist carbachol (CCh). d Basal fluorescence, prior to stimulation in HEK cell lines. e Pooled data depicting the response of cell lines to CCh stimulation. Data in d-e are presented as mean values + /- SEM (n = at least 60 cells over three independent experiments). *significantly different from Endo. hIP3R1. #significantly different from Exo. hIP3R1. For 3 µM CCh: ###p < 0.0001; ##p = 0.0007, #p = 0.0395; for 30 µM CCh and 100 µM CCh: ###***p < 0.0001 One-way ANOVA with Tukey’s post-hoc test. Source data are provided as Source Data file.
Fig. 7
Fig. 7. Schematics of ligand-induced structural changes underlying activation of IP3R1 channel.
a A conformational wave generated upon binding of the activating ligands propagates from the LBDs forming the apical portion of the channel via the ILD/LNK assembly (‘nexus’) towards the channel pore. Depicted are two opposing subunits colored by domains. Domain motions are indicated with arrows. b Conformational changes underlying binding of IP3, Ca2+ and ATP. Intrinsic flexibility of ARM2 domain allows for a reversible ratcheting mechanism where ARM2 switches between ‘extended’ and ‘retracted’ conformations. The extended conformation is restrictive for binding of IP3 (top left), while ‘extended’ conformation is suitable for capturing IP3 due to release of structural constraints at interfaces between ARM2 and βTF1' and ARM1' from the neighboring subunit (top right). Allosteric nexus comprising LNK and ILD domains (middle panels) and the channel pore at F2586 (bottom panels) are expanded in the presence of activating ligands. The domains in Ca-IP3R1 (left column) and CIA-IP3R1 (right column) structures are viewed along the central 4-fold axis from the cytosol with one subunit outlined in black.

References

    1. Bezprozvanny, I. Inositol 1,4,5-Tripshosphate Receptor, Calcium Signalling and Huntington’s Disease Vol. 45 (Springer, 2007). - PubMed
    1. Foskett JK. Inositol trisphosphate receptor Ca2+ release channels in neurological diseases. Pflug. Arch. 2010;460:481–494. - PMC - PubMed
    1. Hisatsune C, Mikoshiba K. IP3 receptor mutations and brain diseases in human and rodents. J. Neurochem. 2017;141:790–807. - PubMed
    1. Prole, D. L. & Taylor, C. W. Inositol 1,4,5-trisphosphate receptors and their protein partners as signalling hubs. J Physiol.594, 2849–2866 (2016). - PMC - PubMed
    1. Alzayady KJ, et al. Defining the stoichiometry of inositol 1,4,5-trisphosphate binding required to initiate Ca2+ release. Sci. Signal. 2016;9:ra35. - PMC - PubMed

Publication types

MeSH terms