. 2022 Nov 14;13(1):6951.
doi: 10.1038/s41467-022-34346-x.

Promoting anti-tumor immunity by targeting TMUB1 to modulate PD-L1 polyubiquitination and glycosylation

Affiliations

Promoting anti-tumor immunity by targeting TMUB1 to modulate PD-L1 polyubiquitination and glycosylation

Chengyu Shi et al. Nat Commun. .

Erratum in

Abstract

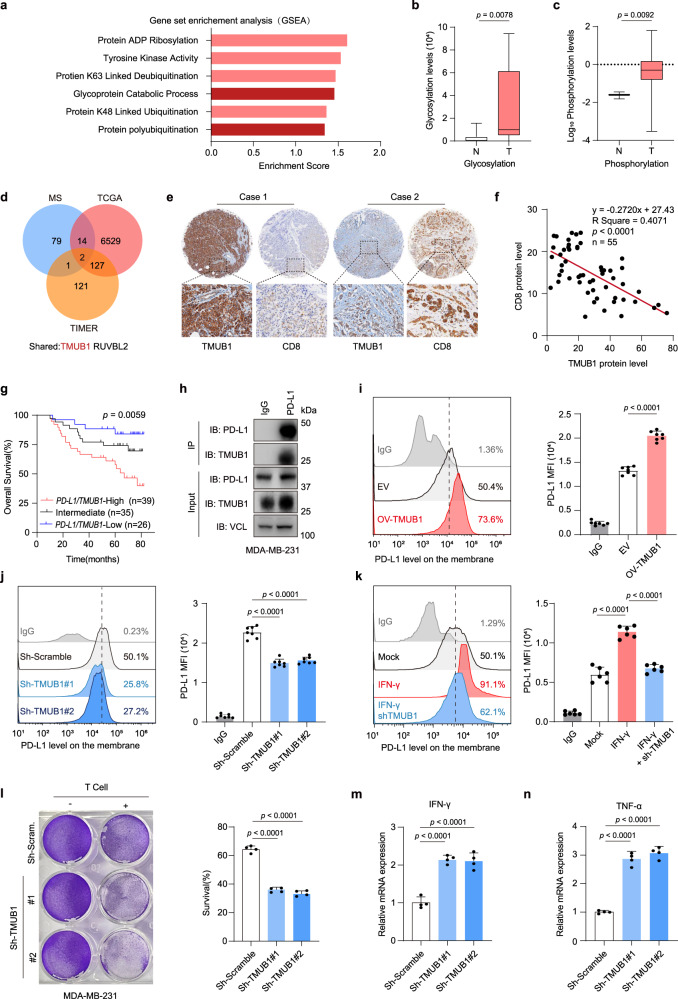
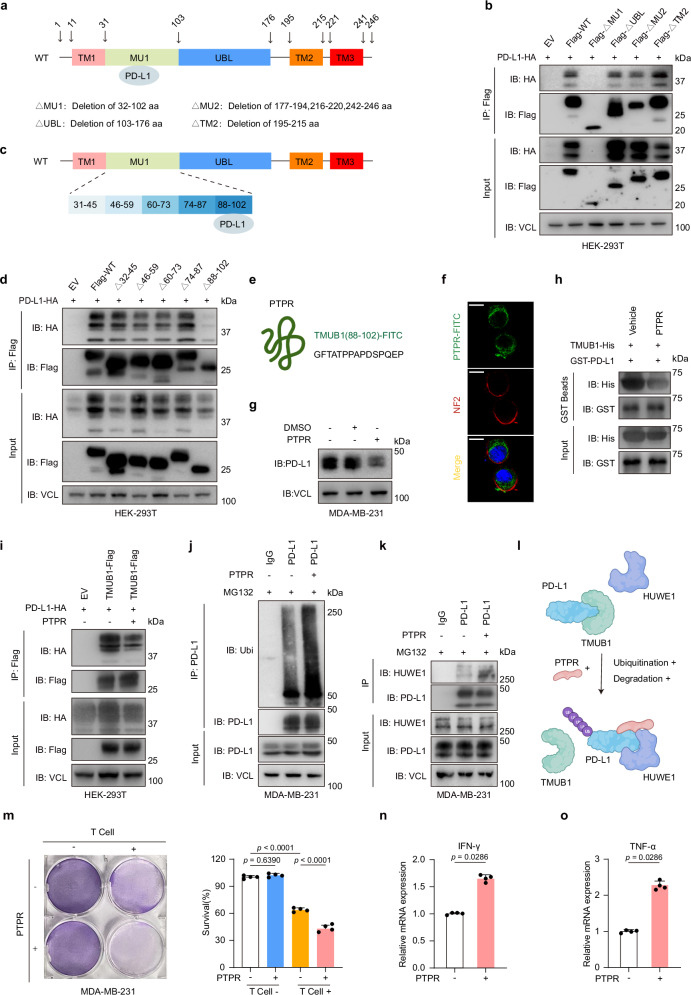
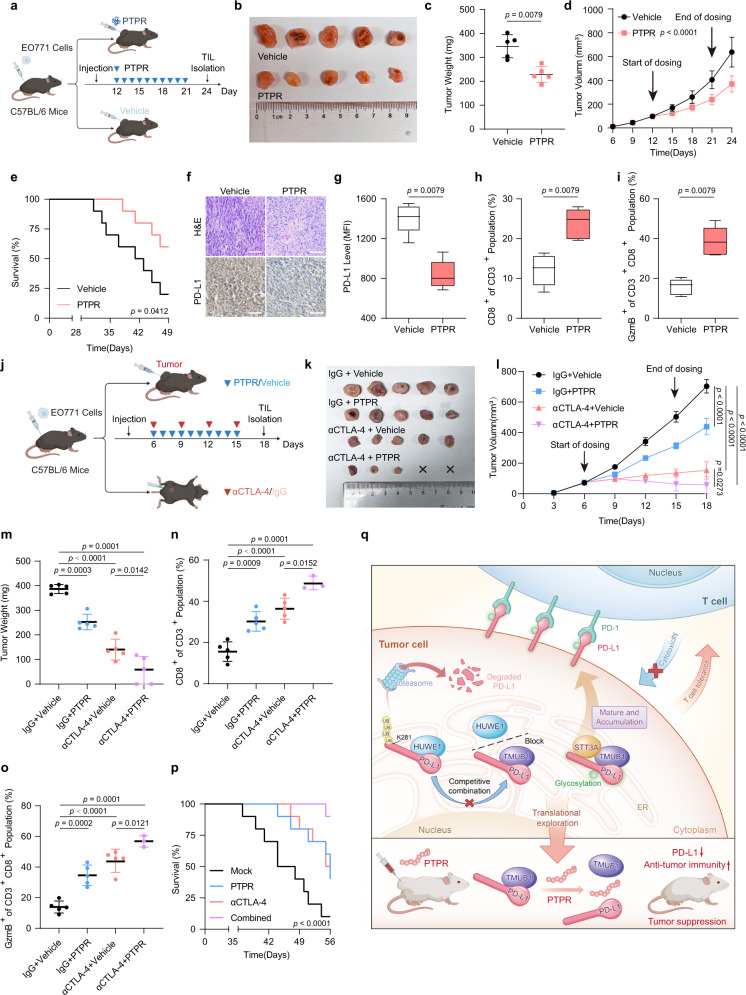
Immune checkpoint blockade therapies targeting the PD-L1/PD-1 axis have demonstrated clear clinical benefits. Improved understanding of the underlying regulatory mechanisms might contribute new insights into immunotherapy. Here, we identify transmembrane and ubiquitin-like domain-containing protein 1 (TMUB1) as a modulator of PD-L1 post-translational modifications in tumor cells. Mechanistically, TMUB1 competes with HECT, UBA and WWE domain-containing protein 1 (HUWE1), a E3 ubiquitin ligase, to interact with PD-L1 and inhibit its polyubiquitination at K281 in the endoplasmic reticulum. Moreover, TMUB1 enhances PD-L1 N-glycosylation and stability by recruiting STT3A, thereby promoting PD-L1 maturation and tumor immune evasion. TMUB1 protein levels correlate with PD-L1 expression in human tumor tissue, with high expression being associated with poor patient survival rates. A synthetic peptide engineered to compete with TMUB1 significantly promotes antitumor immunity and suppresses tumor growth in mice. These findings identify TMUB1 as a promising immunotherapeutic target.


Conflict of interest statement

The authors declare no competing interests.

Figures

Fig. 1
Fig. 1. TMUB1 is a positive regulator of PD-L1.
a GSEA analysis of PD-L1 expression (PD-L1 high/PD-L1 low) in the TCGA BRCA dataset. Enriched post-translational modification pathways and enrichment scores are shown. b, c Relative glycosylation (n = 9) and (c) phosphorylation levels of PD-L1 (n = 3) were detected by mass spectrometry in tumor tissue (T) and adjacent non-malignant tissue (N) from breast cancer patients. Two-sided Wilcoxon test for (b) and Two-sided Mann–Whitney test for (c). d Venn Diagram showing IP-MS-detected potential PD-L1-interacting protein, upregulated genes in BRCA (TCGA) and genes associated with tumor CD8+ T cell infiltration in BRCA (TCGA). e Representative IHC staining of TMUB1 and CD8 in selected TMUB1-High and TMUB1-Low patients breast cancer tissue from SYSUCC cohorts. Scale bar: 100 µm. f Correlations between the TMUB1 positivity rate and CD8 positivity rate in breast cancer tissue sample (n = 55). The R values and p values are from Pearson’s correlation analysis. g Kaplan-Meier analysis of the overall survival curve for breast cancer patients (SYSUCC cohorts; n = 100) with TMUB1 and PD-L1 combined expression. Kaplan-Meier analysis along with log-rank test. h Co-IP analysis of the interaction between endogenous PD-L1 and endogenous TMUB1 within MDA-MB-231 cells. IgG was used as the negative control. i–k Flow cytometric analysis with median fluorescence intensity (MFI) of PD-L1 in control, stable TMUB1-Flag expression (i) or TMUB1-knockdown MDA-MB-231 cells (j) or with the stimulation of IFN-γ (k). Data are presented as means ± SEM; n = 7; One-way analysis of variance (ANOVA) followed by Tukey’s test. l The sh-scramble or sh-TMUB1 MDA-MB-231 cells co-cultured with activated T cells for 48 h and then subjected to crystal violet staining. The ratio of MDA-MB-231 cells to T cells: 1:3. Data are presented as mean ± SEM; n = 4. One-way ANOVA followed by Tukey’s test. m–n The RT-qPCR analysis of the mRNA expressions of IFN-γ (m) or TNF-α (n) in PBMCs after co-culture with MDA-MB-231 sh-scramble cells or sh-TMUB1 cells. Data are presented as mean ± SEM; n = 4. One-way ANOVA followed by Tukey’s test.
Fig. 2
Fig. 2. TMUB1 stabilizes PD-L1 by antagonizing its polyubiquitination by the E3 ligase HUWE1.
a, b Immunoblots of PD-L1 in MDA-MB-231 cells with stable overexpression of Tag-free TMUB1 (a), TMUB1-knockdown (b) or control following treatment with 20 µg/mL cycloheximide (CHX) for the indicated time points. c Immunoblots of PD-L1 in TMUB1-knockdown or control MDA-MB-231 cells following treatment with 10 µM of MG132 or 50 µM of CQ for 6 h. Data are presented as mean ± SEM; n = 4. One-way ANOVA followed by Tukey’s test. Co-IP analysis of the interaction between endogenous ubiquitin and PD-L1 in stable Tag-free TMUB1-overexpression (d), TMUB1-knockdown (e) or control MDA-MB-231 cells treated with 10 µM of MG132 for 6 h. f The MS analysis to explore different PD-L1-binding proteins in Fig.1d. Numbers represent the peptide-spectrum matches of different proteins detected by mass spectrometry in the indicated groupings. The representative candidates are listed. TMUB1 and HUWE1 were identified. g Co-IP analysis of the interaction between endogenous PD-L1 and HUWE1-HA in MDA-MB-231 cells treated with 10 µM of MG132 for 6 h. h, i Immunoblots of PD-L1 in TMUB1-knockdown (h), Tag-free TMUB1-overexpression (i) or control MDA-MB-231 cells transfected with HA-empty vector or HA-HUWE1. j TUBE-pull down assay of the interaction between PD-L1-Flag and endogenous ubiquitin in stable TMUB1-His or empty-vector overexpression MDA-MB-231 cells transfected with HA-HUWE1 or HA-empty vector. k The working model of TMUB1 antagonizing HUWE1-mediated PD-L1 ubiquitination and enhancing PD-L1 stability.
Fig. 3
Fig. 3. TMUB1 protects PD-L1 from HUWE1-mediated ER-associated degradation.
a, b Co-IP analysis and immunoblots for PD-L1-HA and TMUB1-Flag (a) or HUWE1-Flag (b) in the HEK-293T cells treated with 5 μg/ml Tunicamycin for 12 h or not or 10 µM of MG132 for 6 h. Triangle: Glycosylated PD-L1, Circle: Non-glycosylated PD-L1. c, d Endoplasmic reticulum localization of TMUB1 (c) and HUWE1 (d) was detected using immunofluorescence staining (left), Calnexin was stained to characterize the endoplasmic reticulum. Line scan of the relative fluorescence intensity of the signal (dotted line; left), demonstrating peak overlapping (right). Scale bar: 10 µm. e Analysis of the subcellular localization of PD-L1, TMUB1, and HUWE1 in the fraction of MDA-MB-231 cells isolated by differential centrifugation. f Co-IP analysis for PD-L1 and TMUB1/HUWE1 in the ER fraction of MDA-MB-231 cells. g Co-IP analysis for the interaction of the different truncations of PD-L1-HA with TMUB1-Flag in HEK-293T cells. h Co-IP analysis for the interaction of the different truncations of PD-L1-Flag with HUWE1-HA in HEK-293T cells. i Schematic diagram for PD-L1 displaying the position of the Extracellular Domain (ECD) and the Transmembrane and Cytoplasmic Domain (T + C). j Co-IP analysis of the interaction between endogenous HUWE1 and PD-L1 within MDA-MB-231 cells with TMUB1 overexpression or not. IgG was used as the negative control. k Immunoblots of PD-L1 in TMUB1-knockdown or control MDA-MB-231 cells following treatment with 10 µM of Eer I for 12 h. Cell lysates were treated with PNGase F. Triangle: Glycosylated PD-L1, Circle: Non-glycosylated PD-L1. l Immunoblots of PD-L1 in TMUB1-knockdown or control MDA-MB-231 cells following treatment with 10 µM of MG132 and 50 µM of CQ for 6 h. Cell lysates were treated with PNGase F. Triangle: Glycosylated PD-L1, Circle: Non-glycosylated PD-L1. m Volcano plot represented the gene correlation with TMUB1 in breast cancer, p-value < 0.01 and absolute correlation coefficient >0.3 or <−0.3 by using Proteome data of CPTAC - Breast invasive carcinoma prospective cohort from Linkedomics. Two-sided t test. n Co-IP analysis for the interaction between endogenous PD-L1 and endogenous STT3A within MDA-MB-231 cells with TMUB1-Overexpression or not. IgG was used as the negative control.
Fig. 4
Fig. 4. TMUB1 knockdown promotes antitumor immunity in vivo via PD-L1 degradation.
a Immunoblots of PD-L1 and TMUB1 in control or Tmub1-knockdown 4T1 cells. b Analysis of 4T1 cell tumor growth in the xenograft Balb/c nude mouse model. Data are presented as mean ± SEM of n = 5 mice per group. Two-way ANOVA. c–f  Analysis of tumor growth in the xenograft mouse model established using indicated 4T1 cells in Balb/c mice (c, d) or indicated EO771 cells in C57BL/6 mice (e, f). In vivo generated tumors are depicted. Data are presented as mean ± SEM. of n = 5 mice per group. Two-way ANOVA. g Analysis of tumor weight in the xenograft mouse model. Data are presented as mean ± SEM of n = 5 mice per group. One-way ANOVA followed by Tukey’s test. h Representative IHC staining in randomly selected tumors from mice subcutaneously injected with the indicated stably-transduced EO771 cells. Scale bar: 100 µm. i Survival in the mice bearing sh-Scramble or sh-Tmub1 EO771-derived tumor. n = 10 mice per group. Log-rank test. j–s Flow cytometric analysis with median fluorescence intensity (MFI) of PD-L1, (j) CD3+ CD4+ T cells (k), CD4+ Foxp3+ Treg cells (l), CD3- NK1.1+ NK cells (m), CD11b+ Gr1+ MDSC (n), CD11b+ F/480+ TAM (o), CD3+ CD8+ T cells (p), granzyme B-positive CD3+ CD8+ T cells (q), TIM3+ CD8+ TExhausted cells (r) and the abundance of IFN-γ (pg/mL) in mice serum was detected by ELISA assays (s). Data are presented as a box plot with box and whiskers. Bounds of box show the 25th and 75th percentiles, and the central lines in the box represent the median value. Whiskers show min to max value, n = 5 per group. One-way ANOVA followed by Tukey test. Detailed gating information is presented in Supplementary Fig. 8. t–w The RT-qPCR analysis of the expressions of IFN-γ (t), TNF-α (u), CXCL-10 (v), and CCL-5 (w) in bulk EO771 tumor xenografts. Data presented as mean ± SEM; n = 5. One-way ANOVA followed by Tukey’s test.
Fig. 5
Fig. 5. Clinical value of TMUB1 as a potential target in tumor immunotherapy.
a The expressions of PD-L1 and TMUB1 in 55 primary human breast cancer specimens. Scale bar: 100 µm. b Correlations between TMUB1 positivity rate and PD-L1 positivity rate in breast cancer tissues (n = 55). The R values and p values are from Pearson’s correlation analysis. c Percentages of specimens exhibiting low or high TMUB1 expression were correlated with PD-L1 levels. Two-sided χ2 test. d, e PD-L1 (d) and TMUB1 (e) protein level in adjacent non-malignant tissue (N) and malignant breast cancer (T). Data are presented as a box plot with box and whiskers. Bounds of box show the 25th and 75th percentiles, and the central lines in the box represent the median value. Whiskers show min to max value, n = 55 per group. Two-sided Wilcoxon test. f, g The relative levels of PD-L1 (f) and TMUB1 (g) in the tumor are normalized to paired non-malignant tissue as differential expression values (T/N). h Overall survival curve for breast cancer patients (n = 100) with low or high TMUB1 expression. Kaplan-Meier analysis along with the log-rank test. i The expressions of PD-L1 and TMUB1 in 72 primary human gastric cancer specimens. Scale bar: 100 µm. j, k PD-L1 (j) and TMUB1 (k) protein levels in adjacent non-malignant tissue (N) and malignant gastric cancer (T). Data are presented as a box plot with box and whiskers. Bounds of box show the 25th and 75th percentiles, and the central lines in the box represent the median value. Whiskers show min to max value, n = 72 per group. Two-sided Wilcoxon test. l, m The relative levels of PD-L1 (l) and TMUB1 (m) in the tumor are normalized to paired non-tumor tissue as differential expression values (T/N). n Correlations between the TMUB1 positivity rate and PD-L1 positivity rate in gastric cancer tissues (n = 72). The R values and p values are from Pearson’s correlation analysis. o The percentage of specimens exhibiting low or high TMUB1 expression was correlated to PD-L1 levels, Two-sided χ2 test. p Overall survival curve for gastric cancer patients (n = 72) with low or high TMUB1 expression. Kaplan-Meier analysis along with the log-rank test.
Fig. 6
Fig. 6. The PTPR competitive peptide prevents the upregulation of PD-L1 by TMUB1.
a Schematic diagram for TMUB1 displaying the positions of different domains. b Co-IP analysis for the interaction of different truncations of TMUB1-Flag with PD-L1-Myc in HEK-293T cells. c Schematic diagram for TMUB1 displaying the positions of different fragments of the MU1 domain. d Co-IP analysis for the interaction of the different truncations of TMUB1-Flag with PD-L1-HA in HEK-293T cells. e Schematic diagram for the PTPR peptide. f PTPR-FITC in MDA-MB-231 cells was observed using immunofluorescence staining, membrane protein NF2 was stained to characterize the cytomembrane. Scale bar: 10 µm. g Immunoblots of PD-L1 in the MDA-MB-231 cells untreated or treated with 10 µM of PTPR-FITC for 12 h. h Recombinant PD-L1-GST and TMUB1-His are purified for use in a GST pull-down assay. The interaction between TMUB1 and PD-L1 with or without the PTPR treatment was detected using the immunoblot assay. i Co-IP analysis for the interaction between TMUB1-Flag and PD-L1-HA in the HEK-293T cells untreated or treated with 10 µM of PTPR-FITC for 12 h. Co-IP analysis of the endogenous interaction between ubiquitin (j) or (k) HUWE1 and PD-L1 in MDA-MB-231 cells treated with 10 µM of MG132 for 6 h and 10 µM of PTPR for 12 hr or not. IgG was used as the negative control. l The working model of PTPR-mediated PD-L1 ubiquitination and degradation. m MDA-MB-231 cells were co-cultured with activated T cells for 48 h and subjected to treatment with 10 µM of PTPR for 12 h (or those left untreated), followed by crystal violet staining. The ratio of MDA-MB-231 cells to T cells: 1:3. Data are presented as mean ± SEM of n = 4. One-way ANOVA followed by Tukey’s test. n, o The RT-qPCR analysis of the mRNA expressions of IFN-γ (n) or TNF-α (o) in PBMCs after co-culture with MDA-MB-231 cells. Data are presented as mean ± SEM of n = 4. Two-sided Mann–Whitney test.
Fig. 7
Fig. 7. In vivo antitumor effect and toxicity of PTPR.
a The injection schematic for PTPR and in vivo antitumor effect analysis. b Xenograft mouse model established using EO771 cells in C57BL/6 mice injected with PTPR or Vehicle (n = 5 mice per group). In vivo generated tumors are depicted. c, d Analysis of tumor weight (c) and growth (d) in the xenograft mouse model. Data are presented as mean  ± SEM of n = 5 mice per group. Two-sided Mann-Whitney test for (c) and Two-way ANOVA for (d). e Survival in the mice injected with PTPR or vehicle. n = 10 mice per group. Log-rank test. f Representative IHC staining in randomly selected tumors from mice treated with PTPR or vehicle. Scale bar: 100 µm. g–i Flow cytometric analysis with median fluorescence intensity (MFI) of PD-L1 (g), CD3+ CD8+ T cells (h) or granzyme B-positive CD3+ CD8+ T cells (i). Data are presented as a box plot with box and whiskers. Bounds of box show the 25th and 75th percentiles, and the central lines in the box represent the median value. Whiskers show min to max value, n = 5 per group. Two-sided Mann-Whitney test. j The injection schematic for PTPR and αCTLA-4 in vivo antitumor effect analysis. k Xenograft mouse model established using EO771 cells in C57BL/6 mice with indicated treatment (n = 5 mice per group). In vivo generated tumors are depicted. l, m Analysis of tumor growth (l) and weight (m) in the xenograft mouse model. Data are presented as mean  ± SEM of n = 5 mice per group. Two-way ANOVA and One-way ANOVA followed by Tukey test. n, o Flow cytometric analysis of CD3+ CD8+ T cells (n) or granzyme B-positive CD3+ CD8+ T cells (o). Data are presented as a box plot with box and whiskers. Bounds of box show the 25th and 75th percentiles, and the central lines in the box represent the median value. Whiskers show min to max value, n = 5 per group. One-way ANOVA followed by Tukey’s test. p Survival in the mice with indicated treatment. n = 10 mice per group. Log-rank test. q A schematic model of TMUB1 regulation of PD-L1 and HUWE1.

Similar articles

Cited by

References

    1. Schreiber, R. D., Old, L. J. & Smyth, M. J. Cancer immunoediting: integrating immunity’s roles in cancer suppression and promotion. Sci. (N. Y., N. Y.)331, 1565–1570 (2011). - PubMed
    1. Sun, C., Mezzadra, R. & Schumacher, T. N. Regulation and function of the PD-L1 Checkpoint. Immunity48, 434–452 (2018). - PMC - PubMed
    1. Boussiotis, V. A. Molecular and biochemical aspects of the PD-1 checkpoint pathway. N. Engl. J. Med.375, 1767–1778 (2016). - PMC - PubMed
    1. Zou, W., Wolchok, J. D. & Chen, L. PD-L1 (B7-H1) and PD-1 pathway blockade for cancer therapy: Mechanisms, response biomarkers, and combinations. Sci. Transl. Med.8, 328rv324 (2016). - PMC - PubMed
    1. Sonpavde, G. PD-1 and PD-L1 inhibitors as salvage therapy for urothelial carcinoma. N. Engl. J. Med.376, 1073–1074 (2017). - PubMed

Publication types