. 2022 Nov 14;13(1):6954.
doi: 10.1038/s41467-022-34345-y.

The 3D enhancer network of the developing T cell genome is shaped by SATB1

Affiliations

The 3D enhancer network of the developing T cell genome is shaped by SATB1

Tomas Zelenka et al. Nat Commun. .

Abstract

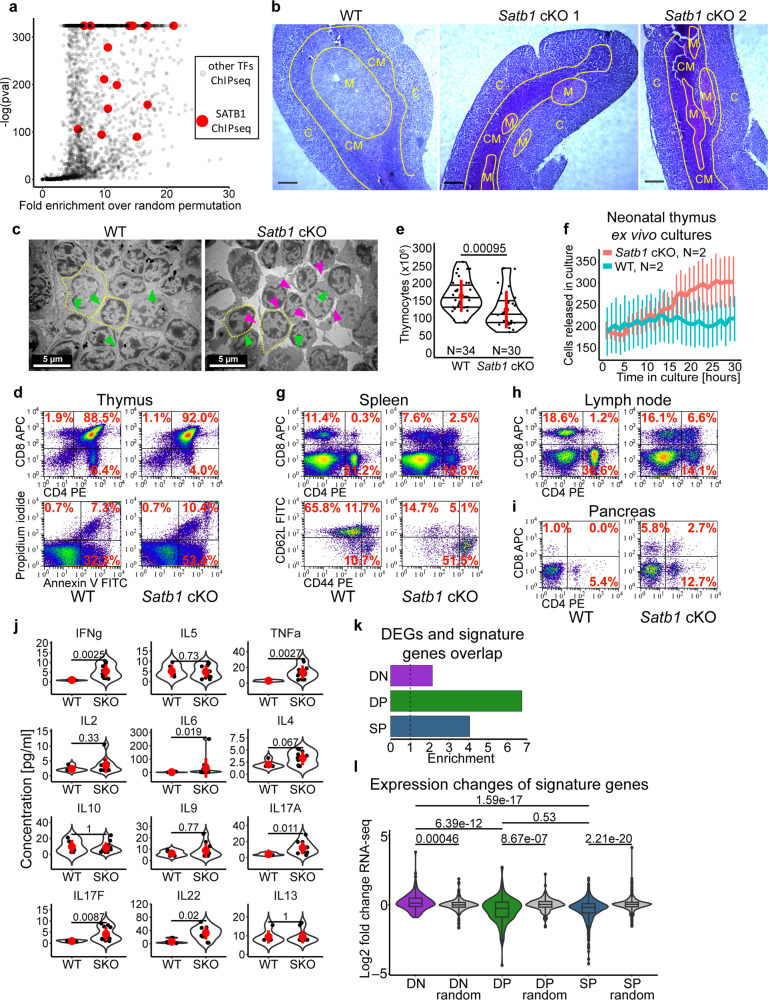
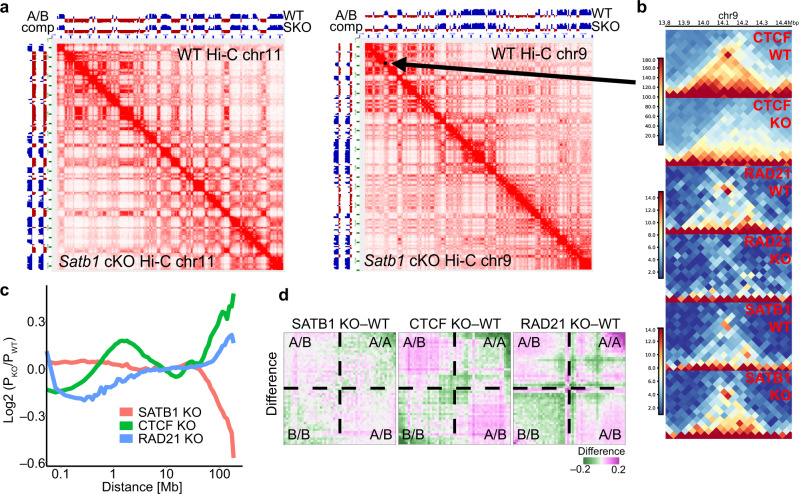
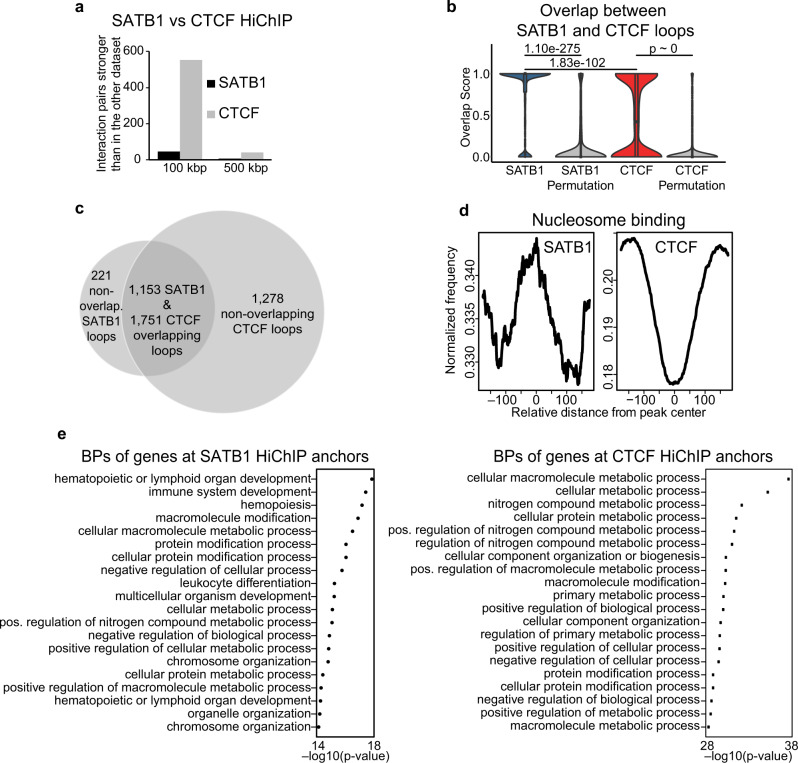
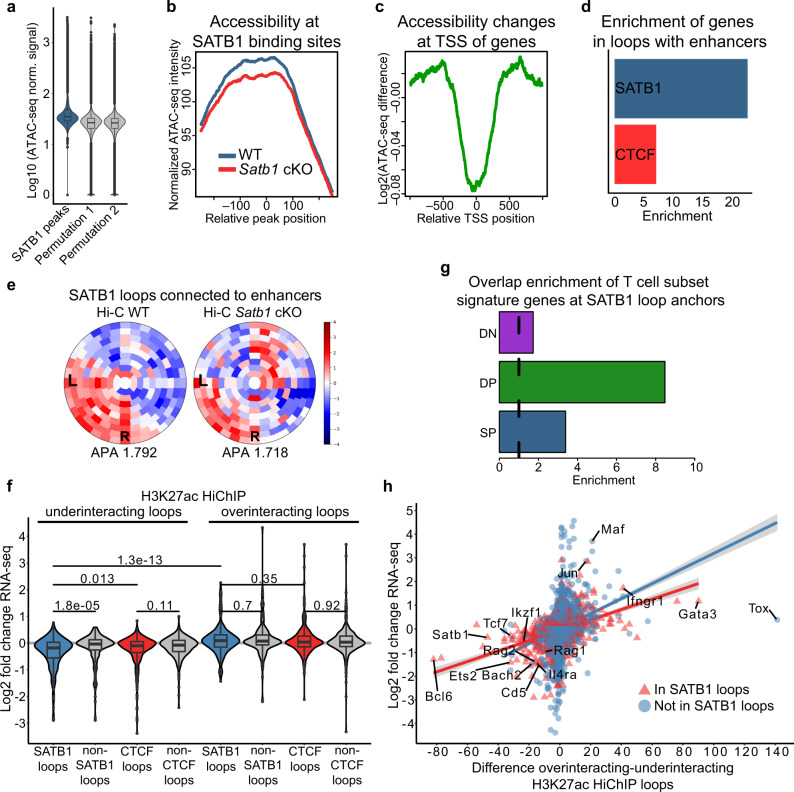
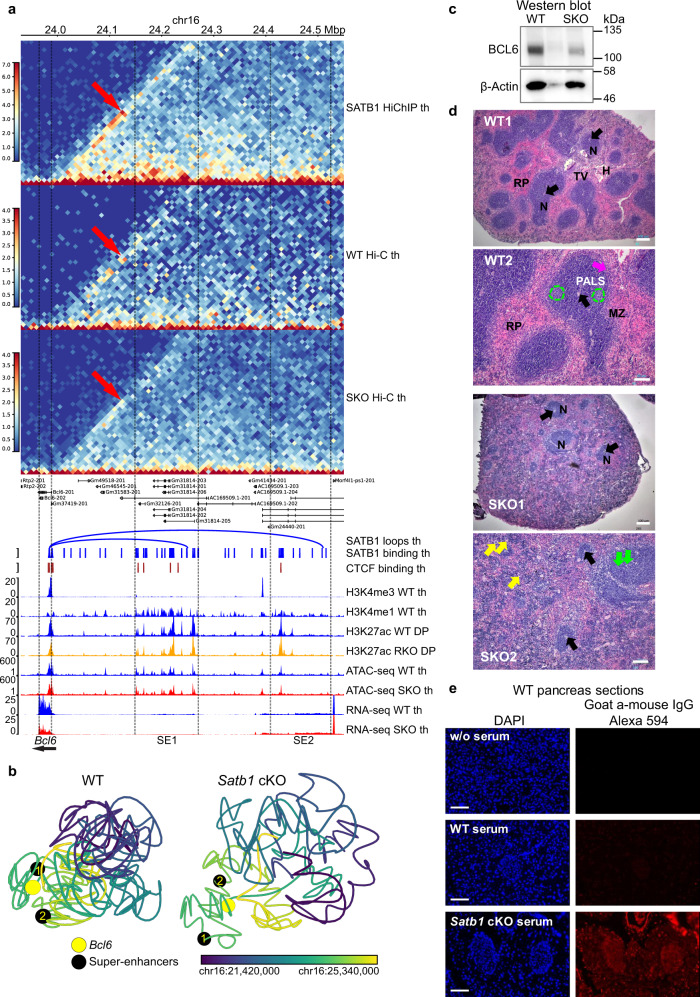
Mechanisms of tissue-specific gene expression regulation via 3D genome organization are poorly understood. Here we uncover the regulatory chromatin network of developing T cells and identify SATB1, a tissue-specific genome organizer, enriched at the anchors of promoter-enhancer loops. We have generated a T-cell specific Satb1 conditional knockout mouse which allows us to infer the molecular mechanisms responsible for the deregulation of its immune system. H3K27ac HiChIP and Hi-C experiments indicate that SATB1-dependent promoter-enhancer loops regulate expression of master regulator genes (such as Bcl6), the T cell receptor locus and adhesion molecule genes, collectively being critical for cell lineage specification and immune system homeostasis. SATB1-dependent regulatory chromatin loops represent a more refined layer of genome organization built upon a high-order scaffold provided by CTCF and other factors. Overall, our findings unravel the function of a tissue-specific factor that controls transcription programs, via spatial chromatin arrangements complementary to the chromatin structure imposed by ubiquitously expressed genome organizers.


Conflict of interest statement

The authors declare no competing interests.

Figures

Fig. 1
Fig. 1. Deregulated thymic development in Satb1 cKO mice.
a Fold-enrichment distribution of peaks from all available blood ChIP-seq datasets based on ChIP-Atlas at WT H3K27ac loop anchors over random permutation and the corresponding p values. Peaks from SATB1 ChIP-seq datasets (highlighted in red) were enriched at the anchors of regulatory chromatin loops. b Methylene blue stained thymus sections from WT and Satb1 cKO mice displaying a disrupted thymic environment in the Satb1 cKO mouse (C: cortex, M: medulla, CM: corticomedullary region; scale bar 50 µm). The experiment was repeated 4 times in total with similar results. c Transmission electron microscopy thymic cryosections (representative of 4 biological replicates) indicating thymocytes with disrupted intercellular contacts in the Satb1 cKO cells. Cell borders are indicated by yellow dashed lines and green and magenta arrows show examples of intact and disrupted intercellular contacts, respectively. Figures d, g, h, i: Flow cytometry analysis to characterize cell populations in the thymus, spleen, lymph node and pancreas of WT and Satb1 cKO animals, respectively. Gating for CD4/CD8, CD62L/CD44 and Annexin V/PI experiments were G1, G2 and G3, respectively (Supplementary Fig. 3b). Images are representative of the analyzed group and percentages represent the mean. All experiments are summarized in Supplementary Fig. 3c. e Number of thymocytes in WT and Satb1 cKO mice. The horizontal lines inside violins represent the 25th, 50th and 75th percentiles. The red circle represents the mean ± s.d. P values by two-sided Wilcoxon rank sum test. f Neonatal thymi from WT and Satb1 cKO mice were cultivated for 30 hours. An image was taken every hour to monitor the rate of T cell exit from the thymus. The final result represents an average from two animals for each genotype. The error bars represent the standard error of the mean. j Differences in the cytokine milieu in the blood serum of n = 5 WT and n = 11 Satb1 cKO (SKO) animals measured with bead-based immunoassay. Note the elevated IL17 response and increased inflammatory cytokines. The red circle represents the mean ± s.d. P values by two-sided Wilcoxon rank sum test. All data analyzed can be found in the source data file. k Overlap enrichment of T cell subset signature genes and differentially expressed genes in Satb1 cKO. Overlapping genes are depicted in the source data file. l Expression changes of DN, DP and SP T cell subset signature genes. DP signature genes displayed the lowest RNA levels in Satb1 cKO, indicating the specificity of the SATB1 regulatory function at the DP stage. P values by two-sided Wilcoxon rank sum test, non-adjusted for multiple comparisons. The boxplots show median with the top and bottom edges of the box representing the 75th and 25th percentiles, respectively. The whiskers represent the most extreme values that are within 1.5 times the interquartile range of the 25th and 75th percentiles. Outliers outside the whiskers are shown as dots. The exact number of features analyzed can be found in the source data file.
Fig. 2
Fig. 2. Roles of genome organizers in T cell chromatin organization.
a Comparison of WT and Satb1 cKO Hi-C heatmaps at 500 kbp resolution (balanced normalization) of chromosomes 9 and 11 indicates no major changes at the high order chromatin level of murine thymocytes. b Zoomed-in region of chromosome 9 (indicated by a black arrow in a) depicts a topologically associating domain and its disruption in CTCF-depleted mESCs and RAD21-depleted DP T cells but not in SATB1-depleted murine thymocytes (this study). c Genome-wide log2 fold change of relative contact probabilities between WT and SATB1-, CTCF- and RAD21-depleted cells, calculated using GENOVA. d Saddle plot analysis was computed using GENOVA to illustrate the abundance of inter- vs intra-compartment interactions. The visualization represents the difference between a factor-depleted versus WT observed/expected output of the saddle analysis. In brief, Rad21 cKO cells displayed the highest compartmentalization, i.e. the strongest gain of homotypic compartment interactions, whereas Satb1 cKO cells showed only mild compartmental changes.
Fig. 3
Fig. 3. Fine-scale T cell chromatin organization by SATB1.
a diffHic analysis of differentially interacting chromatin areas indicates that CTCF contributes more strongly to the higher order chromatin organization of the murine T cell genome than SATB1. b Overlap score between SATB1 and CTCF loops calculated as (number of overlapping bp) / (bp size of a loop). For example, for the SATB1-labeled violin, a score of 1.0 indicates either 100% overlap or engulfment of a SATB1-dependent loop in a loop dependent on CTCF. A score of 0.0 indicates no overlap. The plot indicates that the majority of the SATB1 loops were engulfed in CTCF loops. The same approach was repeated for randomly shuffled loops. P values by two-sided Wilcoxon rank sum test, non-adjusted for multiple comparisons. The exact number of features analyzed can be found in the source data file. c SATB1-dependent loops highly overlap with CTCF-dependent loops detected by HiChIP. For the overlap, the outer coordinates of left and right loop anchors were used. d SATB1 preferentially binds nucleosomes unlike CTCF, as determined from analysis of the ATAC-seq data using NucleoATAC. e SATB1 loop anchors overlap with genes enriched for immune system-related biological processes (BPs). CTCF-dependent loops display more widespread coverage of intersecting genes thus the most enriched gene ontology pathways belong mostly to general cellular processes. Cumulative hypergeometric P values calculated by g:Profiler are displayed.
Fig. 4
Fig. 4. SATB1-dependent promoter-enhancer communication of critical immune-related genes.
a ATAC-seq signal indicates higher chromatin accessibility at WT SATB1 binding sites than expected by chance (i.e, randomly shuffled SATB1 binding sites). 100 randomizations were used for statistical evaluation (p-value ~ 0). Two representative random distributions are depicted in the figure. b Chromatin accessibility at SATB1 binding sites is decreased in Satb1 cKO. c Log2 fold change of chromatin accessibility indicates the highest accessibility drop in Satb1 cKO being at the TSS of genes. d SATB1-dependent loops connecting genes to enhancers are about three-fold enriched compared to CTCF loops. e SATB1-dependent loops connected to enhancers display enriched interaction signal between left (L) and right (R) anchor in WT Hi-C data (z-score normalized), which is deregulated in the Satb1 cKO. Aggregate peak analysis (APA) was calculated and visualized by SIPMeta. See also Supplementary Fig. 4g for more details. f Log2 fold change expression values of genes that were present in anchors of H3K27ac HiChIP loops under- and over-interacting in Satb1 cKO and which also did or did not intersect with SATB1/CTCF-dependent loops. An equal number of underinteracting loops that did not overlap with SATB1/CTCF-dependent loops were randomly generated. P values by two-sided Wilcoxon rank sum test, non-adjusted for multiple comparisons. g Overlap enrichment between DN, DP and SP T cell subset signature genes and anchors of SATB1-dependent loops. Overlapping genes are depicted in the source data file. h Scatter plot indicating positive correlation between gene expression changes and the difference between H3K27ac overinteracting and underinteracting loops in WT thymocytes compared to Satb1 cKO. See Supplementary Fig. 7d for complete information. The grey zones indicate 95% confidence level interval for predictions from a linear model (red and blue lines for genes present and absent in SATB1-dependent loops, respectively). In a and f, the boxplots show median with the top and bottom edges of the box representing the 75th and 25th percentiles, respectively. The whiskers represent the most extreme values that are within 1.5 times the interquartile range of the 25th and 75th percentiles. Outliers outside the whiskers are shown as dots. The exact number of features analyzed can be found in the source data.
Fig. 5
Fig. 5. SATB1-dependent transcriptional regulation of Bcl6 impacts Tfh development.
a Two significant SATB1-dependent loops connect Bcl6 (same loop anchor for both loops; chr16:23985000–23990000; mm10) with its super-enhancer regions (SE1 – chr16:24245000–24250000, SE2 – chr16:24505000–24510000). In Satb1 cKO, these interactions were diminished as seen in the Hi-C heatmap. Legend: th – thymocytes, DP – CD4+CD8+ T cells, RKO – Rad21fl/flCd4-Cre+ and SKO – Satb1fl/flCd4-Cre+. b Computational 3D modeling utilizing the WT and Satb1 cKO Hi-C data, to visualize the proximity between the Bcl6 gene body and its two super-enhancer regions. The black beads represent the edge of super-enhancer regions demarcated by the SATB1 loop anchors (SE1 and SE2 as in a). Color gradient represents linear genomic position along the locus. c Western blot analysis for BCL6 expression of whole cell protein extracts prepared from WT and Satb1 cKO thymocytes. Actin serves as a loading control (upon pixel analysis of the images a 45% reduction of BCL6 expression in Satb1 cKO thymocytes was calculated). Two biological replicates were performed with similar results. The Western blot analysis was performed three times with similar results. d H&E staining of mouse spleen sections. In WT sections, Red Pulp (RP), lymphoid Nodules of the white pulp (N), the Hilus (H) and Trabecular Vein (TV) are labeled. Arteries (black arrows) are present in each nodule. The nodule structure is clear with extensive periarteriolar lymphocyte sheath (PALS), rich in round, dark stained T lymphocytes surrounding the arterioles (WT2). The distinct marginal zone surrounding the marginal sinus (MZ and magenta arrow, respectively) is shown. Dotted lines mark lighter stained B-lymphocyte rich follicle regions within the nodule. In Satb1 cKO (SKO), there is disturbed spleen structure with few apparent small sized lymphoid nodules with the periarteriolar region depleted of T lymphocytes. The follicular region has accumulated large phagocytic cells and displays many foci of phagocytosis of apoptotic cells (green arrows). The red pulp contained higher numbers of haemopoietic cell clusters and megakaryocytes (yellow arrows) suggesting increased haemopoietic activity. Scale bar WT1 & SKO1 100 μm and WT2 & SKO2 50 μm. The experiment was repeated four times with similar results. e WT pancreas sections were incubated with serum from either WT or Satb1 cKO animals to detect the presence of autoantibodies in the Satb1 cKO serum. Scale bar 100 μm. The experiment was repeated 2 times with similar results.
Fig. 6
Fig. 6. SATB1 controls expression of TCR and other adhesion molecule genes.
a Important thymic receptors were underexpressed in Satb1 cKO based on RNA-seq data. b Scatter plot indicating positive correlation between gene expression changes and the difference between H3K27ac overinteracting and underinteracting loops in WT compared to Satb1 cKO thymocytes that was normalized to the 1 kbp gene length. The grey zones indicate 95% confidence level interval for predictions from a linear model (red and blue lines for genes present and absent in SATB1-dependent loops, respectively). c Genomic tracks as well as SATB1 and CTCF HiChIP loops at the T cell receptor alpha locus (TCRα). The bottom green genomic tracks of log2 fold change RNA-seq values summarize the overall deregulation of the TCRα locus, with variable regions (Trav genes) being mostly underexpressed, TCRδ locus overexpressed and TCRα joining regions (Traj genes) displaying geometrically symmetric deregulation splitting the region into over- and under-expressed in Satb1 cKO cells (magenta arrow). This deregulation was markedly correlated with the presence of SATB1-dependent loops. Note especially the region of joining genes which manifests a deregulation similar to previous reports from Satb1 depleted animals,. Both SATB1 and CTCF loops displayed a tendency to connect the TCR enhancer (green arrow) to the regions inside the locus. The presented loops were called with low stringency parameters and with a different set of binding sites compared to the rest of our study due to technical details explained in the methods section. All tracks refer to murine thymocytes. d SATB1-dependent promoter-enhancer regulatory loops control the expression of both Rag1 and Rag2 genes. Legend: th – thymocytes, DP – CD4+CD8+ T cells, RKO – Rad21fl/flCd4-Cre+ and SKO – Satb1fl/flCd4-Cre+. e RNA levels of Rag1 and Rag2 genes in WT and Satb1 cKO (SKO) thymocytes based on three biological replicates of RNA-seq experiments. Data are presented as mean values ± s.d. FDR scores from DESeq2 analysis are provided. f Protein levels of RAG1 and RAG2. The Western blot analysis was performed three times for each protein. g Differential H3K27ac HiChIP loops reflected the deregulation of Traj regions.

References

    1. Rao SSP, et al. A 3D map of the human genome at kilobase resolution reveals principles of chromatin looping. Cell. 2014;159:1665–1680. - PMC - PubMed
    1. Lieberman-Aiden E, et al. Comprehensive mapping of long-range interactions reveals folding principles of the human genome. Science. 2009;326:289–293. doi: 10.1126/science.1181369. - DOI - PMC - PubMed
    1. Dixon JR, et al. Topological domains in mammalian genomes identified by analysis of chromatin interactions. Nature. 2012;485:376–380. - PMC - PubMed
    1. Nora EP, et al. Spatial partitioning of the regulatory landscape of the X-inactivation center. Nature. 2012;485:381–385. - PMC - PubMed
    1. Rowley MJ, Corces VG. Organizational principles of 3D genome architecture. Nat. Rev. Genet. 2018;19:789–800. - PMC - PubMed

Publication types

Substances