. 2022 Nov 14;12(1):19454.
doi: 10.1038/s41598-022-23477-2.

Single-cell transcriptomics defines an improved, validated monoculture protocol for differentiation of human iPSC to microglia

Affiliations

Single-cell transcriptomics defines an improved, validated monoculture protocol for differentiation of human iPSC to microglia

Sam J Washer et al. Sci Rep. .

Abstract

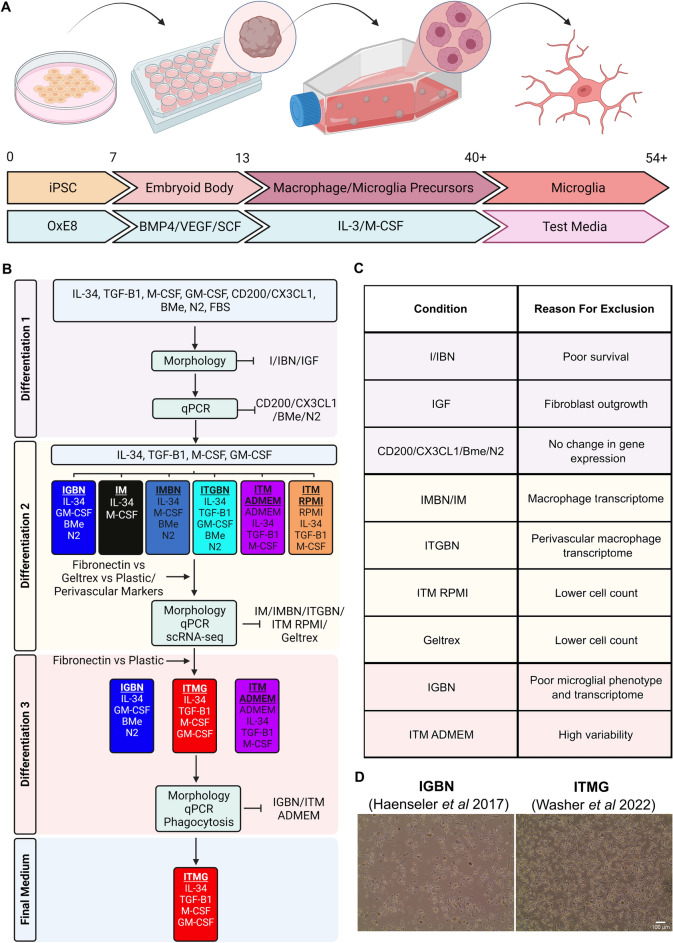
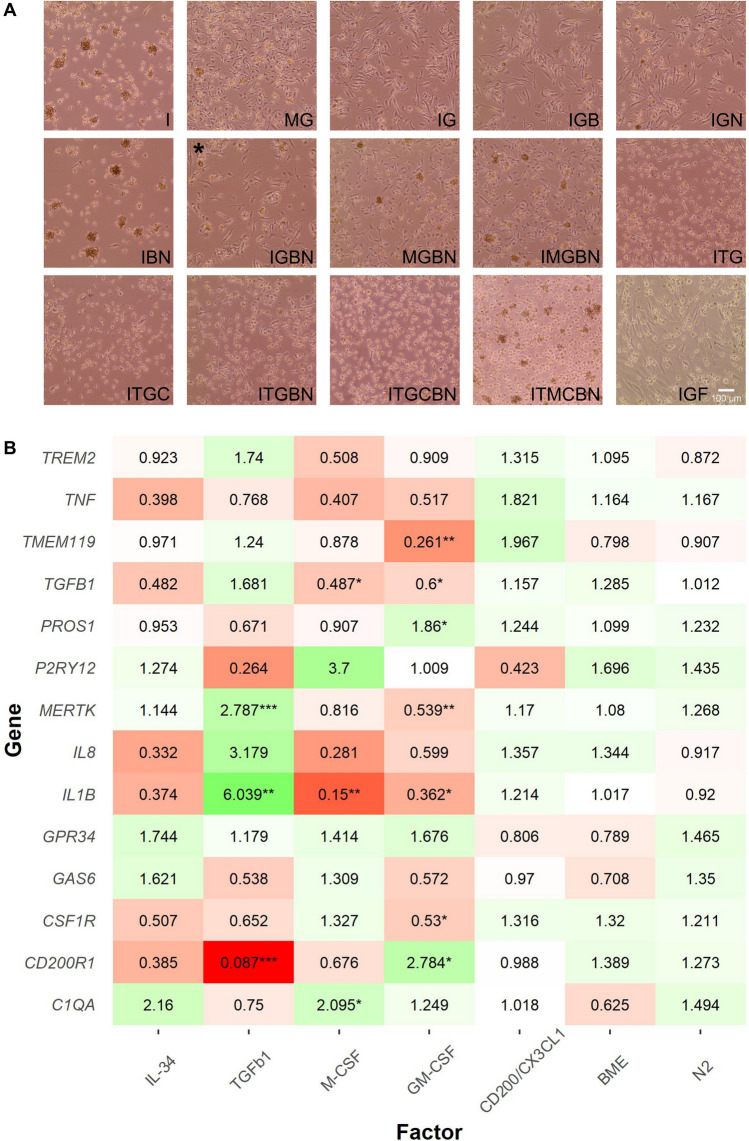
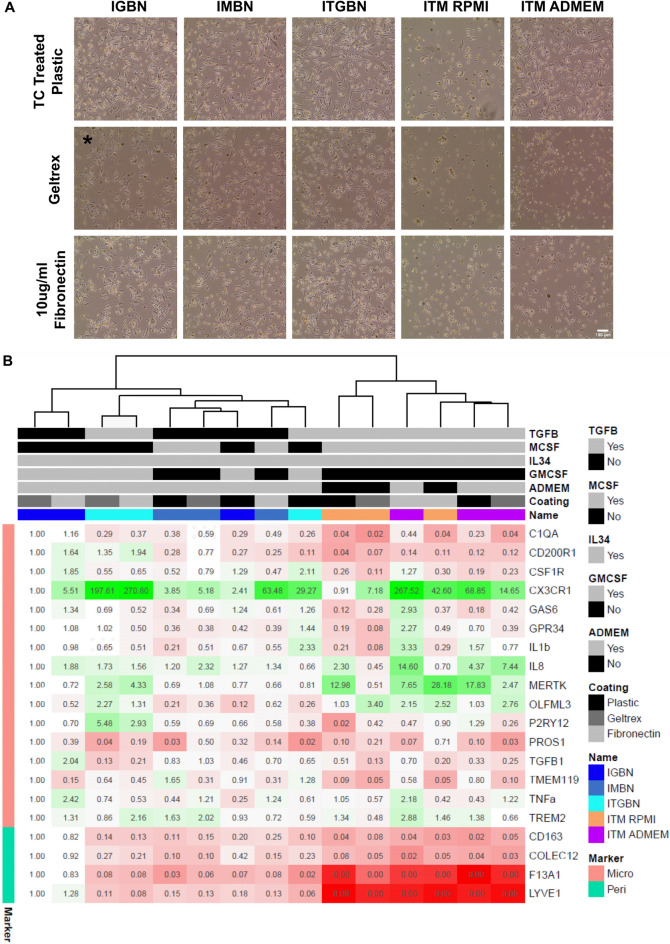
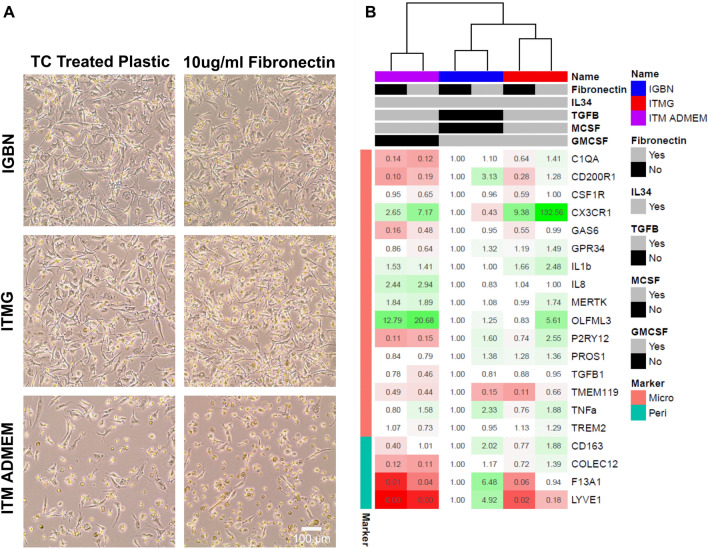
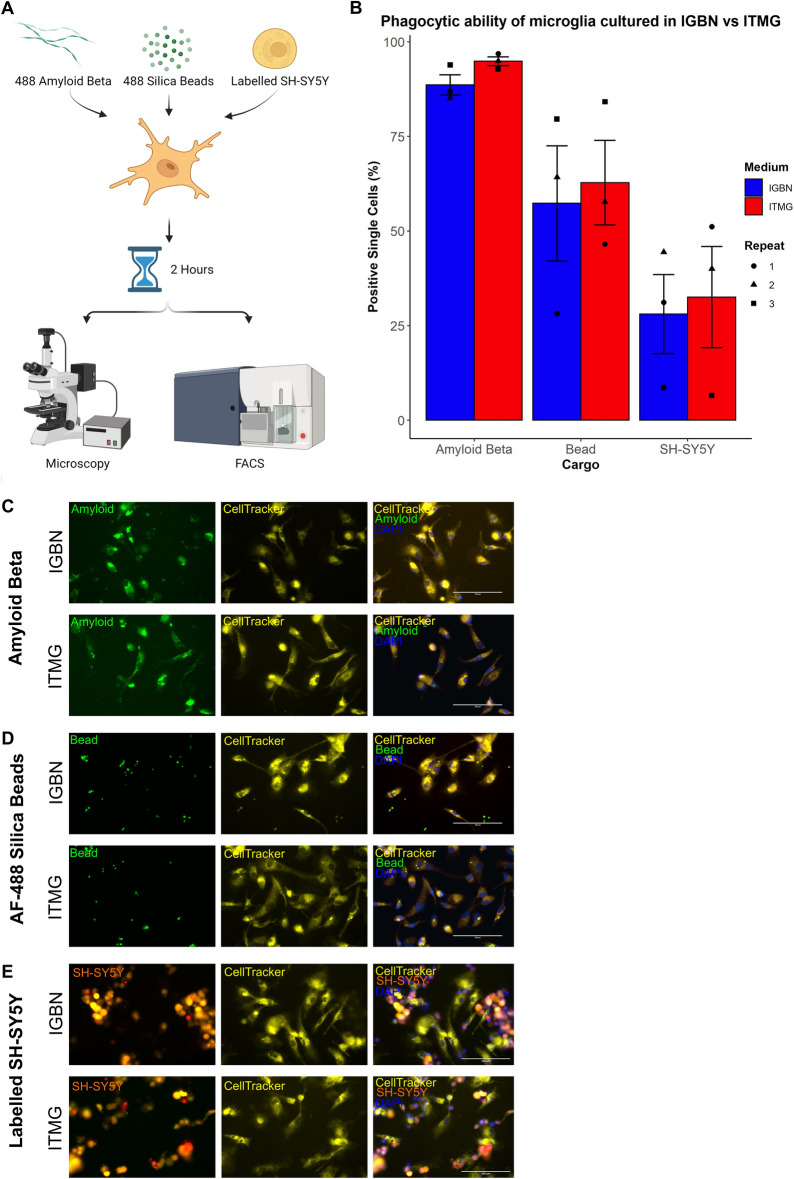
There is increasing genetic evidence for the role of microglia in neurodegenerative diseases, including Alzheimer's, Parkinson's, and motor neuron disease. Therefore, there is a need to generate authentic in vitro models to study human microglial physiology. Various methods have been developed using human induced Pluripotent Stem Cells (iPSC) to generate microglia, however, systematic approaches to identify which media components are actually essential for functional microglia are mostly lacking. Here, we systematically assess medium components, coatings, and growth factors required for iPSC differentiation to microglia. Using single-cell RNA sequencing, qPCR, and functional assays, with validation across two labs, we have identified several medium components from previous protocols that are redundant and do not contribute to microglial identity. We provide an optimised, defined medium which produces both transcriptionally and functionally relevant microglia for modelling microglial physiology in neuroinflammation and for drug discovery.


Conflict of interest statement

The authors declare no competing interests.

Figures

Figure 1
Figure 1
A flowchart of the differentiation process from iPSC to Microglia as described by Haenseler et al. (A) iPSC are cultured in OxE8 medium for 7 days before differentiation into embryoid bodies in Aggrewell plates for 6 days in embryoid body medium (BMP4/VEGF/SCF). After 6 days embryoid bodies are transferred to T175 flasks and cultured in myeloid differentiation media of IL-3 and M-CSF. At approximately d40 these factories produce microglial precursor cells which are harvested and plated in microglial media and differentiated for 14 days. This final step is the target for optimisation in this manuscript. iPSC induced pluripotent stem cell, EB embryoid body, SCF stem cell factor, BMP4 bone morphogenetic protein 4, VEGF vascular endothelial growth factor, IL-3 Interleukin 3, M-CSF macrophage colony stimulation factor, d day. Created with BioRender.com. (B) A flowchart describing the systematic identification of factors required for iPSC-microglial differentiation. After the first triage of 15 media combinations, the morphology analysis removed three conditions due to poor differentiation. Following qPCR analysis four factors could be removed from further medium development. The second set of differentiations focused on IL-34, TGF-β1, M-CSF, and GM-CSF as these were shown to have an effect in the first round of differentiations. Several conditions were removed due to poor microglial identity following scRNA-seq and morphology analysis. In the final differentiation, we identified that our new medium (ITMG) produced iPSC-microglia with a microglial-like transcriptome, improved survival, and performed similarly to our previous medium in functional assays. Created with BioRender.com. (C) Conditions and media tested and their reason for exclusion. (D) Representative images of d14 microglia cultured in our previous media (IGBN) and the media presented in this manuscript (ITMG). Scale bar 100 µm.
Figure 2
Figure 2
IL-34, TGF-β1, M-CSF, and GM-CSF affect iPSC-microglia morphology and result in transcriptional changes. (A) Morphology of microglia cultured for 14 days in 15 different media combinations on Geltrex. Each letter corresponds to a growth factor or compound; I IL-34, T TGF-β1, M M-CSF, G GM-CSF, C CX3CL1/CD200, B β-mercaptoethanol, N N-2 supplement, F Foetal Bovine Serum. Phase contrast images taken at ×10 magnification, scale bar 100 µm. * media IGBN is media published by Haenseler et al., and is the baseline for comparison. (B) qPCR results of known microglial marker genes in medium containing different growth factors. Fold changes initially calculated to IGBN before undertaking linear regression, regressing out each individual factor. TGF-β1, M-CSF, GM-CSF all result in transcriptional changes. CD200/CX3CL1, β-mercaptoethanol, and N-2 supplement result in no significant change in microglial gene expression. Fold changes are shown by colour, where green is increased expression and red is decreased and the number within cells. Stars indicate Bonferroni corrected significance, ***p < 0.001, **p < 0.01, *p < 0.05. Heatmap generated in R using the pheatmap package.
Figure 3
Figure 3
TGF-β1 promotes microglial identity, and M-CSF promotes macrophage identity, tissue culture coating influences morphology but medium factors are the main driver of identity. (A) Morphology of iPSC-microglia cultured for 14 days in five different media combinations on either tissue culture treated plastic, Geltrex, or 10 µg/mL fibronectin. Each letter corresponds to a growth factor or compound; I IL-34, T TGF-β1, M M-CSF, G GM-CSF, B β-mercaptoethanol, N N-2 supplement. Phase contrast images taken at ×10 magnification, scale bar 100 µm. * media IGBN is media published by Haenseler et al., and is the baseline for comparison. Geltrex resulted in the fewest cells per media condition, followed by fibronectin, with TC treated plastic resulted in the highest cell number. ITM with RPMI base medium results in a large reduction of cell numbers compared to the medium with ADMEM/F12 base. (B) qPCR of the 15 samples in (A) for microglial and perivascular macrophage markers, fold changes represented relative to IGBN Geltrex (the Haenseler et al. protocol). Fold changes are presented as both colour changes (green indicates increased expression, red decrease expression) and the number within each cell. Samples cluster by medium, with medium containing TGF-β1 showing lower expression of perivascular macrophage genes (F13A1/LYVE1/COLEC12) and increased microglial genes (CX3CR1/MERTK/OLFML3). Heatmap generated in R using the pheatmap package.
Figure 4
Figure 4
Low level supplementation with GM-CSF promotes cellular survival while maintaining microglial identity. (A) Morphology of microglia cultured for 14 days in three different media combinations on either tissue culture treated plastic or 10 µg/mL fibronectin. Each letter corresponds to a growth factor or compound; I IL-34, T TGF-β1, M M-CSF, G GM-CSF, B β-mercaptoethanol, N N-2 supplement. Phase contrast images taken at ×10 magnification, scale bar 100 µm. Media IGBN (Haenseler et al.) is the baseline for comparison. ITM ADMEM results in low survival and adherence on both TC treated plastic and 10 µg/mL fibronectin, however when supplemented with GM-CSF (ITMG) the survival and adherence is improved. (B) qPCR of the six samples from (A) for microglial and perivascular macrophage markers, fold changes represented as changes to IGBN TC treated plastic. Fold changes are presented as both colour changes (green indicates increased expression, red decrease expression) and the number within each cell. Samples cluster by medium followed by coating. ITMG promotes microglial identity with increased expression of CX3CR1 and OLFM3 and a reduction in perivascular macrophage markers (LYVE1/F13A1). Coating with fibronectin results in an increased expression of microglial identity genes in ITM and ITMG. Heatmap generated in R using the pheatmap package.
Figure 5
Figure 5
Single cell RNA-seq confirms that TGF-β1 promotes microglial identity. (A) Uniform manifold approximation and projection (UMAP) plot of quality-controlled iPSC-derived microglia cells, coloured by differentiation media. (B) Violin plots of SCT-normalised expression (y-axis) per media (x-axis) per perivascular macrophage or microglia marker gene. (C) Label transfer with singleR: cumulative percentage of cells (y-axis) of each label (colour) per media (x-axis). Mac precursor 1–3; macrophage precursors subtypes, CD7loP CD7lo progenitor, ErP erythroid progenitor, YSMP yolk sac-derived myeloid-biased progenitor, MkP megakaryocyte progenitor, Cytokine/Amyloid resp. microglia Cytokine/Amyloid response microglia.
Figure 6
Figure 6
Functional analysis of phagocytosis results in no difference between the new ITMG medium and our previously published IGBN medium. (A) To examine phagocytosis in differentiated iPSC-microglia in our new medium, we incubated cells with three different cargos; Amyloid-β aggregates, 488 labelled silica beads, and fluorescent labelled dead SH-SH5Y neuroblastoma. Phagocytosis occurred for 2 h before fixing the microglia and quantifying fluorescence using FACS, and representative images taken by microscopy. Created with BioRender.com. (B) There is a difference in the phagocytic ability of the different cargos, however there is no difference between the two medium. Data presented as mean ± SEM, N = 3 independent replicates, with individual data points shown. Each independent replicate contained three technical repeats. (C) Representative images of Amyloid-β phagocytosis at 2 h. (D) Representative images of AF-488 labelled bead phagocytosis at 2 h. (E) Representative images of labelled dead SH-SY5Y neuroblastoma phagocytosis is 2 h, red indicates a SH-SY5Y which has been phagocytosed and is in low pH environment. All images are shown at ×40 magnification, microglia are marked with CellTracker, and nuclei are stained with DAPI.

References

    1. Prinz M, Jung S, Priller J. Microglia biology: One century of evolving concepts. Cell. 2019;179(2):292–311. doi: 10.1016/j.cell.2019.08.053. - DOI - PubMed
    1. Novikova G, Kapoor M, Tcw J, Abud EM, Efthymiou AG, Chen SX, et al. Integration of Alzheimer’s disease genetics and myeloid genomics identifies disease risk regulatory elements and genes. Nat. Commun. 2021;12:1. doi: 10.1038/s41467-021-21823-y. - DOI - PMC - PubMed
    1. Wightman DP, Jansen IE, Savage JE, Shadrin AA, Bahrami S, Holland D, et al. A genome-wide association study with 1,126,563 individuals identifies new risk loci for Alzheimer’s disease. Nat. Genet. 2021;53(9):1276–1282. - PMC - PubMed
    1. Kunkle BW, Grenier-Boley B, Sims R, Bis JC, Damotte V, Naj AC, et al. Genetic meta-analysis of diagnosed Alzheimer’s disease identifies new risk loci and implicates Aβ, tau, immunity and lipid processing. Nat. Genet. 2019;51(3):414–430. - PMC - PubMed
    1. Bryois J, Skene NG, Hansen TF, Kogelman LJA, Watson HJ, Brueggeman L, et al. Genetic identification of cell types underlying brain complex traits yields novel insights into the etiology of Parkinson’s disease. Nat. Genet. 2020;52:482–493. - PMC - PubMed

Publication types