. 2022 Nov 14;12(1):19529.
doi: 10.1038/s41598-022-23069-0.

Mathematical analysis of phototransduction reaction parameters in rods and cones

Affiliations

Mathematical analysis of phototransduction reaction parameters in rods and cones

Yukari Takeda et al. Sci Rep. .

Abstract

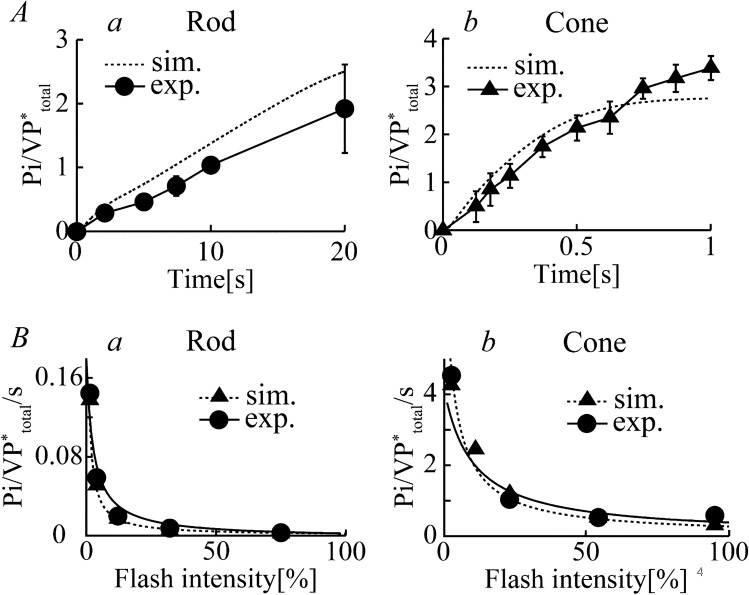
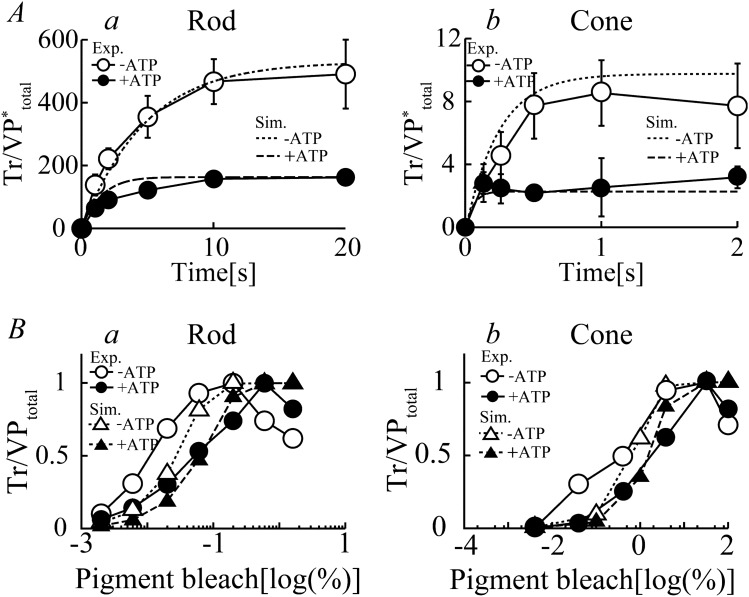
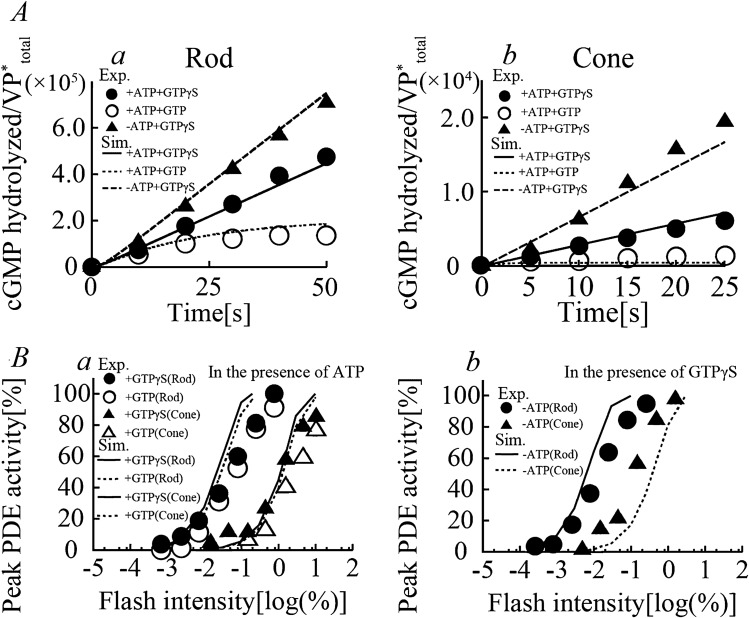
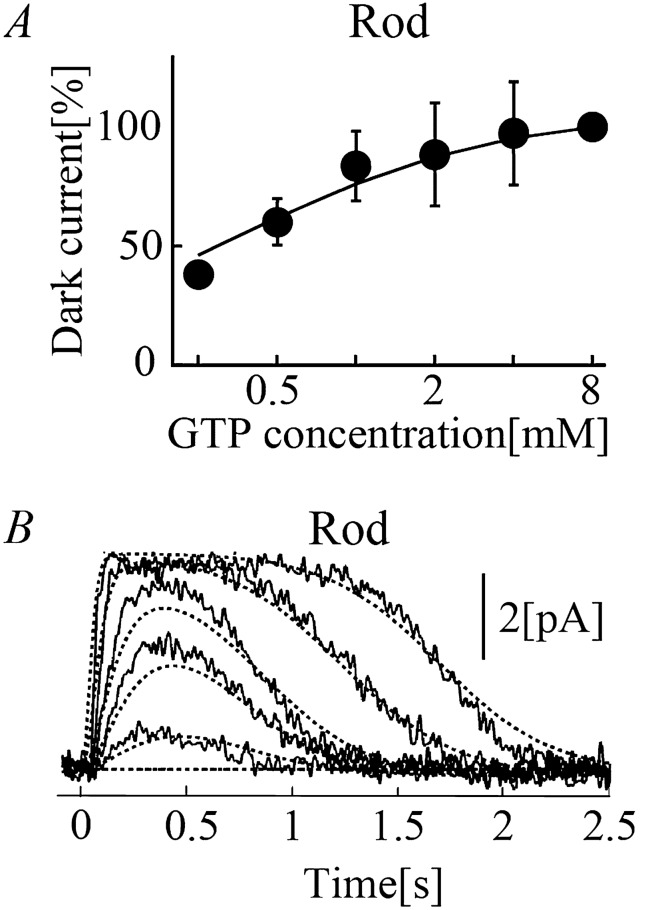
Retinal photoreceptor cells, rods and cones, convert photons of light into chemical and electrical signals as the first step of the visual transduction cascade. Although the chemical processes in the phototransduction system are very similar to each other in these photoreceptors, the light sensitivity and time resolution of the photoresponse in rods are functionally different than those in the photoresponses of cones. To systematically investigate how photoresponses are divergently regulated in rods and cones, we have developed a detailed mathematical model on the basis of the Hamer model. The current model successfully reconstructed light intensity-, ATP- and GTP-dependent changes in concentrations of phosphorylated visual pigments (VPs), activated transducins (Tr*s) and phosphodiesterases (PDEs) in rods and cones. In comparison to rods, the lower light sensitivity of cones was attributed not only to the lower affinity of activated VPs for Trs but also to the faster desensitization of the VPs. The assumption of an intermediate inactive state, MIIi, in the thermal decay of activated VPs was essential for inducing faster inactivation of VPs in rods, and possibly also in cones.


Conflict of interest statement

The authors declare no competing interests.

Figures

Figure 1
Figure 1
Reaction scheme of visual phototransduction in rods and cones. (A) Visual phototransduction, including activation and inactivation of VP, Tr, and PDE, in rods and cones (see Table 2 for abbreviations). (B) Details of the phosphorylation reactions. Phosphorylation of VP at 3 sites in vitro (Figs. 2, 3, 4), where only 1 site in vivo (Fig. 5) was assumed. Phosphorylation reactions and Tr* elution indicated in light gray were not included. C, RGS9-dependent inactivation of Tr* and GC-dependent cGMP synthesis, depicted in dark gray, were added for simulating ICNG in Fig. 5.
Figure 2
Figure 2
Phosphorylation of visual pigments in rods and cones. (A) The time courses for the phosphorylation of VPs (the number of phosphate groups incorporated into an activated visual pigment molecule) measured in the membrane preparations of purified frog rod (a, circle) and carp cone (b, triangle) in response to light flash at 1.3% and 2.5%, respectively, in the experiments. The corresponding simulation results (dotted lines in a and b) are also shown in the figures. (B) Maximum rates of phosphorylation reaction per activated visual pigment at different flash intensities in rods (a, circle) and cones (b, circle), determined 10 s and 0.6 s after light stimuli, respectively (data modified from Tachibanaki et al.). Experimental results were fitted by the Michaelis–Menten equation (V/S = Vmax/(S + Km), solid lines). Simulated responses for both the carp rod (a, dotted line triangle) and cone (b, dotted line triangle) were superimposed onto the experimental results.
Figure 3
Figure 3
Transducin activation in rods and cones. (A) The time courses for Tr activation (the number of GTPγS molecule, a nonhydrolyzable GTP analog, incorporated per VP*) in the membrane preparations of purified carp rods and cones in response to light stimulation (0.0085% for rods (a, circle) and 0.25% for cones (b, circle)) in the presence (filled symbols) and absence (open symbols) of ATP (1 mM) as determined by biochemical experiments. Corresponding simulation results (dotted lines (−ATP) and dashed lines (+ ATP) in a and b were superimposed onto the experimental results. (B) Light-induced GTPγS binding as a function of flash intensity in rods (a, circle, after 40 s stimulation) and cones (b, circle, after 20 s stimulation) in the presence (filled symbols) and absence (open symbols) of ATP (0.1 mM) normalized to maximum values. Simulated results for rods (a, triangle) and cones (b, triangle) reproduced under corresponding experimental conditions in the presence (filled symbols) and absence (open symbols) of ATP are also shown in the figure. Values for the rate constants for VP phosphorylation, kRK1–kRK6 and kiRK1–kiRK6, were set to 0 for simulation of experimental results obtained without ATP.
Figure 4
Figure 4
PDE-mediated cGMP hydrolysis in rods and cones. (A) The time courses for PDE activities (the number of cGMP molecules hydrolyzed per VP*) in the membrane of carp rods and cones in response to light stimulations (a, 0.024% for rods (open circle); b, 0.46% for cones (open circle)) in the presence of ATP (0.25 mM), cGMP (2500 μM) and either GTP (open closed circle) or GTPγS (filled triangle) determined by biochemical experiments,). Corresponding simulation results (solid lines (with GTPγS) and dotted lines (with GTP) in a and b) were superimposed onto the experimental data. The continuous presence of saturating levels of cGMP was assumed for the simulation study, and thus βdark was set to 0. (B) Light-induced peak PDE activity as a function of flash intensity in rods (circle) and cones (triangle) either in the presence of ATP (a, 0.25 mM) or without ATP (b) and either GTP (open symbols) or GTPγS (filled symbols) are normalized to maximum values. Simulated PDE activity of the rods and cones reproduced under the corresponding experimental conditions (with either GTP (dotted lines) or GTPγS (solid lines)) were superimposed onto the experimental results. The value for the rate constant, kdecay, for cGMP hydrolysis was set to 0 for the simulation of the experimental results obtained with GTPγS.
Figure 5
Figure 5
ICNG in rods and cones. (A) [GTP]i-dependent ICNG recorded from a truncated outer segment of frog rods (circle), normalized to ICNG at 8 mM [GTP]i. Corresponding simulation results at steady-state were superimposed onto the experimental data (solid line). (B) Time courses of light-induced ICNG as a function of flash intensity recorded from the outer segments of the carp rods (light stimuli; 5.1E−6, 1.6E−5, 5.1E−5, 1.6E−4, and 5.1E−4%). Simulated ICNG for rods reproduced under the corresponding experimental conditions was superimposed onto the experimental results (dotted lines).
Figure 6
Figure 6
Histogram of phosphoryration related parameters of random test in rods. Histogram of phosphorylation related parameters of random test in rods are shown. The random test was performed by generating 21 uniform log linear distribution random number between 0.1 to 10.0 for phosphorylation related parameters (kRK1, kRK2, kRK3, kRK4, kRK5, kRK6, kRKi, k1, kG1, kG2, kG3, kG4, kG5, kG6, kG7, kP1, kP2, kP3, kP4, kdecay, kInact) and multiplied them to each parameter, and the resulting simulation data were evaluated by calculating difference between the control simulation data produced by the parameters in Table 3. This trial was performed for more than 780 M times, and the parameter set which produced results within 30% of the control data were selected (3970 trials), and the histogram of the random scale were plotted in the figure. Note that the parameters which showed concentrated distributions were selected and shown in the figure.
Figure 7
Figure 7
Histogram of phosphoryration related parameters of random test in cones. Histogram of phosphorylation related parameters of random test in cones are shown. See Fig. 6 caption for the experimental detail. The process was same with rods except the number of trials was more than 1G times, and the selected trial number was 1860.

Similar articles

Cited by

References

    1. Kawamura S, Tachibanaki S. Explaining the functional differences of rods versus cones. WIREs Membr. Transp. Signal. 2012;1:675–683.
    1. Kawamura S, Tachibanaki S. Phototransduction in rods and cones. In: Furukawa T, Hurley J, Kawamura S, editors. Vertebrate Photoreceptors. Springer; 2014. pp. 23–45.
    1. Fesenko EE, Kolesnikov SS, Lyubarsky AL. Induction by cyclic GMP of cationic conductance in plasma membrane of retinal rod outer segment. Nature. 1985;313:310–313. - PubMed
    1. Baylor DA. Photoreceptor signals and vision, proctor lecture. Investig. Ophthalmol. Vis. Sci. 1987;28:34–49. - PubMed
    1. Tachibana M, Kaneko A. l-glutamate-induced depolarization in solitary photoreceptors: A process that may contribute to the interaction between photoreceptors in situ. Proc. Natl. Acad. Sci. USA. 1988;85:5315–5319. - PMC - PubMed

MeSH terms