. 2022 Nov 14;5(1):1240.
doi: 10.1038/s42003-022-04213-y.

Model simulations unveil the structure-function-dynamics relationship of the cerebellar cortical microcircuit

Affiliations

Model simulations unveil the structure-function-dynamics relationship of the cerebellar cortical microcircuit

Robin De Schepper et al. Commun Biol. .

Abstract

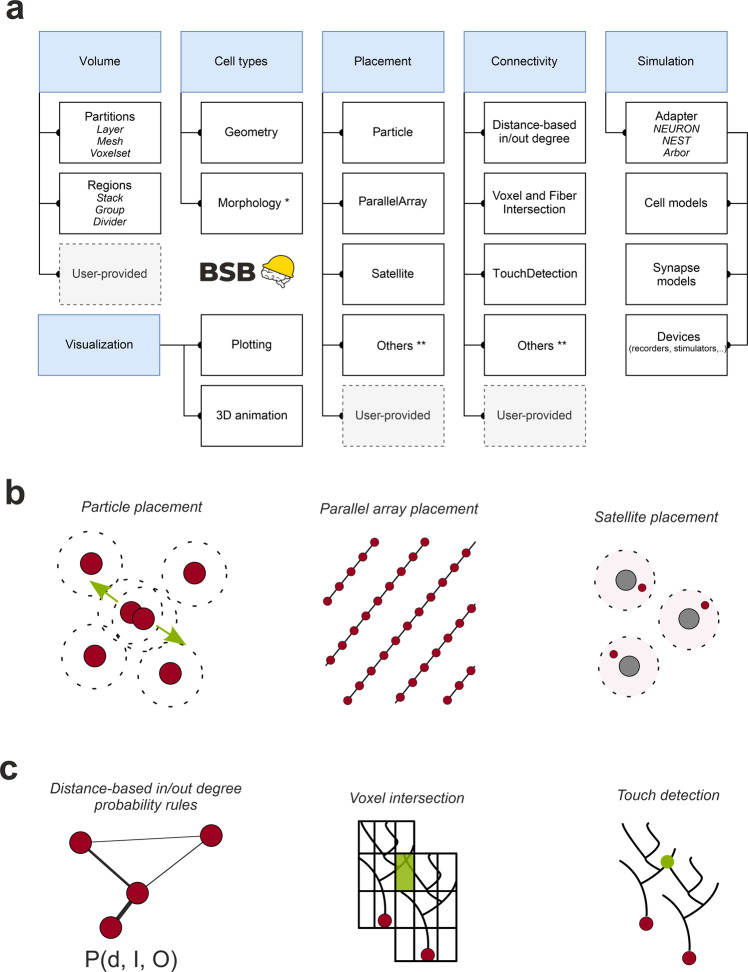
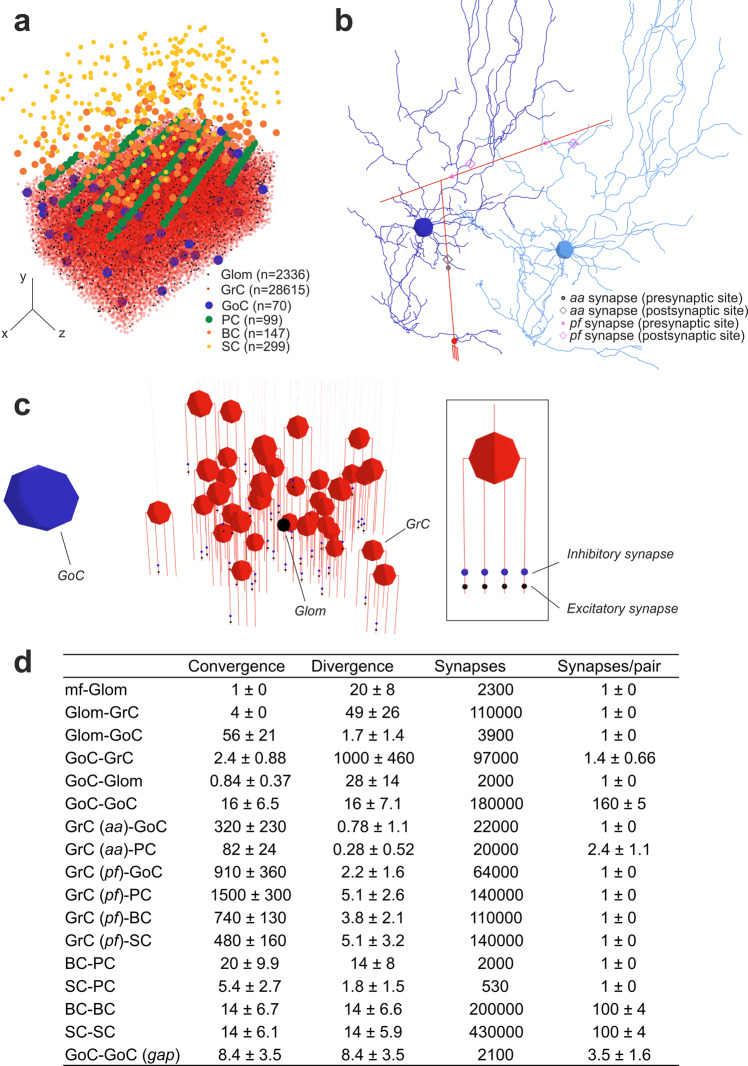
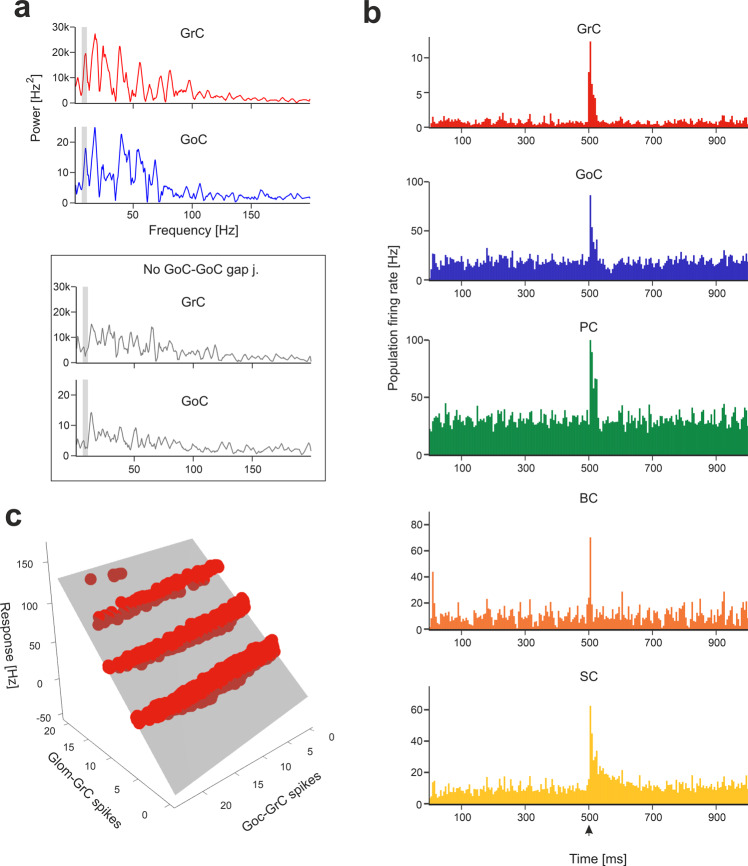
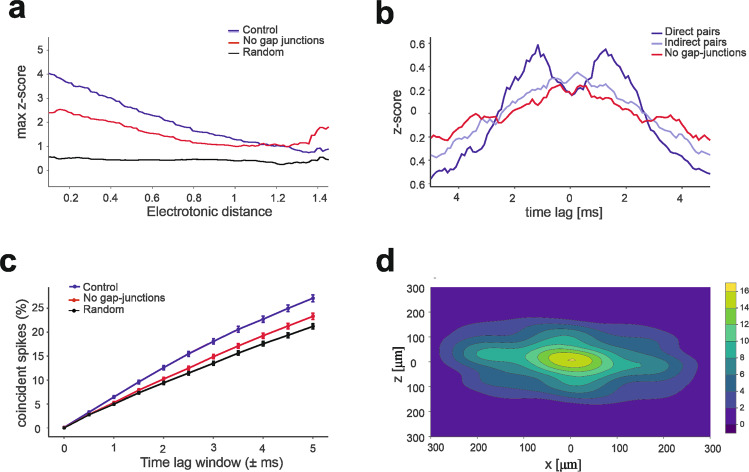
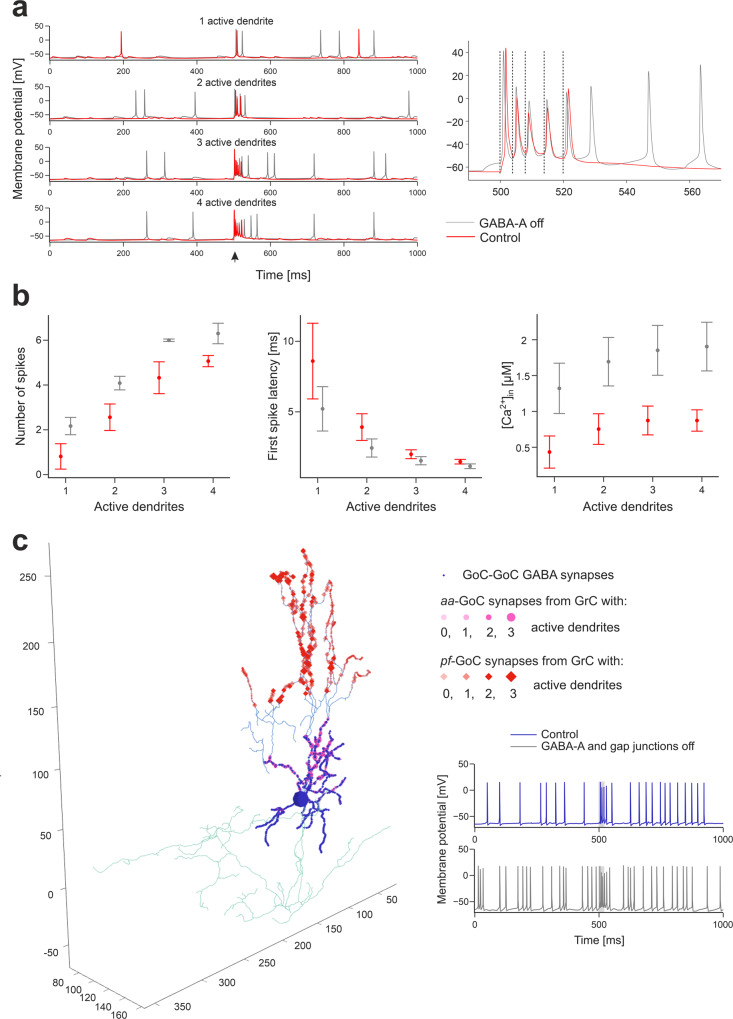
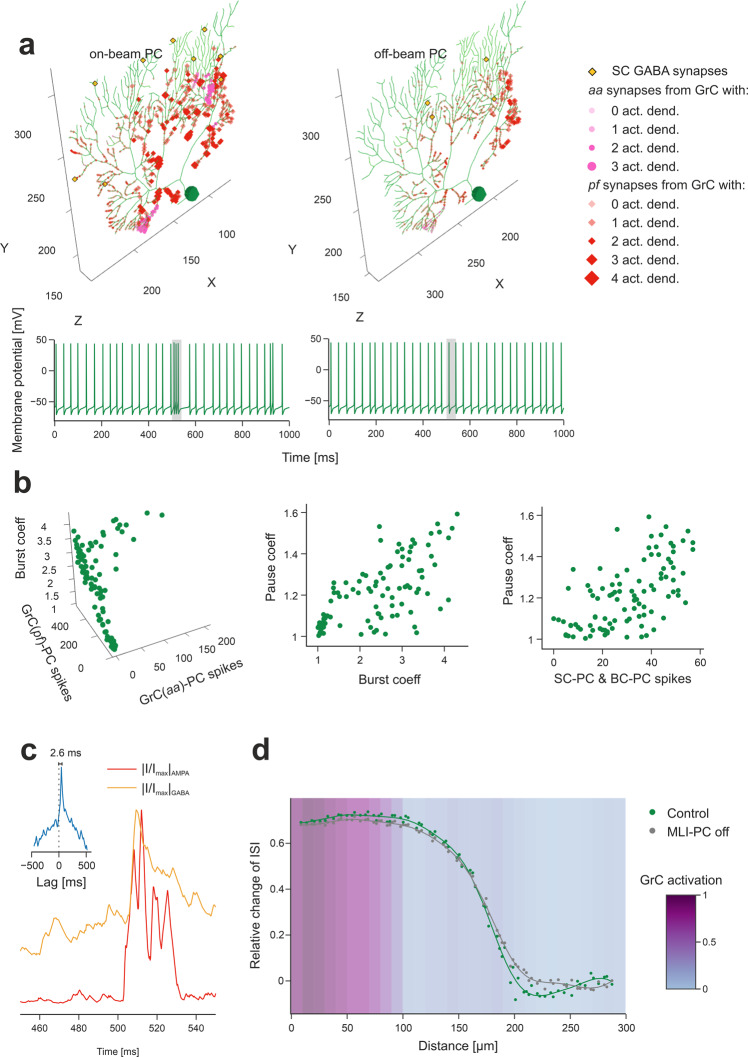
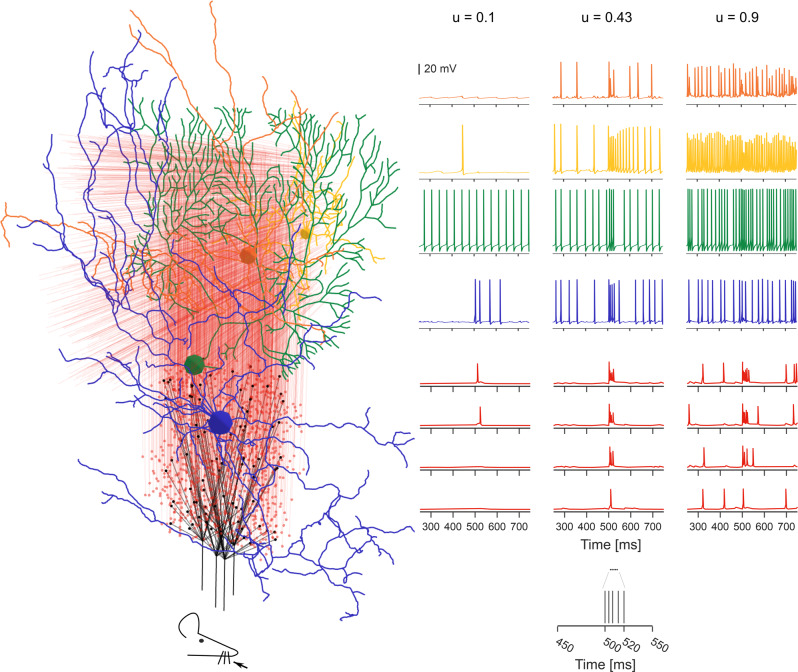
The cerebellar network is renowned for its regular architecture that has inspired foundational computational theories. However, the relationship between circuit structure, function and dynamics remains elusive. To tackle the issue, we developed an advanced computational modeling framework that allows us to reconstruct and simulate the structure and function of the mouse cerebellar cortex using morphologically realistic multi-compartmental neuron models. The cerebellar connectome is generated through appropriate connection rules, unifying a collection of scattered experimental data into a coherent construct and providing a new model-based ground-truth about circuit organization. Naturalistic background and sensory-burst stimulation are used for functional validation against recordings in vivo, monitoring the impact of cellular mechanisms on signal propagation, inhibitory control, and long-term synaptic plasticity. Our simulations show how mossy fibers entrain the local neuronal microcircuit, boosting the formation of columns of activity travelling from the granular to the molecular layer providing a new resource for the investigation of local microcircuit computation and of the neural correlates of behavior.


Conflict of interest statement

The authors declare no competing interests.

Figures

Fig. 1
Fig. 1. The Brain Scaffold Builder.
a Core BSB operations. In the reconstruction phase, BSB proceeds by sequentially defining the network volume, cell types, cell placement, cell connectivity. Once neurons and fibers are positioned, their geometries/morphologies are imported, and connection rules allow to wire them up and to build the network connectome. In the simulation phase, neuron and synapse models are linked to simulators, like NEURON in the present case, by a specific adapter and interfaced to a set of devices for stimulation and recording. In the post-simulation phase, graphic tools are made available for data representation. This workflow is applicable to any kind of brain neuronal network. b Infographic representations of the main placement strategies available in BSB, using kd-tree partitioning of the 3D space (particle placement, parallel array placement, satellite placement). c Infographic representations of the main connection strategies available in BSB: distance-based in/out degree probability functions, voxel (or fiber) intersection based on voxelization of morphologies, touch detection.
Fig. 2
Fig. 2. Reconstruction of the microcircuit of cerebellar cortex.
a Positioning of cell bodies in a 3D slab (300 × 295 x 200 μm3) of mouse cerebellar cortex. Cell numbers are indicated (the symbols reflect soma size). In this and the following figures, the xyz reference system is defined by x-y (sagittal plane), x-z (horizontal plane), z-y (coronal plane), as in standard anatomical representation. Thus, y measures cortex thickness (aa direction), while z identifies the major lamellar axis (pf direction). b Example of 3D morphologies illustrating GrC-GoC connections through aa and pf. One GrC and two GoCs are shown: the synapse along aa is identified by touch detection, while synapses along pf are identified by fiber intersection. c glom-GrC and GoC-GrC connections. A glom contacts a group of 38 GrCs forming an excitatory synapse on the terminal compartment of 1 of their 4 dendrites. The glom, in turn, is contacted by a GoC nearby, which forms an inhibitory synapse on the preterminal dendritic compartment of the same GrCs. The inset shows a GrC with 1 excitatory synapse and 1 inhibitory synapse on each dendrite. d The cerebellar cortical connectome generated by BSB reporting convergence (on the postsynaptic element), divergence (from the presynaptic element), total number of synapses, and number of synapses for each connected pair. It should be noted that mf-glom is not a proper synapse but just a branching.
Fig. 3
Fig. 3. Network responses to background noise and mf bursts.
a Power spectra of GrC and GoC activity are computed with Fast Fourier Transform (FFT) of spike time series (total population spike-counts in 2.5 ms time-bins). The periodicity of peaks in power spectra reveals synchronous low-frequency oscillations in the granular layer. The grey curves represent the power spectra when GoC-GoC gap junctions were disabled, showing a marked decrease in periodicity. The grey bands correspond to mouse theta-band (5-10 Hz). b The Peri-Stimulus-Time-Histograms (PSTH) of each neuronal population show the effect of the localized mf burst (onset indicated by arrowhead) emerging over background noise. The PSTHs show number of spikes/5 ms time-bins normalized by the number of cells, averaged over 10 simulations. c Example of multiple linear regression of GrC responses (firing rate) against the number of synaptic spikes from gloms and GoCs, during 40 ms after stimulus onset. The grey surface is the fitted plane to the points (each point corresponds to a GrC receiving the mf burst on at least 1 dendrite).
Fig. 4
Fig. 4. GoC millisecond synchronization by gap junctions.
a Maximum cross-correlation in pairs of Golgi cells as a function of electrotonic distance. The three curves represent control condition (4-Hz Poisson mossy fibre activity), with gap-junctions disabled, and with random spike patterns of GoCs. All values were calculated using a sliding window of + −0.2 electrotonic distance. At large electronic distances, the z-score in control conditions tends toward the value set by random input patterns. b The average cross-correlograms (0.5 ms bins) is calculated in control condition for GoC pairs at <100 μm distance with either direct coupling (n = 384), indirect coupling (n = 842), all pairs located <100 µm distance from each other when gap junctions were disabled when gap-junctions are disabled. The z-score shows two distinct peaks indicating GoC-GoC correlation with ms spike precision with on average 7.5 gap-junctions per direct pair. c The percentage of spikes that fall within distinct time-lag windows across all pairs located <100 µm distance in control condition, with gap-junctions disabled, and with random spike patterns of GoCs. Points are mean ± SEM (n = 1181). d Probability density of spike coincidence in the granular layer horizontal plane. This plot indicates that, with a GoC spike in [0,0], there is a certain probability that GoCs around it will fire a spike within a ± 5 ms time-window. The integral of the probability density function over the whole network corresponds to the average spike coincidence for the same time window in (c).
Fig. 5
Fig. 5. Granular layer activation.
a Membrane potential of 4 representative GrCs with 1 to 4 dendrites activated by the mf burst (20 ms@200 Hz over background noise, onset indicated by arrowhead), in control condition and after GABA-A receptors blockade (“GABA-A off”). The burst response of the GrC with 4 active dendrites is enlarged on the right to highlight spike-timing (dashed lines indicate the mf burst spikes). b Number of spikes (measured in the 40 ms from mf burst onset), first spike latency, and dendritic [Ca2+]in (measured in the 500 ms from mf burst onset) in subgroups of GrCs with the same number of activated dendrites (Ndend). Means ± sd are reported (n = 21068 with Ndend = 0, n = 2361 with Ndend = 1, n = 892 with Ndend = 2, n = 164 with Ndend = 3, n = 6 with Ndend = 4). The graphs compare responses in control and during “GABA-A off”. c Synapses of a GoC activated by GrCs. Bigger markers correspond to presynaptic GrCs more activated by the mf burst. The GABAergic synapses from other GoCs are on basolateral dendrites, aa synapses are on basolateral dendrites, pf synapses are on apical dendrites. In this example, the GoC receives 30% of its aa synapses and 6% of its pf synapses from GrCs with at least 2 active dendrites. Traces on the right show the GoC membrane potential in response to the mf burst (same stimulation as in (a), grey band) in control and during GABA-A receptors and gap junctions switch-off.
Fig. 6
Fig. 6. Purkinje cell activation.
a The PC placed on top of the GrC active cluster and the PC placed at its margin show different synaptic inputs. GABAergic synapses from SCs are on medium-thickness dendrites (those from BCs on PC soma are not shown), aa synapses are located on thin dendrites and pf synapses on thick dendrites. Bigger markers correspond to presynaptic GrCs more activated by the mf burst. In this example, the on-beam PC receives 23% of its aa synapses and 6% of its pf synapses from GrCs with at least 2 active dendrites, the off-beam PC 0% of its aa synapses and 0.6% of its pf synapses from GrCs with at least 2 active dendrites. The corresponding membrane potential traces are shown at the bottom (the 20 ms mf burst is highlighted by grey band). b Analysis of the burst-pause response of PCs to the mf burst (20 ms@200 Hz over background noise). The burst coefficient (i.e. the shortening of the inter-spike interval due to the mf burst, with respect to baseline) is reported against the number of spikes from aas and from pfs (multivariate regression analysis: R2 = 0.91). The pause coefficient (i.e. the elongation of the inter-spike interval after the mf burst response, with respect to baseline) is reported against either the burst coefficient (NMI = 0.79) or the number of spikes from SCs and BCs (NMI = 0.66). c Synaptic currents recorded from the PC on top of the GrC active cluster (same as in (a)), in voltage-clamp. The traces are the sum of all excitatory (AMPA) and inhibitory (GABA) dendritic currents during the mf burst. They are rectified, normalized and cross-correlated (inset) unveiling a GABA current lag of 2.6 ms with respect to AMPA current. d By stimulating a mf bundle (100 ms@50 Hz Poisson stimulation on 24 adjacent mfs), the PC response (modulation with respect to baseline) was quantified by the relative change of Inter-Spike-Interval (ISI), during the stimulus, where 0 corresponds to baseline. The two series of points compare PC response modulation when SCs and BCs were either connected (“control”) or disconnected from PCs (“MLI-PC off”). The curves are regression fittings to the points (Kernel Ridge Regression using a radial basis pairwise function, from Python scikit-learn library). The GrC active cluster (“GrC activation”) was identified by a threshold on the stimulation-induced activity by using kernel density estimation.
Fig. 7
Fig. 7. Molecular layer interneurons modulate PC discharge.
Raster plots of PC spikes following an impulse on a bundle of 13 mfs (time 0) in (a) control condition and in (b) KO condition, in which GABAA receptors are blocked from PCs to uncover the neural correlates of dysfunctional VOR adaptation in the PC-Δγ2 KO mouse line (c) Probability density functions of spike count (time bins of 0.2 ms) in the 10-ms window following stimulation in the two conditions. Note the more scattered firing response in KO condition.
Fig. 8
Fig. 8. pf-PC plasticity modulates PC discharge.
The scheme on top shows the simulation protocol that emulates an EBCC paradigm, in which a conditioned stimulus (CS) is delivered to the mfs. Our simulations reproduce the final state (“post-learning”) by exploring multiple levels of pf-PC LTD. The relationship between these LTD levels and PC firing modulation (relative to “pre-learning” state with 0% LTD) is shown. The points are mean ± SEM across all PCs (n = 99). Two representative traces illustrating PC discharge are shown for 0% LTD and 35% LTD in the insets.
Fig. 9
Fig. 9. Activation of a vertical neuronal column in the cerebellar cortex.
A whisker air-puff stimulus (the mf burst) is delivered to 4 adjacent mfs, which branch in 4 glom clusters. GrCs respond rapidly with a burst when at least 2 dendrites are activated. A GrC dense cluster is formed and the signal propagates up through an aa bundle and transversally along a pf beam. GoCs receive the signal both on basolateral and apical dendrites. PCs vertically on top of the active cluster are invested by aa and pf synaptic inputs. On-beam SCs and BCs receive signals through pf synapses; SC axons inhibit mainly on-beam PCs, while BC axons inhibit mainly off-beam PCs. The membrane potential traces (mf burst starts at 500 ms) are shown for each neuronal population. Traces in the three columns correspond to three different release probabilities at the mf-GrC synapses: u = 0.1, u = 0.43 (control condition used in the rest of the paper), u = 0.9. The lower and higher u-values are typical of long-term synaptic depression and potentiation in the granular layer.

Similar articles

Cited by

References

    1. Arbib MA, Érdi P. Precis of neural organization: Structure, function, and dynamics. Behav. Brain Sci. 2000;23:513–533. - PubMed
    1. D’Angelo E, Gandini Wheeler-Kingshott C. Modelling the brain: Elementary components to explain ensemble functions. Riv. del. nuovo Cim. 2017;40:273–333.
    1. Amunts K, et al. The Human Brain Project—Synergy between neuroscience, computing, informatics, and brain-inspired technologies. PLoS Biol. 2019;17:e3000344. - PMC - PubMed
    1. Markram H, et al. Reconstruction and Simulation of Neocortical Microcircuitry. Cell. 2015;163:456–492. - PubMed
    1. Brette R, et al. Simulation of networks of spiking neurons: A review of tools and strategies. J. Comput Neurosci. 2007;23:349–398. - PMC - PubMed

Publication types