. 2022 Nov 14;5(1):1247.
doi: 10.1038/s42003-022-04194-y.

Disentangling five dimensions of animacy in human brain and behaviour

Affiliations

Disentangling five dimensions of animacy in human brain and behaviour

Kamila M Jozwik et al. Commun Biol. .

Abstract

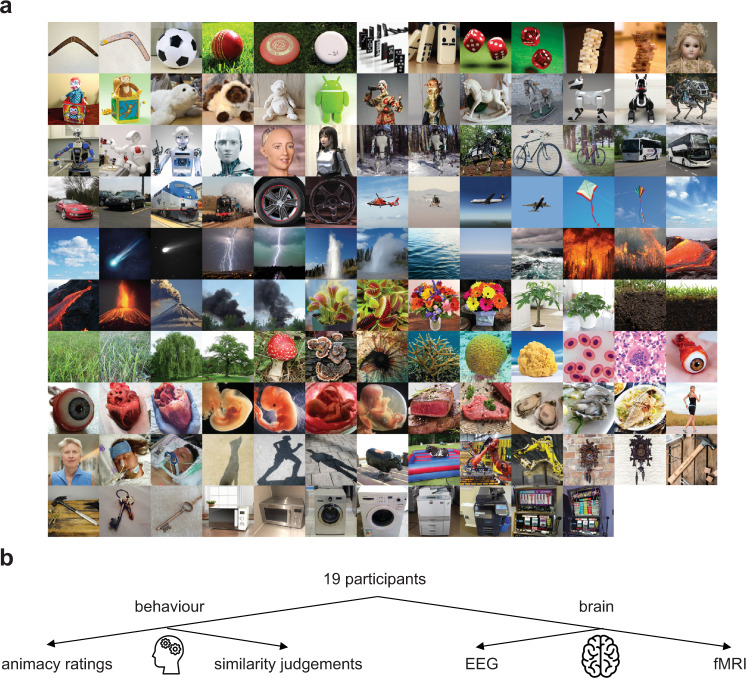
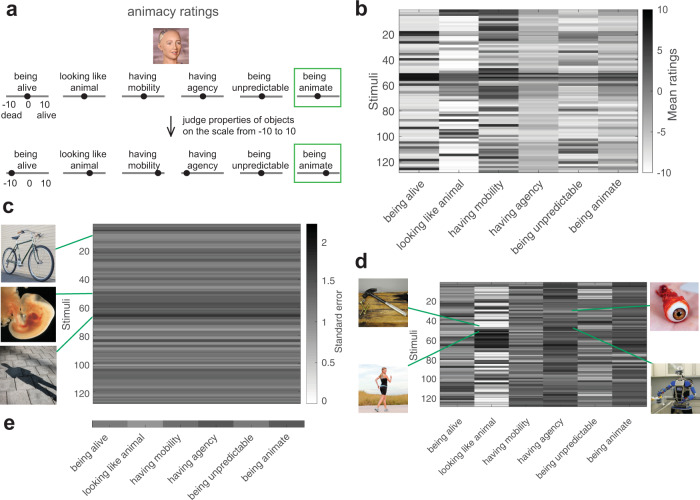
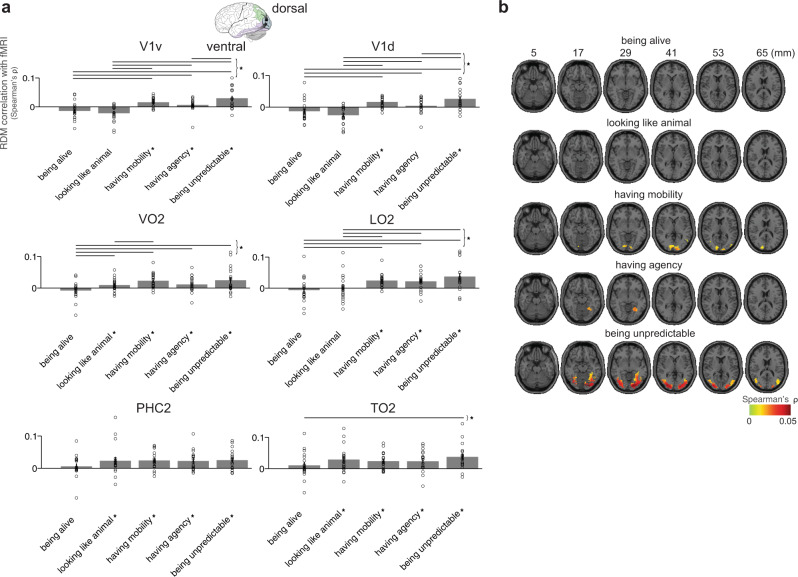
Distinguishing animate from inanimate things is of great behavioural importance. Despite distinct brain and behavioural responses to animate and inanimate things, it remains unclear which object properties drive these responses. Here, we investigate the importance of five object dimensions related to animacy ("being alive", "looking like an animal", "having agency", "having mobility", and "being unpredictable") in brain (fMRI, EEG) and behaviour (property and similarity judgements) of 19 participants. We used a stimulus set of 128 images, optimized by a genetic algorithm to disentangle these five dimensions. The five dimensions explained much variance in the similarity judgments. Each dimension explained significant variance in the brain representations (except, surprisingly, "being alive"), however, to a lesser extent than in behaviour. Different brain regions sensitive to animacy may represent distinct dimensions, either as accessible perceptual stepping stones toward detecting whether something is alive or because they are of behavioural importance in their own right.


Conflict of interest statement

The authors declare no competing interests.

Figures

Fig. 1
Fig. 1. Stimulus-selection procedure and pairwise correlation between animacy dimensions before and after stimulus selection by the genetic algorithm.
a First, we created an animacy grid with all dimensions of animacy combinations and asked 11 participants to fill in the names of objects that fulfilled these combinations. Second, we assembled object images based on object names from step one. Third, an independent set of 26 participants performed animacy ratings of 300 of these object images. Finally, we selected an optimal set of stimuli that had a low correlation between dimensions (as behaviourally rated) using a genetic algorithm. These stimuli were used in behavioural and brain representation experiments where a new set of participants was recruited to make sure that the stimulus generation and the actual experiments were independent. b Pairwise correlation between animacy dimensions for the randomly selected 128 stimuli (left) and the 128 stimuli selected by the genetic algorithm (right) in behavioural ratings.
Fig. 2
Fig. 2. Stimulus set and study overview.
a The genetic-algorithm driven stimulus set consisted of 128 images decorrelated on dimensions of animacy. The stimuli were coloured images of sport equipment, games, robots, dolls and puppets, plush toys, land vehicles, air vehicles, plants, forces of nature (water, air, fire, smoke), sea organisms, cells, organs and fetuses, humans, food, kitchen and office equipment, shadows. b Study overview. All 19 participants performed two behavioural studies: animacy ratings and similarity judgements, and two brain response measurement studies: EEG (to access temporal information) and fMRI (to access spatial information). Importantly, participants first performed EEG and fMRI studies, then similarity judgements and finally animacy ratings. This experimental order was to ensure that participants did not know about animacy dimensions tested until the final animacy ratings.
Fig. 3
Fig. 3. Animacy ratings and their consistency with examples of images judged consistently and not very consistently.
a Illustration of animacy ratings. Participants judged each object image using a continuous scale from −10 to +10 for each animacy dimension, e.g., −10 meant “dead” and +10 meant “alive” for the “being alive” dimension. Additionally, participants performed a rating of “being animate” dimension in a similar fashion. b Mean ratings of each animacy dimension and stimulus across 19 participants. c Consistency of each stimulus in animacy ratings across participants (standard error of the mean) with examples of stimuli with varying values of standard error. d Consistency of each animacy dimension and stimulus in animacy ratings across participants with examples of stimuli with varying values of standard error for the most consistently judged (“looking like an animal”) and the least consistently judged (“having agency”) dimensions. e Consistency of each animacy dimension in animacy ratings across participants (standard error of the mean).
Fig. 4
Fig. 4. Dimensions of animacy and animacy ratings.
a Order of images with lowest and highest ratings on each animacy dimension. Out of 128 images, we show ten lowest and ten highest rated images on each animacy dimension. b Animacy dimension representational dissimilarity matrices (RDMs) comparisons with animacy ratings (“being animate”) RDMs. Bars show the correlation between the animacy ratings RDMs and each animacy dimension RDM of 19 participants. A significant correlation is indicated by an asterisk (one-sided Wilcoxon signed-rank test, p < 0.05 corrected). Error bars show the standard error of the mean based on single-participant correlations, i.e., correlations between the single-participant animacy ratings RDMs and animacy dimension RDM. Circles show single-participant correlations. The grey bar represents the noise ceiling, which indicates the expected performance of the true model given the noise in the data. Horizontal lines show significant pairwise differences between model (here dimensions of animacy) performance (p < 0.05, FDR corrected across all comparisons), an asterisk to the right of horizontal lines indicates their significance. c Unique variance of each animacy dimension in explaining animacy ratings computed using a general linear model (GLM). For each animacy dimension m, the unique variance was computed by subtracting the total variance explained by the reduced GLM (excluding the dimension of interest) from the total variance explained by the full GLM. Specifically, for dimension m, we fit GLM on X = “all dimensions but m” and Y = data, then we subtract the resulting R2 from the total R2 (fit GLM on X = “all dimensions” and Y = data). We used non-negative least squares to find optimal weights. A significant unique variance is indicated by an asterisk (one-sided Wilcoxon signed-rank test, p < 0.05 corrected). The error bars show the standard error of the mean based on single-participant unique variance. Circles show single-participant unique variance. Horizontal lines show significant pairwise differences between model performance (p < 0.05, FDR corrected across all comparisons), an asterisk to the right of horizontal lines indicates their significance.
Fig. 5
Fig. 5. Dimensions of animacy and similarity judgements.
a Similarity judgements multiarrangement task. During this task, object images were shown on a computer screen in a circular arena, and participants were asked to arrange the objects according to their similarity, such that similar objects were placed close together and dissimilar objects were placed further apart. Participants performed multiple arrangements of subsets of the images, enabling us to estimate the underlying perceptual similarity space (see Methods for details). b Multidimensional scaling plot of similarity judgements (mean across 19 participants, with metric stress criterion). c Animacy dimension RDM comparisons with similarity judgements RDMs. Bars show the correlation between the similarity judgements RDMs and each animacy dimension RDM. A significant correlation is indicated by an asterisk (one-sided Wilcoxon signed-rank test, p < 0.05 corrected). Error bars show the standard error of the mean based on single-participant correlations, i.e., correlations between the single-participant similarity judgements RDMs and animacy dimension RDM. Circles show single-participant correlations. The grey bar represents the noise ceiling, which indicates the expected performance of the true model given the noise in the data. Horizontal lines show significant pairwise differences between model performance (p < 0.05, FDR corrected across all comparisons), an asterisk to the right of horizontal lines indicates their significance. d Unique variance of each animacy dimension in explaining similarity judgements. For each animacy dimension m, the unique variance was computed by subtracting the total variance explained by the reduced GLM (excluding the dimension of interest) from the total variance explained by the full GLM. Specifically, for dimension m, we fit GLM on X = “all dimensions but m” and Y = data, then we subtract the resulting R2 from the total R2 (fit GLM on X = “all dimensions” and Y = data). We used non-negative least squares to find optimal weights. A significant unique variance is indicated by an asterisk (one-sided Wilcoxon signed-rank test, p < 0.05 corrected). The error bars show the standard error of the mean based on single-participant unique variance. Circles show single-participant unique variance. Horizontal lines show significant pairwise differences between model performance (p < 0.05, FDR corrected across all comparisons), an asterisk to the right of horizontal lines indicates their significance.
Fig. 6
Fig. 6. Dimensions of animacy and EEG time course.
a Mean decoding curve across 19 participants (pairwise stimuli decoding using a support vector machine approach). Significant decoding is indicated by a horizontal line above the graph (one-sided Wilcoxon signed-rank test, p < 0.05 corrected) and starts at 43 ms (+/−2 ms, standard error) with a peak latency of 197 ms (+/−7 ms, standard error, indicated by an arrow). The shaded area around the lines shows the standard error of the mean based on single-participant decoding. The grey horizontal bar on the x axis indicates the stimulus duration. b Animacy dimension RDM comparison with EEG RDMs across time. Lines show the correlation between the EEG RDMs and each animacy dimension RDM. A significant correlation is indicated by a horizontal line above the graph (one-sided Wilcoxon signed-rank test, p < 0.05 corrected). The grey horizontal bar on the x-axis indicates the stimulus duration. c Unique variance of each animacy dimension in explaining EEG RDMs computed using a GLM. For each animacy dimension, the unique variance is computed by subtracting the total variance explained by the reduced GLM (excluding the animacy dimension of interest) from the total variance explained by the full GLM, using non-negative least squares to find optimal weights. A significant unique variance (between 237 and 301 ms) is indicated by a horizontal line above the graph (one-sided Wilcoxon signed-rank test, p < 0.05 corrected). The grey horizontal bar on the x axis indicates the stimulus duration.
Fig. 7
Fig. 7. Dimensions of animacy and fMRI responses.
a Animacy dimension RDM comparisons with fMRI ROI RDMs of 19 participants. Bars show the correlation between each animacy dimension RDM with fMRI ROI RDMs. We selected ROIs across the ventral (V1v, VO2, PHC2) and dorsal (V1d, LO2, TO2) visual streams. A significant correlation is indicated by an asterisk (one-sided Wilcoxon signed-rank test, p < 0.05 corrected). Error bars show the standard error of the mean based on single-participant correlations, i.e., correlations between the single-participant ROI RDMs and animacy dimension RDM. Circles show single-participant correlations. Horizontal lines show significant pairwise differences between model performance (p < 0.05, FDR corrected across all comparisons), an asterisk to the right of horizontal lines indicates their significance. b Searchlight analysis with each animacy dimension showing where in the brain animacy dimensions explain image representations masked with the visual stream regions (Spearman’s ρ between animacy dimension and brain representations, one-sided Wilcoxon signed-rank test, FDR controlled at 0.05).

Similar articles

Cited by

References

    1. Kriegeskorte N, et al. Matching categorical object representations in inferior temporal cortex of man and monkey. Neuron. 2008;60:1126–41. doi: 10.1016/j.neuron.2008.10.043. - DOI - PMC - PubMed
    1. Blumenthal A, Stojanoski B, Martin CB, Cusack R, Köhler S. Animacy and real‐world size shape object representations in the human medial temporal lobes. Hum. Brain Mapp. 2018;39:3779–3792. doi: 10.1002/hbm.24212. - DOI - PMC - PubMed
    1. Funnell E, Sheridan J. Categories of knowledge? unfamiliar aspects of living and nonliving things. Cogn. Neuropsychol. 2007;9:135–153. doi: 10.1080/02643299208252056. - DOI
    1. Ralph MAL, Howard D, Nightingale G, Ellis AW. Are living and non-living category-specific deficits causally linked to impaired perceptual or associative knowledge? Evidence from a category-specific double dissociation. Neurocase. 1998;4:311–338. doi: 10.1080/13554799808410630. - DOI
    1. Silveri MC, et al. Naming deficit for non-living items: neuropsychological and PET study. Neuropsychologia. 1997;35:359–367. doi: 10.1016/S0028-3932(96)00084-X. - DOI - PubMed

Publication types