. 2022 Nov;54(11):1955-1966.
doi: 10.1038/s12276-022-00880-3. Epub 2022 Nov 14.

Induction of Nanog in neural progenitor cells for adaptive regeneration of ischemic brain

Affiliations

Induction of Nanog in neural progenitor cells for adaptive regeneration of ischemic brain

Gyung-Ah Jung et al. Exp Mol Med. 2022 Nov.

Abstract

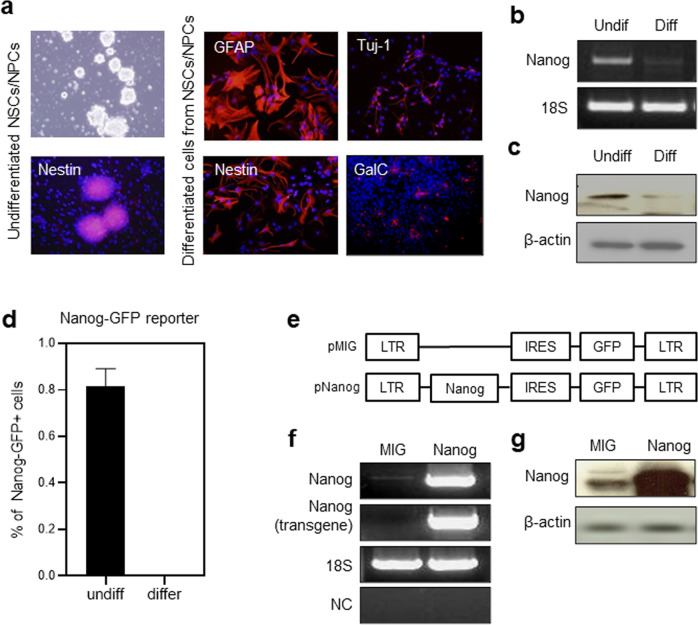
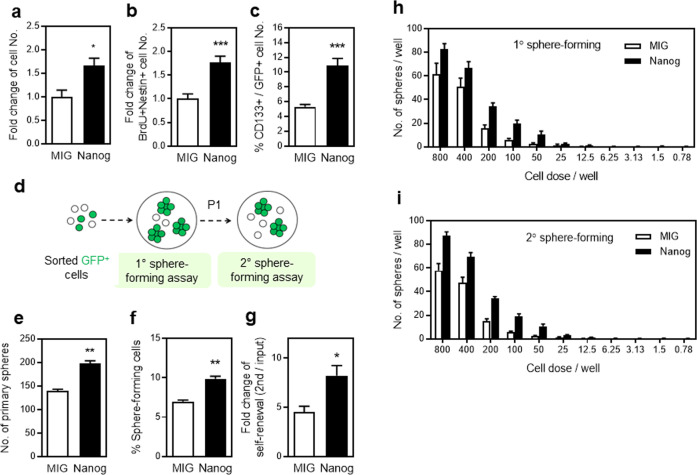
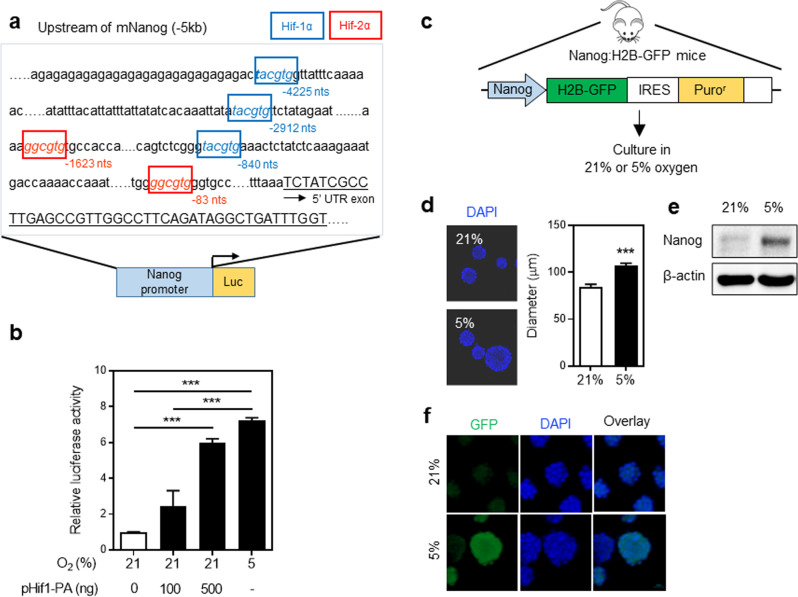
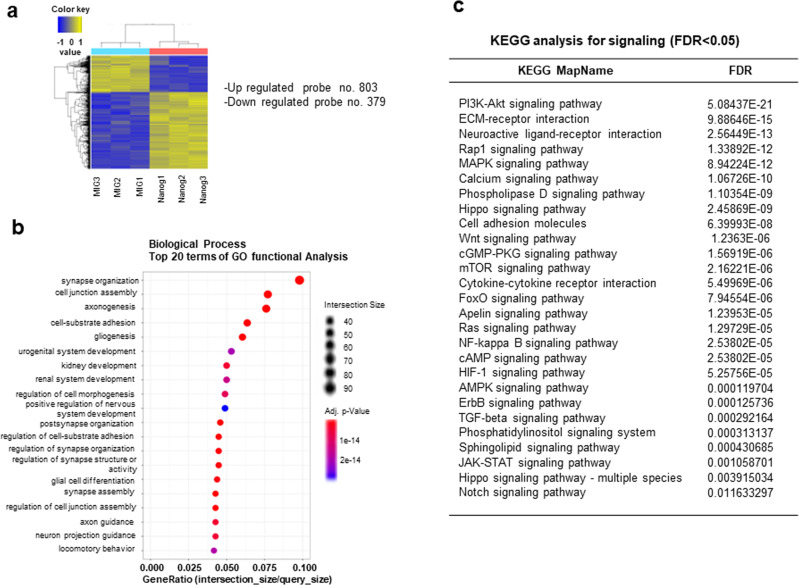
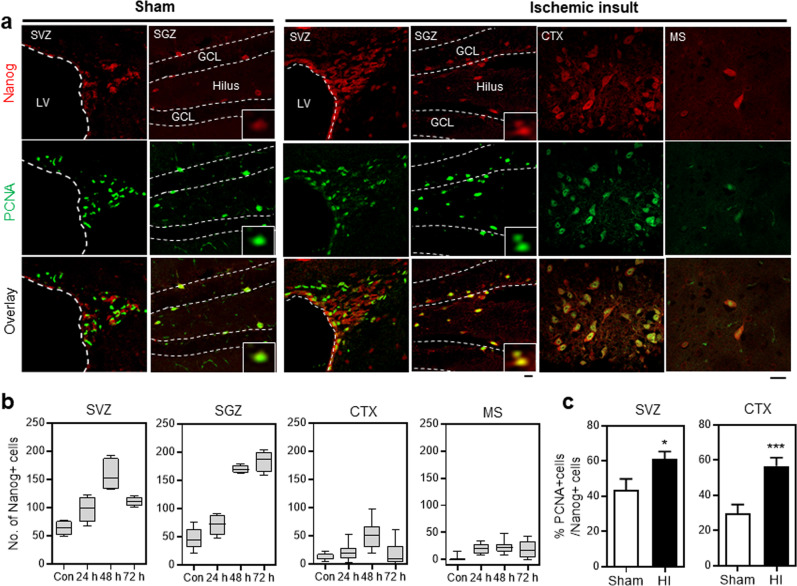
NANOG plays a key role in cellular plasticity and the acquisition of the stem cell state during reprogramming, but its role in the regenerative process remains unclear. Here, we show that the induction of NANOG in neuronal cells is necessary for the physiological initiation of neuronal regeneration in response to ischemic stress. Specifically, we found that NANOG was preferentially expressed in undifferentiated neuronal cells, and forced expression of Nanog in neural progenitor cells (NPCs) promoted their self-renewing expansion both in ex-vivo slice cultures and in vitro limiting dilution analysis. Notably, the upstream region of the Nanog gene contains sequence motifs for hypoxia-inducible factor-1 alpha (HIF-1α). Therefore, cerebral neurons exposed to hypoxia significantly upregulated NANOG expression selectively in primitive (CD133+) cells, but not in mature cells, leading to the expansion of NPCs. Notably, up to 80% of the neuronal expansion induced by hypoxia was attributed to NANOG-expressing neuronal cells, whereas knockdown during hypoxia abolished this expansion and was accompanied by the downregulation of other pluripotency-related genes. Moreover, the number of NANOG-expressing neuronal cells were transiently increased in response to ischemic insult, predominantly in the infarct area of brain regions undergoing neurogenesis, but not in non-neurogenic loci. Together, these findings reveal a functional effect of NANOG-induction for the initiation of adaptive neuronal regeneration among heterogeneous NPC subsets, pointing to cellular plasticity as a potential link between regeneration and reprogramming processes.


Conflict of interest statement

The authors declare no competing interests.

Figures

Fig. 1
Fig. 1. Expression of the NANOG in neuronal cells.
a Immunostaining of neurospheres before and after differentiation induction. Undifferentiated E12.5 NPCs in sphere form and their differentiated cells were validated by immunostaining for NESTIN (undifferentiated), GFAP (astrocyte), TUJ1 (neuron), and GalC (oligodendrocyte). b, c Selective expression of NANOG in undifferentiated NPCs. NPCs in neurospheres or differentiated cells were analyzed for expression of Nanog in transcript and protein products. Shown are the representative profiles for RT-PCR analysis (b) and immunoblotting of the NANOG protein (c). d Selective expression of NANOG in undifferentiated cells as determined by Nanog reporters (Nanog-GFP). NPCs obtained from the brains of transgenic mice (Nanog-GFP) on E12.5 were similarly induced to differentiate, and the frequency of NANOG-expressing (GFP+) cells was determined by flow cytometry (n = 6). e–g Establishment of NANOG-overexpressing NPCs. A schematic illustration of the retroviral vector (e), verification of transgenic expression of Nanog in these cells using RT‒PCR (f) and immunoblots showing the protein products (g) in cells transduced with a control vector (MIG) and vectors encoding Nanog. Nanog (transgene): PCR products based on primers for the MIG vector; NC negative control.
Fig. 2
Fig. 2. Effects of NANOG overexpression on self-renewal of NPCs.
ac NPCs transduced with a control or Nanog-expressing vector were compared with respect to expansion as measured by total cell number (a) (n = 3, *p < 0.05), the fold expansion of undifferentiated NPCs determined by numbers of BrdU+NESTIN+ cells (b) (n = 6, ***p < 0.001) and frequencies of undifferentiated (CD133+) cells among the transduced cell (GFP+) population (c) (n = 5, ***p < 0.001). dg Effects of NANOG expression on the self-renewal of neurosphere-forming cells were determined by comparing the frequency of sphere-forming cells in the primary and secondary subcultures of each transduced NPC (GFP+). An illustration of the experimental scheme is shown (d), and the numbers of primary spheres among the initially seeded plated cells (2 × 103 cells), (e) (n = 3, **p < 0.01), the percentage (%) of sphere-forming cells (f) (n = 3, **p < 0.01), and the fold increase in sphere-forming cells during primary and secondary culture (g) are shown (n = 3, *p < 0.05). h, i Limiting dilution analysis of neurosphere-forming cells during subculture. NPCs were plated in serial dilutions and the resulting numbers of spheres in each dose were determined in primary culture (h) (n = 5) and secondary subcultures (i) (n = 10).
Fig. 3
Fig. 3. Effects of NANOG expression on NPCs under organotypic spinal cord slice culture conditions.
Effects of NANOG expression on NPCs were examined in a spinal cord slice culture model that mimics the in vivo microenvironment. a Schematic illustration showing the experiment. After transduction with viral vectors, cells were pulse-labeled with BrdU and sort-purified for transplantation of transduced (GFP+) cells in organotypic spinal cord slices for 7 days. b Representative flow cytometry profiles for purification of transduced neuronal cells and their transplantation into organotypic spinal cord slices. c Numbers of BrdU+NESTIN+ neuronal cells were compared between MIG- and Nanog-transduced cells after 7 days of culture (n = 3, **p < 0.01). d NESTIN+ cells were examined for relative % of highly proliferating (low BrdU intensity) and slow proliferating (high BrdU intensity) cells by immunostaining with an antibody against NESTIN and BrdU (n = 3, *p < 0.05, **p < 0.01). e, f Differentiation pattern of NANOG-expressing NPCs in organotypic spinal cord slice cultures. The transplanted cells were double stained for each lineage marker and BrdU. Representative profiles showing NESTIN and TUJ1 and the relative distribution of differentiated cells of each lineage are shown (f) (n = 3, *p < 0.05).
Fig. 4
Fig. 4. Hypoxia induces NANOG production in neuronal cells.
a Structure of the Nanog promoter/upstream region. Shown is the upstream sequence of the Nanog gene and the consensus sequence for HIF-1α (blue box) and HIF-2α (red box) binding, along with the structure of the Nanog reporter expressing the luciferase gene. b Transactivation of the Nanog promoter by hypoxia. E12.5 NPCs were transfected with the Nanog-luciferase reporter and exposed to normoxia (21% O2) or hypoxia (5% O2) or cotransfected with the indicated amounts of constitutively activated Hif-1α (pHif-1-PA). The luciferase activity was normalized on the basis of the β-galactosidase activity level. The relative luciferase activities are shown (n = 4, ***p < 0.001). c Transgenic mice carrying the Nanog gene reporter. Schematic showing the structure of the transgenic reporter gene with GFP expression driven by the Nanog promoter. df Effects of hypoxia on the transgenic expression of Nanog in transgenic mice. d The effects of hypoxia on neurosphere size. A representative picture (left panel) and the mean ± SEM showing the diameter of 115 neurospheres (right panel) (***p < 0.001). e, f Induction of Nanog expression by hypoxia in neuronal cells was analyzed by immunoblot analysis using an antibody against NANOG (e) and immunofluorescent staining for GFP in neurospheres (f).
Fig. 5
Fig. 5. Contribution of NANOG-expressing cells to a hypoxia-induced expansion of NPCs.
NPCs from transgenic mice (Nanog:H2B-GFP) were exposed to normoxia or hypoxia and expansion of NANOG-expressing (GFP+) and non-expressing (GFP) cells were analyzed along with expression of CD133. a, b Increase of NANOG-expressing cells in response to hypoxia among differentiated (CD133) and undifferentiated (CD133+) neuronal cells. Representative images showing immunofluorescent staining (a) and the percentage (%) of NANOG-expressing (GFP+) cells after expansion for 3 days (b) (n = 4, *p < 0.05). c Comparison between the hypoxia-induced expansion of NANOG-expressing and non-expressing cells (n = 3, **p < 0.01). d Contribution of GFP (+) and GFP (−) cells to the hypoxia-induced expansion of NPCs. Three days after culture under normoxic or hypoxic conditions, the increase in cell number compared to the input cell numbers was measured along with the relative percentage (%) of GFP (+) in the expanded cells. Shown are the expansion folds of NPCs under each condition relative to the input cell numbers with % of GFP (+) cells in each expanded cell population marked in green (n = 4, **p < 0.01).
Fig. 6
Fig. 6. Effects of Nanog knockdown on hypoxia-induced expansion and differentiation of NPCs.
a Influence of Nanog KD on the hypoxia-induced expansion of NPCs. The fold expansion of control and sh-Nanog-expressing cells in response to hypoxic stimuli is shown (n = 6, *p < 0.05). b A limiting dilution assay with Nanog-KD NPCs. Transduced (EGFP+) cells were seeded at 1–200 cells/well and cultured for 3 days under 5% O2 or 21% O2 conditions. The percentage of the sphere-positive well was calculated by the number of well that existed in the sphere over 50 µm (n = 5). cf Lineage analysis of NPCs transduced with sh-Nanog. After culture under normoxic or hypoxic conditions, transduced (EGFP+) cells were sorted and stained for the indicated lineage markers. Shown are the % numbers of cells positively stained for each indicated marker under normoxic and hypoxic conditions (n = 10–19 for each lineage, *p < 0.05, **p < 0.01, ***p < 0.001) (c) and representative immunostaining images showing NESTIN, MAP2, and TUJ1 (e, f). g Concomitant downregulation of pluripotency genes with KD of Nanog. The immunoblot analysis for each indicated pluripotency gene in control and sh-Nanog-transduced neuronal cells under hypoxic culture conditions is shown.
Fig. 7
Fig. 7. Transcriptome changes induced by overexpression of Nanog in NPCs.
NPCs obtained from the cerebellum of postnatal day 4 mice were transduced with Nanog using a retroviral vector (MIG). Five days after transduction, RNA was purified and subjected to transcriptome analysis by RNA-seq and subjected to by Gene Ontology and KEGG analysis. a Heatmap showing two-way hierarchical clustering analysis (Euclidean method, complete linkage). Differentially expressed genes (DEGs) were classified by lpe.p < 0.05 and fold change >1.5 between three batches of control (MIG 1–3) and Nanog-transduced cells (Nanog 1–3) (n = 3). b Results of the 20 most enriched terms in the GO functional biological process analysis. Each enriched GO term is shown with adjusted p values and the intersection size (gene ratio). c KEGG pathway analysis of DEGs between MIG- and Nanog-transduced cells. Significantly (FDR <0.05) enriched signaling pathways are shown.
Fig. 8
Fig. 8. Transient induction of NANOG in brain regions undergoing neurogenesis in response to ischemic insult.
Ischemic insult in mice was induced by ligation of the right common carotid artery and exposure to a hypoxic chamber. The spatial distribution of NANOG-expressing cells in mouse brains near the infarct area was examined along with sham-operated mice 24, 48, and 72 h after ischemic insult. a Images of immunofluorescence staining of the brain 48 h after hypoxic insult (HI) or sham operation. High-magnitude images of NANOG-expressing cells are displayed in inlets. b The numbers of NANOG-expressing cells were counted in each indicated region on day 24, 48 and 72 h after ischemic insult. The numbers of NANOG (−) cells, with upper and lower margins of the boxes representing 75 and 25% of the value, with horizontal bars representing the mean values (n = 8 and 4 for control and HI, respectively, for SVZ and SGZ regions, n = 8 and 16 for control and HI, respectively, for CTX and MS regions) are shown. Scale bar = 20 μm. c Proliferative activity of NANOG-expressing neuronal cells. The brain regions were costained for PCNA and NANOG in an analysis of the proliferation of NANOG-expressing cells. The percentage (%) of proliferating (PCNA+) cells among the NANOG-expressing cell population in mouse brains exposed to ischemic insult compared to the corresponding brain regions in sham-operated mice (n = 12 for SVZ, n = 11 for CTX, *p < 0.05, ***p < 0.001). Scale bar = 20 μm. SVZ subventricular zone, SGZ subgranular zone, CTX cerebral cortex, MS medial septum.

Similar articles

Cited by

References

    1. Alvarez-Buylla A, Herrera DG, Wichterle H. The subventricular zone: source of neuronal precursors for brain repair. Prog. Brain Res. 2000;127:1–11. - PubMed
    1. Arvidsson A, Collin T, Kirik D, Kokaia Z, Lindvall O. Neuronal replacement from endogenous precursors in the adult brain after stroke. Nat. Med. 2002;8:963–970. - PubMed
    1. Parent JM. Injury-induced neurogenesis in the adult mammalian brain. Neuroscientist. 2003;9:261–272. - PubMed
    1. Ma DK, Ming GL, Song H. Glial influences on neural stem cell development: cellular niches for adult neurogenesis. Curr. Opin. Neurobiol. 2005;15:514–520. - PubMed
    1. Shen Q, et al. Adult SVZ stem cells lie in a vascular niche: a quantitative analysis of niche cell-cell interactions. Cell Stem Cell. 2008;3:289–300. - PMC - PubMed

Publication types

Substances