. 2023 Feb;142(2):201-216.
doi: 10.1007/s00439-022-02494-1. Epub 2022 Nov 14.

SCIP: software for efficient clinical interpretation of copy number variants detected by whole-genome sequencing

Affiliations

SCIP: software for efficient clinical interpretation of copy number variants detected by whole-genome sequencing

Qiliang Ding et al. Hum Genet. 2023 Feb.

Abstract

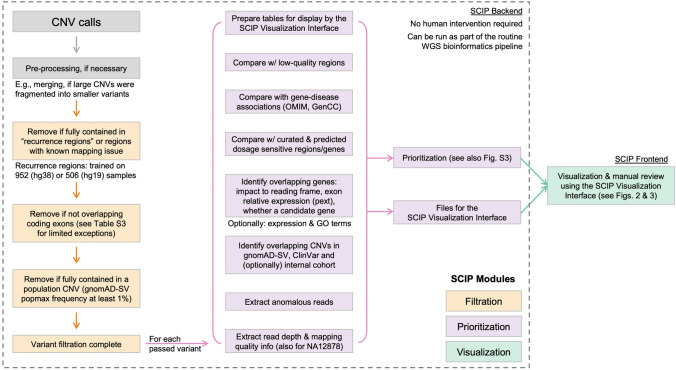
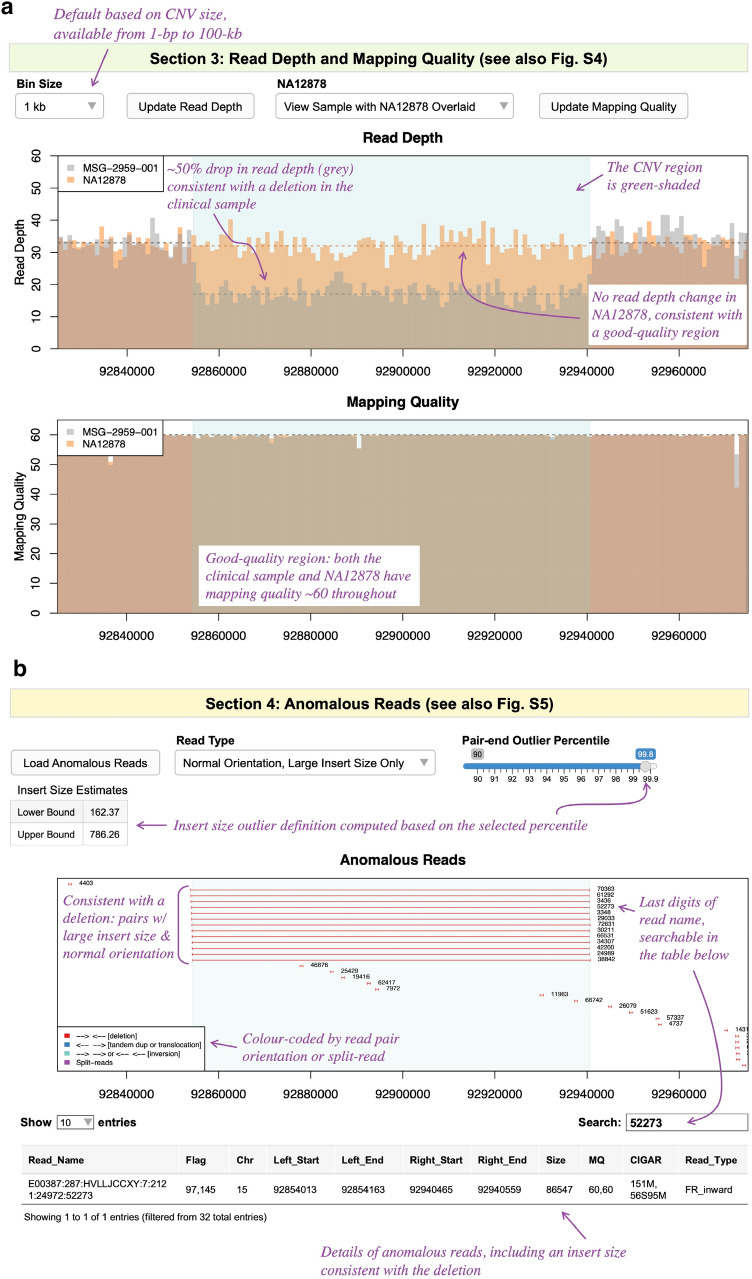
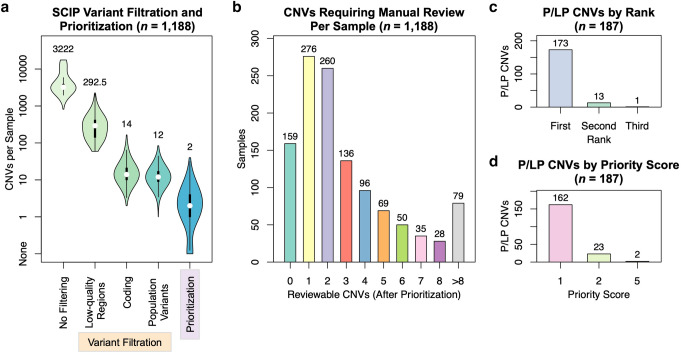
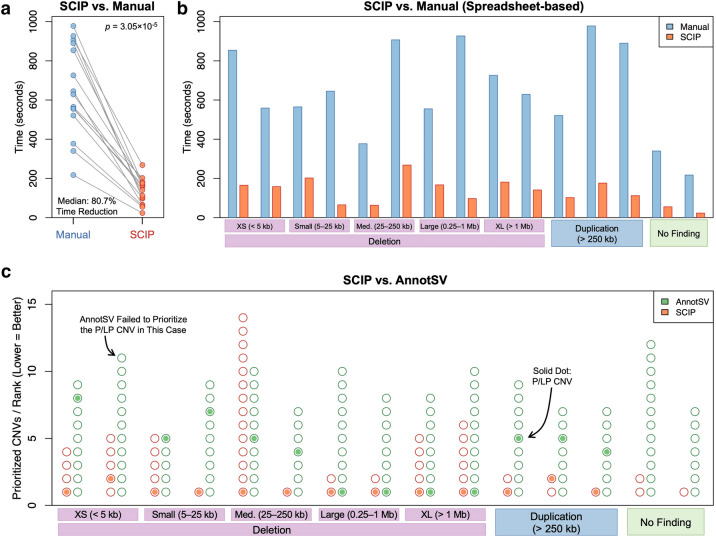
Copy number variants (CNVs) represent major etiologic factors in rare genetic diseases. Current clinical CNV interpretation workflows require extensive back-and-forth with multiple tools and databases. This increases complexity and time burden, potentially resulting in missed genetic diagnoses. We present the Suite for CNV Interpretation and Prioritization (SCIP), a software package for the clinical interpretation of CNVs detected by whole-genome sequencing (WGS). The SCIP Visualization Module near-instantaneously displays all information necessary for CNV interpretation (variant quality, population frequency, inheritance pattern, and clinical relevance) on a single page-supported by modules providing variant filtration and prioritization. SCIP was comprehensively evaluated using WGS data from 1027 families with congenital cardiac disease and/or autism spectrum disorder, containing 187 pathogenic or likely pathogenic (P/LP) CNVs identified in previous curations. SCIP was efficient in filtration and prioritization: a median of just two CNVs per case were selected for review, yet it captured all P/LP findings (92.5% of which ranked 1st). SCIP was also able to identify one pathogenic CNV previously missed. SCIP was benchmarked against AnnotSV and a spreadsheet-based manual workflow and performed superiorly than both. In conclusion, SCIP is a novel software package for efficient clinical CNV interpretation, substantially faster and more accurate than previous tools (available at https://github.com/qd29/SCIP , a video tutorial series is available at https://bit.ly/SCIPVideos ).


Conflict of interest statement

None declared.

Figures

Fig. 1
Fig. 1
Overall Software Architecture of SCIP. SCIP is composed of three modules. The Variant Filtration and Prioritization Modules collectively form the SCIP backend (within the dotted rectangle). CNV calls, after necessary pre-processing (e.g., merging), pass through the three-step Variant Filtration Module (orange). The remaining variants are then analyzed by the Prioritization Module, which calculates a priority score (Figure S3) and generates files for the Visualization Module. User may also opt to perform their own filtering and skip the SCIP Variant Filtration Module
Fig. 2
Fig. 2
SCIP Visualization Module, Part 1. a Schematic of the SCIP Visualization Module. This panel provides an overview of the SCIP Graphical User Interface (GUI, i.e., the Visualization Module). This panel illustrates that the SCIP Visualization Module displays multiple sections sequentially. The details of these sections are shown in additional figure panels (the names and colour codes of which are indicated). One of the sections (Sect. 6.1) of the SCIP Visualization Module is toggled by a mouse click (for more details, see Fig. 5), as indicated by the “click” wording in this panel. b Sect. 1 allows navigation through CNVs, either using the searchable CNV Name drop-down menu or the previous/next buttons. A user may view, modify, or enter interpretations. c The Variant Summary section offers an overview of a CNV, facilitating precision analysis. For this deletion, this section displays that it overlaps CHD2, a curated HI gene, and is well-supported by anomalous reads
Fig. 3
Fig. 3
SCIP Visualization Module, Part 2. a Sect. 3 plots binned read depth and mapping quality information. b Sect. 4 plots anomalous reads in the region flanking the variant. The upper/lower bound of insert size (for outlier detection) is set as 99.5/0.5-percentile of that of all read pairs by default and is adjustable. A user may view specific kinds of anomalous reads depending on the CNV type. For example, this plot only shows read pairs with normal orientation but unusually large insert size (expected for a deletion). Part of their names is displayed alongside the reads, which are searchable in the table below. Together with Sect. 3 (panel a), they offer a more efficient alternative to IGV in assessing CNV quality. Purple text in the figure highlights additional features of the interface
Fig. 4
Fig. 4
SCIP Visualization Module, Part 3. The External and Internal Variant Databases section compares the variant-of-interest with known CNVs, as well as the internal cohort (if provided). In the gnomAD-SV panel, names and popmax allele frequencies are displayed next to the variants. This is supplemented by a table with links to gnomAD-SV. For this CNV, no gnomAD-SV variants overlapping CHD2 (purple box) were observed. Filtering of variants by popmax frequency is available. ClinVar variants are colour-coded by consequence (see legend) and may be filtered by consequence or size. The accompanying table displays gene content of the ClinVar variants (including whether full or partial overlap), allowing comparison with the CNV-of-interest. In the Internal Cohort panel, variants from the same family as the proband are coloured in red. There are no red-coloured similar-sized variants in this panel (despite trio sequenced), indicating that the variant is de novo
Fig. 5
Fig. 5
SCIP Visualization Module, Part 4. a The Genomic Neighbourhood section plots dosage sensitivity curations and constraints, genes, and pext (relative exon expression) scores. Dosage information is colour-coded (see legend). The Genes table comprises a wealth of information, including links to external resources (e.g., OMIM clinical synopsis and allelic variants pages, GTEx, GeneCards, Google search terms). b The Transcript Information table shows exons in biologically relevant transcripts affected by the CNV. This pop-up table can be toggled by clicking one of the first three columns of the Genes table. The queried CNV removed exons 1–7 of the MANE Select transcript of CHD2, supporting its pathogenicity
Fig. 6
Fig. 6
SCIP was Highly Efficient at Filtration and Prioritization of P/LP CNVs. a The SCIP Variant Filtration and Prioritization Modules were effective, reducing the median number of variants per sample from 3222 (pre-filtering) to two (after prioritization). CNVs remaining per sample after each step of variant filtration are also plotted. b Distribution of the number of variants requiring manual review per sample. The majority (695/1188) of the samples had two or fewer reviewable CNVs, while nearly 95% (1109) had no more than eight reviewable CNVs. c SCIP further prioritized P/LP variants among reviewable CNVs, with 92.5% of them ranked first in the respective sample. CNVs were ranked by priority score and size. dAll but two previously identified P/LP CNVs had priority scores of 1 or 2 (as determined by the SCIP Prioritization Module). While we currently select variants with priority scores < 99 for manual review, this finding indicates that further efficiencies in selecting reviewable CNVs may be possible
Fig. 7
Fig. 7
SCIP was Substantially Superior to Previous Approaches for CNV Interpretation. a, b In a head-to-head comparison with the spreadsheet-based manual workflow using 15 samples sequenced for autism spectrum disorder, SCIP was 80.7% (median) faster than the manual approach currently used by the CGC and TCAG at The Hospital for Sick Children. b The observed time savings of SCIP was consistent across a diverse range of scenarios, including deletions of varying sizes (n = 2 for each category), duplications (n = 3), and two cases with no reportable CNV findings. c SCIP was statistically significantly more effective at CNV prioritization than AnnotSV. Each case is represented by two columns of circles (one orange and one green). Circles indicate prioritized CNVs, while solid dots indicate P/LP CNVs. Rank of the P/LP variant among prioritized CNVs can be inferred using the Y-axis. Compared with AnnotSV, SCIP had significantly lower number of prioritized CNVs per case and better ranking for P/LP CNVs

References

    1. Abou Tayoun AN, Pesaran T, DiStefano MT, Oza A, Rehm HL, Biesecker LG, Harrison SM, Working CSVI, G, Recommendations for interpreting the loss of function PVS1 ACMG/AMP variant criterion. Hum Mutat. 2018;39:1517–1524. doi: 10.1002/humu.23626. - DOI - PMC - PubMed
    1. Abyzov A, Urban AE, Snyder M, Gerstein M. CNVnator: an approach to discover, genotype, and characterize typical and atypical CNVs from family and population genome sequencing. Genome Res. 2011;21:974–984. doi: 10.1101/gr.114876.110. - DOI - PMC - PubMed
    1. Amberger JS, Bocchini CA, Scott AF, Hamosh A. OMIM.org: leveraging knowledge across phenotype-gene relationships. Nucleic Acids Res. 2019;47:D1038–D1043. doi: 10.1093/nar/gky1151. - DOI - PMC - PubMed
    1. Austin-Tse CA, Jobanputra V, Perry DL, Bick D, Taft RJ, Venner E, Gibbs RA, Young T, Barnett S, Belmont JW, Boczek N, Chowdhury S, Ellsworth KA, Guha S, Kulkarni S, Marcou C, Meng L, Murdock DR, Rehman AU, Spiteri E, Thomas-Wilson A, Kearney HM, Rehm HL. Best practices for the interpretation and reporting of clinical whole genome sequencing. NPJ Genom Med. 2022;7:27. doi: 10.1038/s41525-022-00295-z. - DOI - PMC - PubMed
    1. Belyeu JR, Chowdhury M, Brown J, Pedersen BS, Cormier MJ, Quinlan AR, Layer RM. Samplot: a platform for structural variant visual validation and automated filtering. Genome Biol. 2021;22:161–161. doi: 10.1186/s13059-021-02380-5. - DOI - PMC - PubMed