. 2022 Nov 14;11(1):49.
doi: 10.1186/s40035-022-00323-z.

Gut microbiome, cognitive function and brain structure: a multi-omics integration analysis

Affiliations

Gut microbiome, cognitive function and brain structure: a multi-omics integration analysis

Xinxiu Liang et al. Transl Neurodegener. .

Abstract

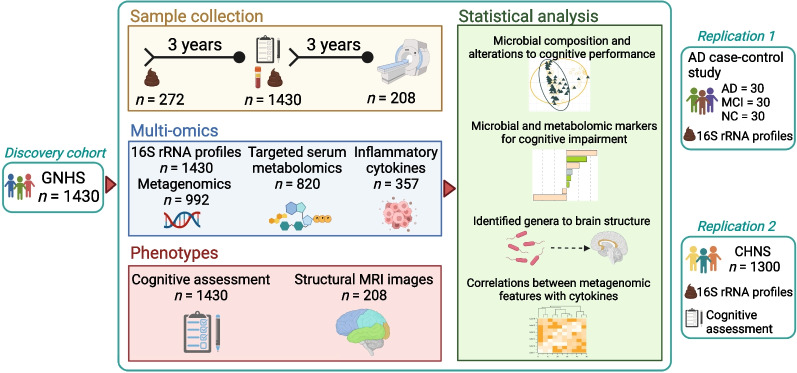
Background: Microbiome-gut-brain axis may be involved in the progression of age-related cognitive impairment and relevant brain structure changes, but evidence from large human cohorts is lacking. This study was aimed to investigate the associations of gut microbiome with cognitive impairment and brain structure based on multi-omics from three independent populations.

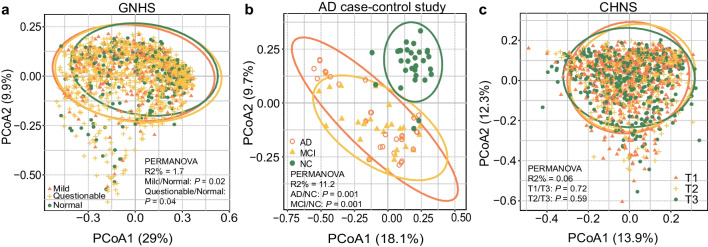
Methods: We included 1430 participants from the Guangzhou Nutrition and Health Study (GNHS) with both gut microbiome and cognitive assessment data available as a discovery cohort, of whom 272 individuals provided fecal samples twice before cognitive assessment. We selected 208 individuals with baseline microbiome data for brain magnetic resonance imaging during the follow-up visit. Fecal 16S rRNA and shotgun metagenomic sequencing, targeted serum metabolomics, and cytokine measurements were performed in the GNHS. The validation analyses were conducted in an Alzheimer's disease case-control study (replication study 1, n = 90) and another community-based cohort (replication study 2, n = 1300) with cross-sectional dataset.

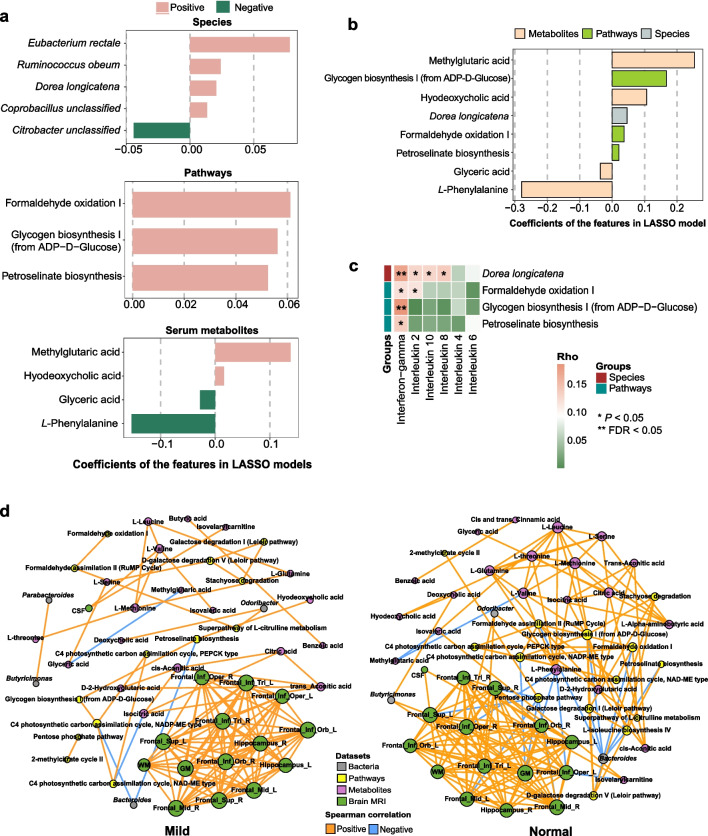
Results: We found protective associations of specific gut microbial genera (Odoribacter, Butyricimonas, and Bacteroides) with cognitive impairment in both the discovery cohort and the replication study 1. Result of Bacteroides was further validated in the replication study 2. Odoribacter was positively associated with hippocampal volume (β, 0.16; 95% CI 0.06-0.26, P = 0.002), which might be mediated by acetic acids. Increased intra-individual alterations in gut microbial composition were found in participants with cognitive impairment. We also identified several serum metabolites and inflammation-associated metagenomic species and pathways linked to impaired cognition.

Conclusions: Our findings reveal that specific gut microbial features are closely associated with cognitive impairment and decreased hippocampal volume, which may play an important role in dementia development.

Keywords: Brain structure; Cognitive impairment; Cohort; Gut microbiome; Metagenomics; Microbiome–gut–brain axis.


Conflict of interest statement

The authors declare that they have no competing interests.

Figures

Fig. 1
Fig. 1
Overview of study design and analyses. We included 1430 participants from the Guangzhou Nutrition and Health Study (GNHS) as a discovery cohort, all of whom had cognitive assessment and at least one stool sample collection (272 individuals collected stool samples twice). A subset of 208 individuals underwent magnetic resonance imaging (MRI) with availability of both gut microbiome and the cognitive assessment data. Replication datasets came from the AD case–control study (n = 90) and the China Health and Nutrition Survey (CHNS, n = 1300). Image created with BioRender.com. AD Alzheimer’s disease, MCI mild cognitive impairment, NC normal control
Fig. 2
Fig. 2
Alterations in the gut microbial structure in participants with cognitive impairment. ac Scatterplots from principal coordinates analysis (PCoA) and permutational multivariate analysis of variance (PERMANOVA), based on Bray–Curtis distances at genus level from the GNHS, the AD case–control study and the CHNS, respectively. In the GNHS, participants were classified into corresponding degrees of cognitive impairment according to their MMSE scores: ‘Mild’ (score ≤ 25); ‘Questionable’ (score 26–29) and ‘Normal’ (score 30). GNHS Guangzhou Nutrition and Health Study, AD Alzheimer’s disease, MCI mild cognitive impairment, NC normal control, CHNS China Health and Nutrition Survey, T tertile
Fig. 3
Fig. 3
Altered phylum- and genus-level taxonomies in participants with cognitive impairment. a The circular layout illustrates the mean relative abundance of phyla (16S rRNA gene sequencing) among the mild, questionable, and normal groups in the GNHS. Colors in upper and lower halves of the outermost circle represent different groups of participants and microbial phyla, respectively. Width of each track highlights mean relative abundance of each phylum contained in different groups of participants. b and c The relative abundance of Firmicutes and Bacteroidetes (b), and the ratio of Bacteroidetes to Firmicutes (c) among the GNHS participants with different degrees of cognitive impairment are presented by the violin plot with included boxplot. The boxplots show median and interquartile ranges (IQR). Whiskers specify ± 1.5 × IQR. (ns, P > 0.05; *0.005 < P < 0.05; **P < 0.005; two-sided Mann–Whitney U test). d Key gut microbial genera that contribute to distinguishing participants with different levels of cognitive impairment (Mild vs. Normal in the GNHS; AD vs. NC in the AD case–control study) using LASSO models. The bars are colored according to the direction of association between the genera and cognitive impairment (orange for positive correlation [harmful]; dark green for negative correlation [beneficial]). #Key genera selected in both populations. e Validation of the relationships between key genera and cognitive performance using linear mixed-effect models in the CHNS. The forest plot shows the result of the association between Bacteroides and global cognitive scores. The completed result is provided in the Additional file 1: Table S6. In the GNHS, participants were classified into corresponding degrees of cognitive impairment according to their MMSE scores: ‘Mild’ (score ≤ 25), ‘Questionable’ (score 26–29) and ‘Normal’ (score 30). In the CHNS, the participants were classified into T1, T2 and T3 groups according to the tertiles of their global cognitive scores. GNHS Guangzhou Nutrition and Health Study, AD Alzheimer’s disease, LASSO least absolute shrinkage and selection operator, CHNS China Health and Nutrition Survey, T tertile
Fig. 4
Fig. 4
Associations between cognition-related genera and brain structure in the GNHS. a Linear regression was used to estimate associations between cognition-related genera and brain structure. The β-coefficients indicate the corresponding changes in standardized volumes of different brain areas for per 1-standardize unit (in SD unit) increase of the bacterial relative abundance. False discovery rate (FDR) was calculated using the Benjamini–Hochberg method. *FDR < 0.05. b β-Value maps of linear mixed-effect model show a positive association between the relative abundance of Odoribacter and the right hippocampal volume (one-way T test, FDR < 0.05, voxel > 10). GNHS Guangzhou Nutrition and Health Study, GM grey matter, WM white matter, CSF cerebrospinal fluid, L left, R right, Frontal_Sup superior frontal gyrus, dorsolateral, Frontal_Mid middle frontal gyrus, Frontal_Inf_Oper inferior frontal gyrus, opercular part, Frontal_Inf_Tri inferior frontal gyrus, triangular part, Frontal_Inf_Orb inferior frontal gyrus, orbital part
Fig. 5
Fig. 5
Associations between gut metagenomic alterations and cognitive function in the GNHS. ac Principal coordinate analysis (PCoA) and permutational multivariate analysis of variance (PERMANOVA) plots of Bray–Curtis (BC) dissimilarities at the species level display the compositional alterations of gut microbiome over 3 years in groups with different cognitive status. d Comparison of microbial alterations quantified by Bray–Curtis dissimilarities of species among participants with different cognitive performance. P values were generated from multinomial logistic regression models. Boxplots show median and interquartile ranges (IQR). Whiskers specify ± 1.5 × IQR. Participants were classified into corresponding degrees of cognitive impairment according to their MMSE scores: ‘Mild’ (score ≤ 25), ‘Questionable’ (score 26–29) and ‘Normal’ (score 30). GNHS Guangzhou Nutrition and Health Study
Fig. 6
Fig. 6
Multi-omics interactions and cognitive impairment in the GNHS. a and b Metagenomic and metabolomic markers for distinguishing participants of the mild group from the normal group using the LASSO models based on metagenomic species, pathways or serum metabolites (a), or the combination of these three kinds of features selected from the separated models mentioned above (b). The x axis denotes the coefficients of the features in each model. c Semi-partial correlation of key metagenomic features selected from the combined LASSO model with serum inflammatory cytokines. The intensity of color represents correlation coefficients. False discovery rate (FDR) was calculated using Benjamini–Hochberg method. d Significant associations among 4 aspects of multi-omics: genera of 16S rRNA gene sequencing, metagenomic pathways, serum metabolites, and brain structure. Spearman correlation was used to calculate pairwise correlations of all the measurements. Network shows significant correlations (FDR < 0.05) between each pair of measurement types. Size of nodes represents the number of connections with others. Orange edge, Spearman correlation coefficient > 0; blue edge, Spearman correlation coefficient < 0. Participants were classified into corresponding degrees of cognitive impairment according to their MMSE scores: ‘Mild’ (score ≤ 25), ‘Questionable’ (score 26–29) and ‘Normal’ (score 30). GNHS Guangzhou Nutrition and Health Study, LASSO least absolute shrinkage and selection operator, GM grey matter, WM white matter, CSF cerebrospinal fluid, L left, R right, Frontal_Sup superior frontal gyrus, dorsolateral, Frontal_Mid middle frontal gyrus, Frontal_Inf_Oper inferior frontal gyrus, opercular part, Frontal_Inf_Tri inferior frontal gyrus, triangular part, Frontal_Inf_Orb inferior frontal gyrus, orbital part

References

    1. Patterson C. World Alzheimer report 2018. London: Alzheimer’s Disease International; 2018.
    1. Bateman RJ, Xiong C, Benzinger TL, Fagan AM, Goate A, Fox NC, et al. Clinical and biomarker changes in dominantly inherited Alzheimer's disease. N Engl J Med. 2012;367(9):795–804. - PMC - PubMed
    1. Livingston G, Huntley J, Sommerlad A, Ames D, Ballard C, Banerjee S, et al. Dementia prevention, intervention, and care: 2020 report of the Lancet Commission. Lancet. 2020;396(10248):413–446. - PMC - PubMed
    1. Ghaisas S, Maher J, Kanthasamy A. Gut microbiome in health and disease: Linking the microbiome–gut–brain axis and environmental factors in the pathogenesis of systemic and neurodegenerative diseases. Pharmacol Ther. 2016;158:52–62. - PMC - PubMed
    1. Harach T, Marungruang N, Duthilleul N, Cheatham V, Mc Coy KD, Frisoni G, et al. Reduction of Abeta amyloid pathology in APPPS1 transgenic mice in the absence of gut microbiota. Sci Rep. 2017;7:41802. - PMC - PubMed

Publication types

Substances

LinkOut - more resources