. 2022 Nov 14;19(1):272.
doi: 10.1186/s12974-022-02624-6.

Neuroinflammation regulates the balance between hippocampal neuron death and neurogenesis in an ex vivo model of thiamine deficiency

Affiliations

Neuroinflammation regulates the balance between hippocampal neuron death and neurogenesis in an ex vivo model of thiamine deficiency

Larissa M G Cassiano et al. J Neuroinflammation. .

Abstract

Background: Thiamine (vitamin B1) is a cofactor for enzymes of central energy metabolism and its deficiency (TD) impairs oxidative phosphorylation, increases oxidative stress, and activates inflammatory processes that can lead to neurodegeneration. Wernicke-Korsakoff syndrome (WKS) is a consequence of chronic TD, which leads to extensive neuronal death, and is associated with neuropathological disorders, including cognitive deficits and amnesia. The hippocampus is one of the brain areas most affected by WKS. B1 replacement may not be enough to prevent the irreversible cognitive deficit associated with WKS.

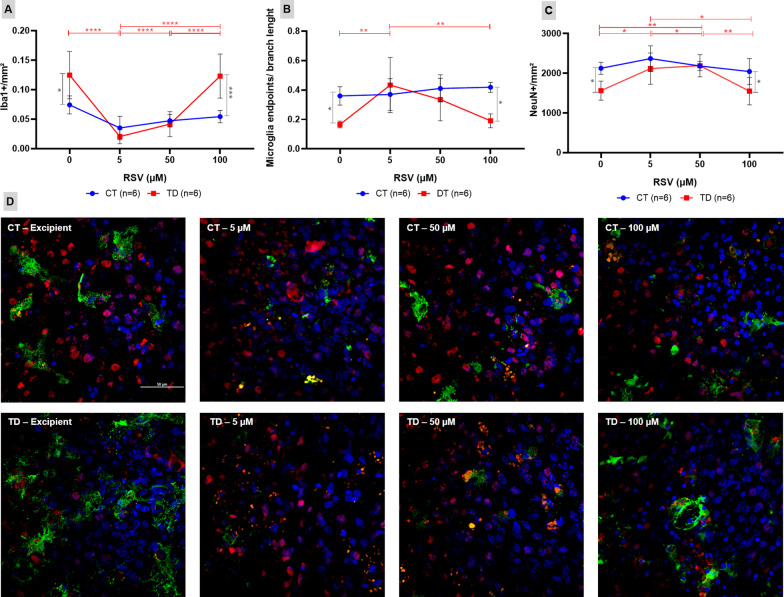
Materials and methods: An organotypic hippocampal slice culture (OHC) model was developed to investigate, using immunofluorescence and confocal microscopy and transcriptome analysis, the molecular mechanisms underlying the neurodegeneration associated with TD. The effect of anti-inflammatory pharmacological intervention with resveratrol (RSV) was also assessed in B1-deprived OHCs.

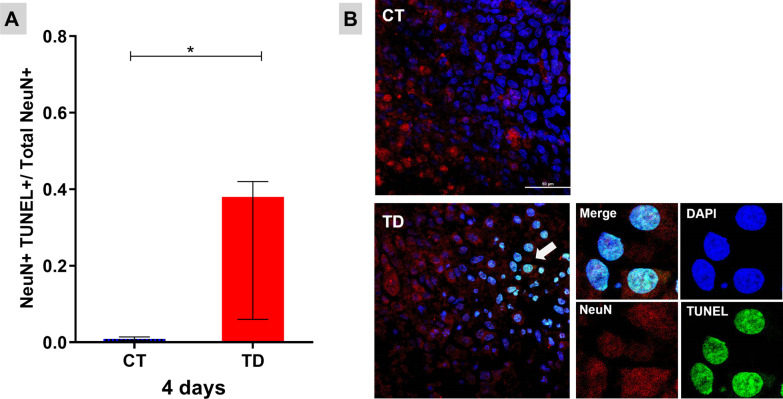
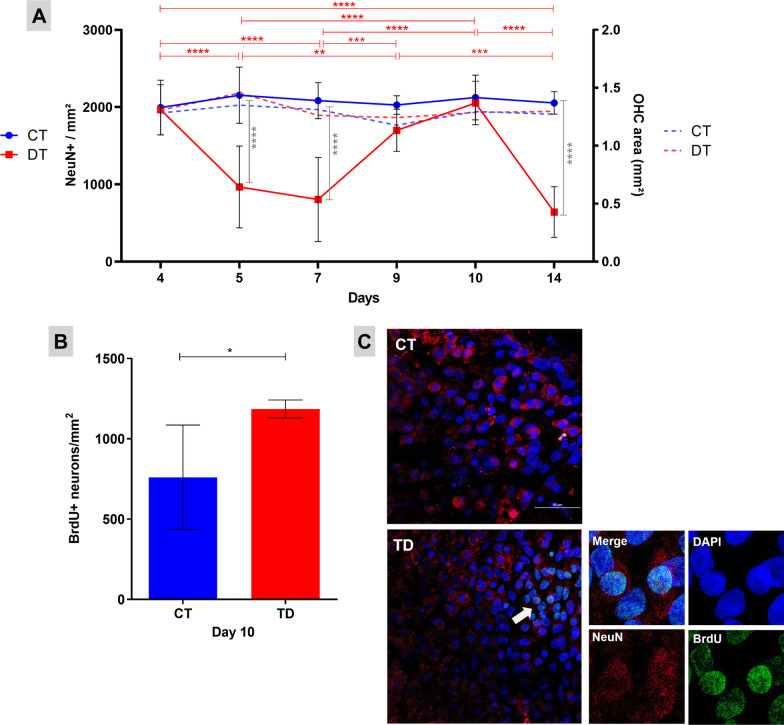
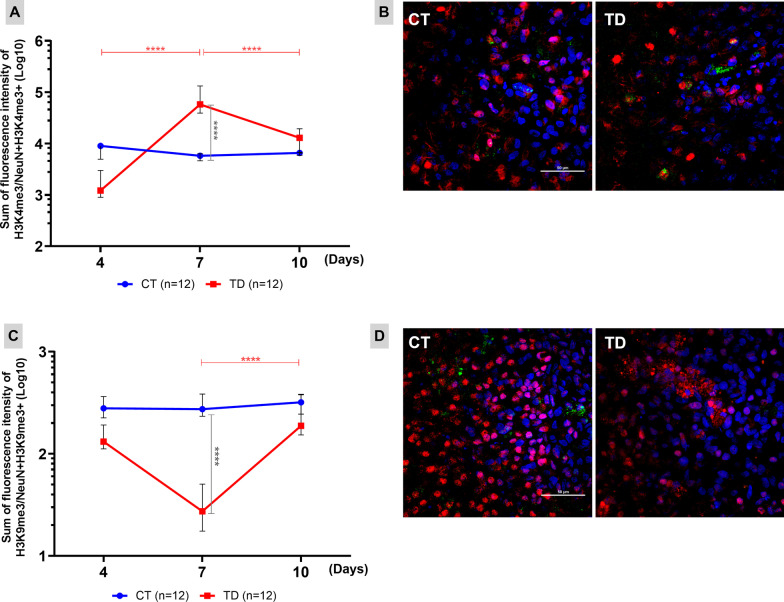
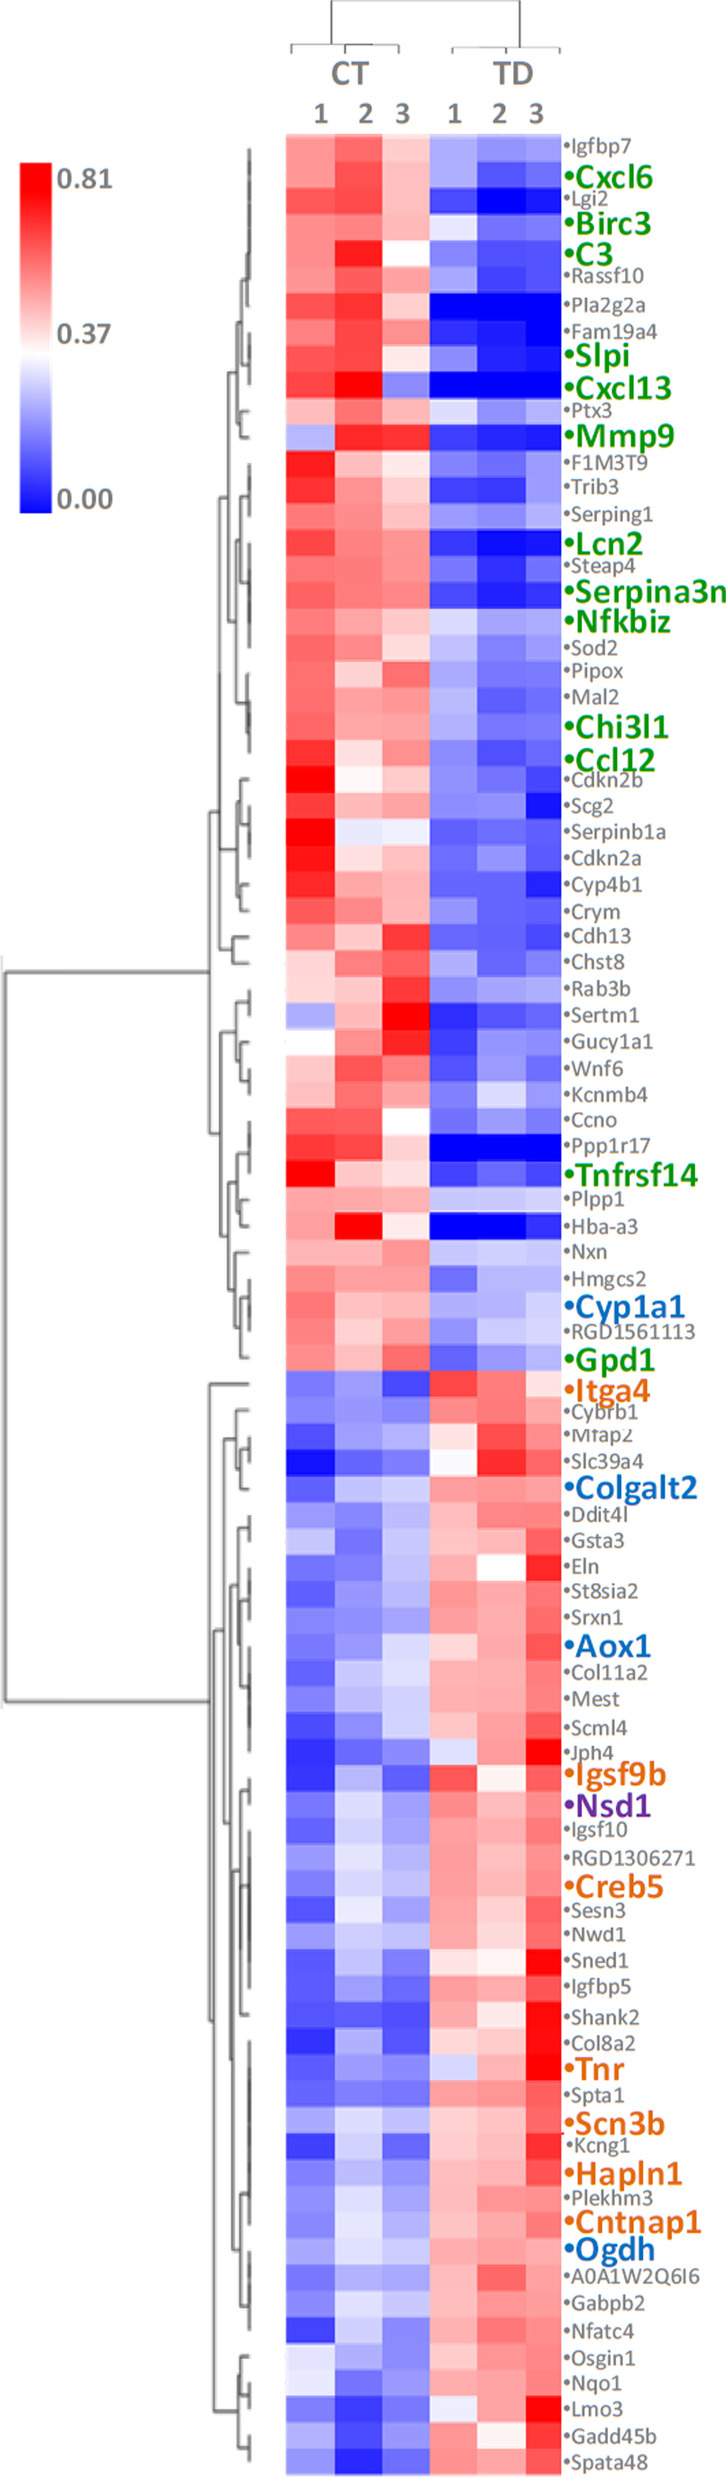
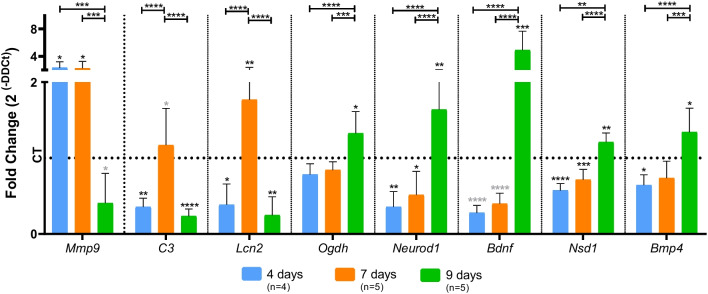
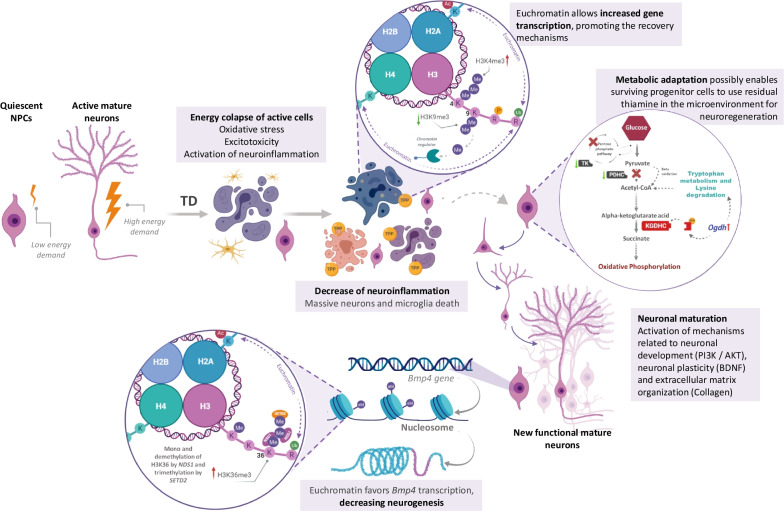
Results: In OHCs cultured without B1, neuronal density decayed after 5 days and, on the 7th day, the epigenetic markings H3K4me3 and H3K9me3 were altered in mature neurons likely favoring gene transcription. Between the 7th and the 14th day, a pulse of neurogenesis was observed followed by a further massive neuron loss. Transcriptome analysis at day nine disclosed 89 differentially expressed genes in response to B1 deprivation. Genes involved in tryptophan metabolism and lysine degradation KEGG pathways, and those with Gene Ontology (GO) annotations related to the organization of the extracellular matrix, cell adhesion, and positive regulation of synaptic transmission were upregulated. Several genes of the TNF and FoxO signaling pathways and with GO terms related to inflammation were inhibited in response to B1 deprivation. Nsd1, whose product methylates histone H3 lysine 36, was upregulated and the epigenetic marking H3K36me3, associated with negative regulation of neurogenesis, was increased in neurons. Treating B1-deprived OHCs with RSV promoted an earlier neurogenesis pulse.

Conclusion: Neuroregeneration occurs in B1-deficient hippocampal tissue during a time window. This phenomenon depends on reducing neuroinflammation and, likely, on metabolic changes, allowing acetyl-CoA synthesis from amino acids to ensure energy supply via oxidative phosphorylation. Thus, neuroinflammation is implicated as a major regulator of hippocampal neurogenesis in TD opening a new search space for treating WKS.

Keywords: Neurodegeneration; Neurogenesis. inflammation; Neuroregeneration; Organotypic hippocampal culture; Thiamine deficiency.


Conflict of interest statement

The authors declare that they have no competing interests.

Figures

Fig. 1
Fig. 1
Mature neurons die by apoptosis in TD. TUNEL assay detect DNA fragmentation during apoptosis. A Fraction of TUNEL-labeled neurons after 4 days of B1 deprivation. Data were expressed as median ± interquartile range. Mann–Whitney test was used (*P ≤ 0.05). B Confocal microscopy images (×60) of OHCs show mature neurons (NeuN+) (in red), cell nuclei (DAPI) (in blue), and TUNEL (in green). In detail, a digital zoom (×5.5) of typical apoptotic neurons. CT controls, TD thiamine deficiency (scale bar = 50 μm)
Fig. 2
Fig. 2
Neuronal density in OHCs at different timepoints of B1 deprivation. OHCs challenged with B1 deprivation lost approximately 71% of neurons from the 5th day on. Surprisingly, between the 7th and 14th day of culture without B1, a pulse of neurogenesis followed by a new massive loss of neurons was observed. A Left Y axis shows the neuronal density means (NeuN+/mm2) of the CT (controls) (n = 12) and TD (thiamine deficiency) (n = 12). Groups were compared with the bidirectional analysis of variance (ANOVA) test followed by the Tukey’s multiple comparisons test. Data were expressed as mean ± standard deviation (*P ≤ 0.05, **P ≤ 0.01, ***P ≤ 0.001, ****P ≤ 0.0001). Statistical differences represented by the red horizontal bars and asterisks refer to the variation in the TD group between the different culture time points. Gray vertical bars and asterisks refer to the intergroup differences (CT versus TD) at the same timepoint. Right Y axis shows the OHC area means of the CT (n = 12) and TD (n = 12). Groups were compared with the bidirectional ANOVA test followed by the Tukey's multiple comparisons test. B BrdU assay identify proliferating cells. The graph shows post-mitotic neurons density (BrdU+ neurons/mm2) between days 7 and 10 of B1 deprivation. N sample: CT (n = 3) and TD (n = 4). Two-tailed T test was used (*P ≤ 0.05) and data were expressed as mean ± standard deviation. C Confocal microscopy images (×60) of OHCs show mature neurons (NeuN+) (in red), cell nuclei (DAPI) (in blue), and BrdU (in green). In detail, a digital zoom (×8) of typical BrdU staining. CT controls, TD thiamine deficiency (scale bar = 50 μm)
Fig. 3
Fig. 3
Epigenetic markings favor chromatin accessibility and gene expression during TD. The trimethylation of histone H3 lysines 4 and 9 modulate chromatin accessibility increasing or inhibiting gene expression, respectively. A, C Sum of the fluorescence intensity of the brand H3K4me3 (A) and H3K9me3 (B) normalized by the number of mature neurons identified with these markings, after 4, 7 and 10 days of culture with or without B1. The means of the CT (controls) and TD (thiamine deficiency) groups were compared with the bidirectional analysis of variance (ANOVA) test followed by the Tukey’s multiple comparisons test. Data were expressed as ± standard deviation (****P ≤ 0.0001). The statistical differences represented by red horizontal bars and asterisks refer to the variation in the TD group between the different timepoints. Gray vertical bars and asterisks refer to the intergroup differences (CT versus TD) at the same timepoint. B, D Confocal microscopy images (×60) of COH with markings of mature neurons (NeuN+) in red, cell nucleus (DAPI) in blue and epigenetic markings H3K4me3 (B) or H3K9me3 (D) in green after 7 days of culture with or without B1 (scale bar = 50 μm)
Fig. 4
Fig. 4
Hierarchical clustering and expression levels of the 89 differentially expressed genes in the TD group compared to the control. Fold change values were compared by Spearman correlation, average linkage and heatmap colors were normalized by the global Z-score. Among the genes differentially expressed in the contrast between TD and CT, genes related to inflammatory response (green), cell metabolism (blue), cell cycle, cell differentiation and survival (orange) and epigenetic regulation of neurogenesis (purple) were observed. CT controls, TD thiamine deficiency
Fig. 5
Fig. 5
Relative expression of selected genes in OHCs cultured with or without B1. Fold change values were calculated from RT-qPCR data as 2(−ΔΔCt), therefore, the dotted line indicates the basal mean expression level of the respective gene in the control group (CT). The means of the CT and thiamine deficiency (TD) groups were compared with the bidirectional analysis of variance (ANOVA) test followed by Tukey’s multiple comparisons test. CT and TD groups were also analyzed separately with Student’s t-test (P value in light gray) to identify possible statistical differences not detected by the multiple comparison method due to low statistical power of the small sample. Data were expressed as mean ± standard deviation (*P ≤ 0.05, **P ≤ 0.01, ***P ≤ 0.001, ****P ≤ 0.0001)
Fig. 6
Fig. 6
Epigenetic marking that inhibits neurogenesis after OHCs is repopulated with new neurons in advanced TD. The trimethylation of histone H3 lysine 36 (arrows in B) positively regulates the expression of the Bmp4 gene, an important inhibitor of neurogenesis. A Sum of the fluorescence intensity of H3K36me3 normalized by the number of mature neurons identified with this marking after 9 days of culture with or without B1. The medians of the CT (controls) and TD (thiamine deficiency) groups were compared with the Mann–Whitney test and data were expressed as median ± interquartile. (*P ≤ 0.05). B Confocal microscopy images (×100) of OHCs labeled for mature neurons (NeuN+) in red, cell nucleus (DAPI) in blue and H3K36me3 in green after 9 days of culture with or without B1 (scale bar = 50 μm)
Fig. 7
Fig. 7
RSV prevents microglia activation and promotes an earlier neurogenesis pulse in B1-deprived OHCs. AC The means of activated microglia (A), microglia endpoints/branch length ratio (B), and neuronal density (C) of the CT (controls) and TD (thiamine deficiency) groups were compared with the bidirectional analysis of variance (ANOVA) test followed by the Tukey’s multiple comparisons test. Data were expressed as mean ± standard deviation (*P ≤ 0.05, **P ≤ 0.01, ***P ≤ 0.001, ****P ≤ 0.0001). The statistical differences represented by red horizontal bars and asterisks refer to the variation of neuronal density between TD groups treated with different doses of RSV. The gray horizontal bars and asterisks refer to the differences between CT and TD treated with the same doses of RSV. D Confocal microscopy images (×60) of OHC with markings of mature neurons (NeuN+) in red, cell nucleus (DAPI) in blue and activated microglia (Iba1+) in green (scale bar = 50 μm)
Fig. 8
Fig. 8
Neuroinflammation regulate the balance between hippocampal neuron death and neurogenesis in TD. NPC: neural progenitor cells; TD: thiamine deficiency; TPP thiamine pyrophosphate; H2A: histone 2A; H2B: histone 2B; H3: histone 3; H4: histone 4; K: lysine; R: arginine; P: phosphorylation; Ub: ubiquitination; Ac: acetylation; Me: methylation; H3K9me3: trimethylation in lysine 9 at histone 3; K3K4me3: trimethylation in lysine 4 at histone 3; TK: transketolase; PDHC: pyruvate dehydrogenase complex; Ogdh: oxoglutarate dehydrogenase; KGDHC: alfa-ketoglutarate dehydrogenase complex; PI3K/AKT: phosphatidylinositol 3-kinase/protein kinase B; BDNF: brain derived neurotrophic factor; H3K36me3: trimethylation in lysine 36 at histone 3; NSD1: nuclear receptor binding SET domain protein 1; SETD2: SET domain containing 2; Bmp4: bone morphogenetic protein 4

References

    1. Zhao Y, Wu Y, Hu H, Cai J, Ning M, Ni X, et al. Downregulation of transketolase activity is related to inhibition of hippocampal progenitor cell proliferation induced by thiamine deficiency. Biomed Res Int. 2014;2014:572915. - PMC - PubMed
    1. Nunes PT, Gómez-Mendoza DP, Rezende CP, Figueiredo HCP, Ribeiro AM. Thalamic proteome changes and behavioral impairments in thiamine-deficient rats. Neuroscience. 2018;385:181–197. - PubMed
    1. Bubber P, Ke ZJ, Gibson GE. Tricarboxylic acid cycle enzymes following thiamine deficiency. Neurochem Int. 2004;45(7):1021–1028. - PubMed
    1. Jhala SS, Hazell AS. Modeling neurodegenerative disease pathophysiology in thiamine deficiency: consequences of impaired oxidative metabolism. Neurochem Int. 2011;58(3):248–260. - PubMed
    1. Inaba H, Kishimoto T, Oishi S, Nagata K, Hasegawa S, Watanabe T, et al. Vitamin B1-deficient mice show impairment of hippocampus-dependent memory formation and loss of hippocampal neurons and dendritic spines: potential microendophenotypes of Wernicke–Korsakoff syndrome. Biosci Biotechnol Biochem. 2016;80(12):2425–2436. - PMC - PubMed

LinkOut - more resources