. 2022 Nov 3;39(11):msac251.
doi: 10.1093/molbev/msac251.

Ecological Speciation Promoted by Divergent Regulation of Functional Genes Within African Cichlid Fishes

Affiliations

Ecological Speciation Promoted by Divergent Regulation of Functional Genes Within African Cichlid Fishes

Madeleine Carruthers et al. Mol Biol Evol. .

Abstract

Rapid ecological speciation along depth gradients has taken place repeatedly in freshwater fishes, yet molecular mechanisms facilitating such diversification are typically unclear. In Lake Masoko, an African crater lake, the cichlid Astatotilapia calliptera has diverged into shallow-littoral and deep-benthic ecomorphs with strikingly different jaw structures within the last 1,000 years. Using genome-wide transcriptome data, we explore two major regulatory transcriptional mechanisms, expression and splicing-QTL variants, and examine their contributions to differential gene expression underpinning functional phenotypes. We identified 7,550 genes with significant differential expression between ecomorphs, of which 5.4% were regulated by cis-regulatory expression QTLs, and 9.2% were regulated by cis-regulatory splicing QTLs. We also found strong signals of divergent selection on differentially expressed genes associated with craniofacial development. These results suggest that large-scale transcriptome modification plays an important role during early-stage speciation. We conclude that regulatory variants are important targets of selection driving ecologically relevant divergence in gene expression during adaptive diversification.

Keywords: cichlids; ecological speciation; gene expression; molecular evolution; transcriptional regulation.


Figures

<sc>Fig.</sc> 1.
Fig. 1.
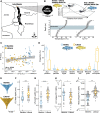
Sampling information and phenotypic divergence. (A) The location of Lake Masoko, relative to Lake Malawi and bordering countries. (B) Schematic of sampling approach for collection of shallow-water littoral and deep-water benthic ecomorphs of A. calliptera in Lake Masoko, as well as temperature and oxygen profiles by depth gradient (data from Delalande 2008). (C) Association between carbon and nitrogen stable isotope signatures, demonstrating differences in trophic feeding regimes between benthic and littoral ecomorphs (n = 113). (D) Results from Bayesian stable isotope mixing models showing proportional estimates (mean, 25% and 75% percentiles) of diet composition for benthic and littoral ecomorphs. (E) Example of LPJ images segmented from micro-CT X-ray scans of craniofacial morphology, showing a representative example for benthic (top image) and littoral (bottom image) ecomorphs. (F–I) Differences in LJP keel depth (n = 70), LPJ tooth width (n = 70), LPJ shape (n = 70), and body shape (n = 113), respectively, between benthic and littoral ecomorphs. Grey points represent individual samples, with mean ± SD values for each ecomorph represented by the larger coloured points and error bars (benthic, blue; littoral, yellow). LPJ shape and body shape change are shown along the first principal component axis (PC1). The proportion of variation explained is given in parentheses. LPJ and body shape outlines represent shapes at axis extremes along PC1. Number of asterisks represents the level of significance (* < 0.05, ** < 0.01, *** < 0.001).
<sc>Fig.</sc> 2.
Fig. 2.
Divergent gene expression. (A) Principal component analysis showing variation in gene expression profiles of benthic (blue; n = 18 individuals) and littoral (yellow; n = 20 individuals) ecomorphs along principal components 1 (PC1) and 2 (PC2). The percent of total variation explained by each principal component axis is given in parentheses. (B) Volcano plot highlighting the extent of divergence in gene expression. Significant differentially expressed genes are colored according to the expression direction (yellow, significantly upregulated in littoral; blue, significantly upregulated in benthic; FDR < 0.05). Gene expression analyses are based on the complete set of expressed genes after filtering for low counts (n = 19,237 genes). (C) Differential expression of “master adaptation genes” involved in three major pathways implicated in LPJ plasticity networks and trophic adaptation (Wnt-signaling, BMP-signaling and Hh signaling). Grey points represent individual samples, with mean ± SD values for each ecomorph represented by the larger colored points and error bars (benthic, blue; littoral, yellow). A schematic of pathway interactions during LPJ shape and tooth development is given in the bottom right.
<sc>Fig.</sc> 3.
Fig. 3.
Cis-regulatory elements associated with expression variation between ecomorphs. (A) Venn diagram showing the number and proportion of genes that overlap between differential expression (DE), cis-regulatory splicing QTLs (cis-sQTL) and cis-regulatory expression QTLs (cis-eQTL) analyses. (B) Multi-dimensional scaling (MDS) plot showing enriched biological process GO terms identified for significant gene sets. Dark orange circles represent enriched terms for DE genes, yellow circles represent enriched terms for cis-eQTL genes, and blue circles represent enriched terms for cis-sQTL genes (FDR < 0.05). GO terms were clustered based on semantic similarity of functional classifications. The size of the circle corresponds to the number of genes associated with each GO term cluster. Descriptions are given for GO cluster functions that were shared across all three datasets (DE, cis-eQTL, and cis-sQTL genes). (C) Manhattan plot showing the genomic distribution of differentially expressed (DE) genes that were associated with divergent regulation from expression or splicing QTLs (according to their position in M. zebra reference genome). DE genes regulated by cis-eQTL variants are represented by yellow circles, DE genes regulated by cis-sQTL variants are represented by blue circles and DE genes regulated by both cis-eQTL and cis-sQTL variants are represented by dark orange circles. Chromosomes are highlighted by alternating colours and un-anchored scaffolds are located at the right end of the x-axis. The y-axis relates to the magnitude of expression divergence in individual genes, given as –log10 transformed FDR-corrected P-values generated from the global differential expression analysis (based on the total set of 19,237 expressed genes). The black dashed line indicates the 5% FDR threshold.
<sc>Fig.</sc> 4.
Fig. 4.
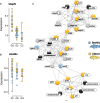
Divergent regulation in candidate genes underlying LPJ trait divergence. Associations between cis-eQTL genotypes and the level of expression (normalized counts) in two candidate genes involved in LPJ adaptation pathways, (A) bmp7b (Bone morphogenic protein 7b) within the BMP-signaling pathway and (B) smad4a (SMAD family member 4a) within the Hh-signaling pathway. Gene abundance per individual, per genotype is shown as blue circles for benthic individuals and yellow circles for littoral individuals. (C) Schematic of gene network interactions for both candidate genes. Gene interactions were deduced based on available data for Danio rerio and Maylandia zebra in STRING (https://string-db.org). Blue gene nodes represent significant upregulation in the benthic ecomorph, yellow nodes represent significant upregulation in the littoral ecomorph, grey nodes represent genes that were recovered but showed no significant differential expression or regulation between ecomorphs, and black nodes represent genes that were not recovered in our dataset.
<sc>Fig.</sc> 5.
Fig. 5.
Signatures of selection. Genomic distribution of genes associated with signatures of positive selection and the associated magnitude of expression divergence, given the –log10 transformed FDR-corrected P-values generated from the global differential expression analysis across all anchored chromosomes (based on 19,237 expressed genes). Genes showing evidence of significant divergent selection between benthic and littoral ecomorphs are highlighted with dark orange points, and regions with high H12 selection scores illustrated by the orange lines. The gene density per chromosome is depicted along the top section of the plot.

References

    1. Abzhanov A, Kuo WP, Hartmann C, Grant BR, Grant PR, Tabin CJ. 2006. The calmodulin pathway and evolution of elongated beak morphology in Darwin's Finches. Nature. 442:563–567. - PubMed
    1. Abzhanov A, Protas M, Grant BR, Grant PR, Tabin CJ. 2004. Bmp4 and morphological variation of beaks in Darwin's Finches. Science. 305:1462–1465. - PubMed
    1. Ahi EP, Singh P, Duenser A, Gessl W, Sturmbauer C. 2019. Divergence in larval jaw gene expression reflects differential trophic adaptation in haplochromine cichlids prior to foraging. BMC Evol Biol. 19:150. - PMC - PubMed
    1. Albertson RC. 2008. Morphological divergence predicts habitat partitioning in a Lake Malawi cichlid species complex. Copeia. 2008:689–698.
    1. Anders S, Pyl PT, Huber W. 2015. HTSeq-A Python framework to work with high-throughput sequencing data. Bioinformatics. 31:166–169. - PMC - PubMed

Publication types