Review
. 2023 Mar-Apr;73(2):186-197.
doi: 10.1016/j.bjane.2022.10.004. Epub 2022 Oct 28.

Importance of assessing biomarkers and physiological parameters of anemia-induced tissue hypoxia in the perioperative period

Affiliations
Review

Importance of assessing biomarkers and physiological parameters of anemia-induced tissue hypoxia in the perioperative period

Kyle Chin et al. Braz J Anesthesiol. 2023 Mar-Apr.

Abstract

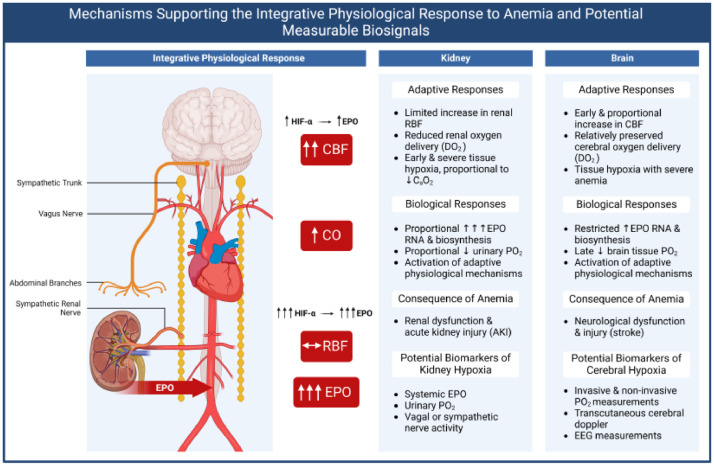
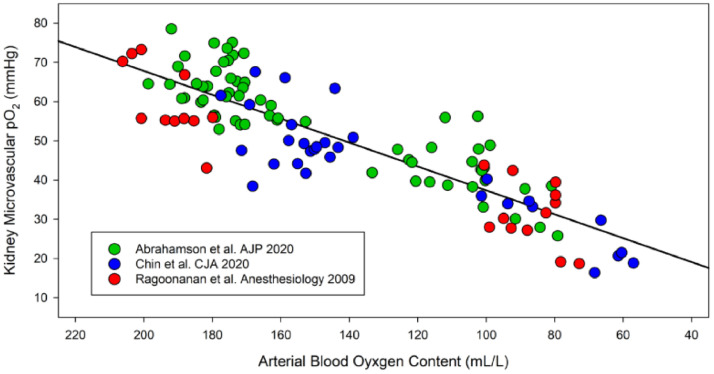
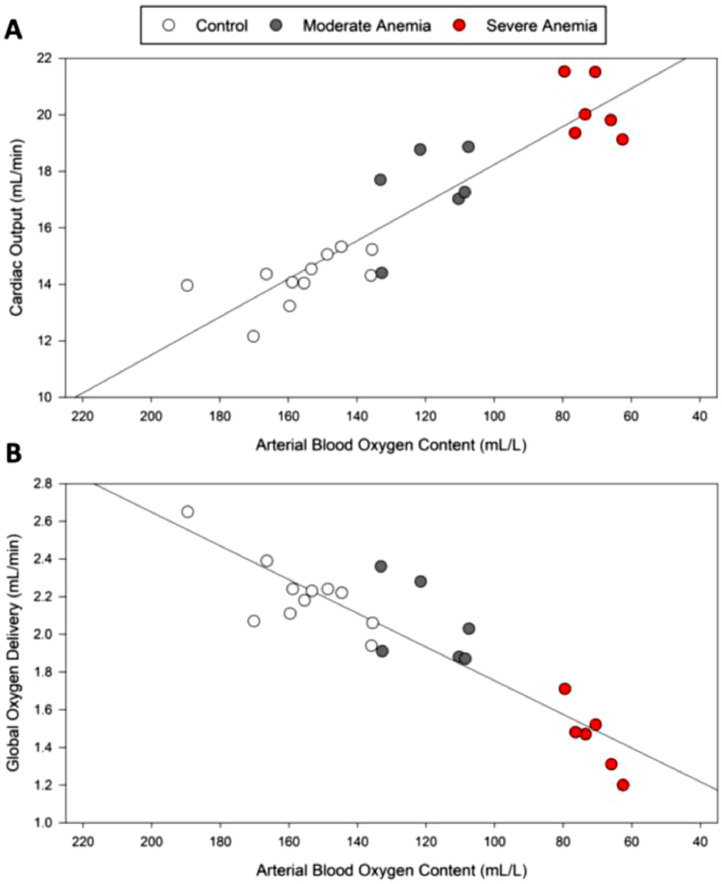
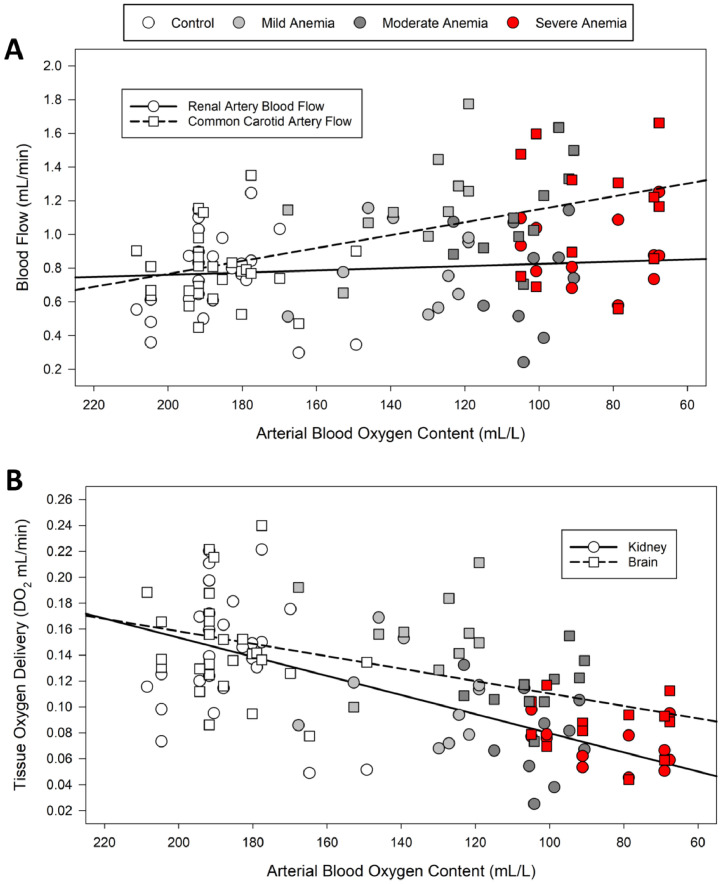
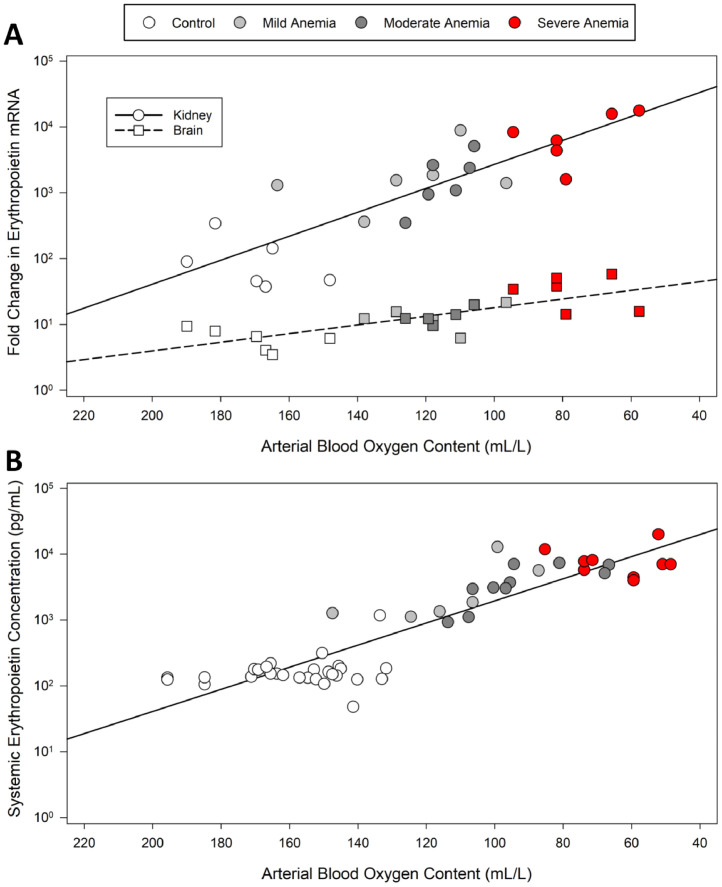
Anemia is associated with increased risk of Acute Kidney Injury (AKI), stroke and mortality in perioperative patients. We sought to understand the mechanism(s) by assessing the integrative physiological responses to anemia (kidney, brain), the degrees of anemia-induced tissue hypoxia, and associated biomarkers and physiological parameters. Experimental measurements demonstrate a linear relationship between blood Oxygen Content (CaO2) and renal microvascular PO2 (y = 0.30x + 6.9, r2 = 0.75), demonstrating that renal hypoxia is proportional to the degree of anemia. This defines the kidney as a potential oxygen sensor during anemia. Further evidence of renal oxygen sensing is demonstrated by proportional increase in serum Erythropoietin (EPO) during anemia (y = 93.806*10-0.02, r2 = 0.82). This data implicates systemic EPO levels as a biomarker of anemia-induced renal tissue hypoxia. By contrast, cerebral Oxygen Delivery (DO2) is defended by a profound proportional increase in Cerebral Blood Flow (CBF), minimizing tissue hypoxia in the brain, until more severe levels of anemia occur. We hypothesize that the kidney experiences profound early anemia-induced tissue hypoxia which contributes to adaptive mechanisms to preserve cerebral perfusion. At severe levels of anemia, renal hypoxia intensifies, and cerebral hypoxia occurs, possibly contributing to the mechanism(s) of AKI and stroke when adaptive mechanisms to preserve organ perfusion are overwhelmed. Clinical methods to detect renal tissue hypoxia (an early warning signal) and cerebral hypoxia (a later consequence of severe anemia) may inform clinical practice and support the assessment of clinical biomarkers (i.e., EPO) and physiological parameters (i.e., urinary PO2) of anemia-induced tissue hypoxia. This information may direct targeted treatment strategies to prevent adverse outcomes associated with anemia.

Keywords: Anemia; Brain; Erythropoietin; Hypoxia; Kidney; Perioperative period.


Conflict of interest statement

Conflicts of interest The authors declare no conflicts of interest.

Figures

Figure 1
Figure 1
Summary of integrative physiological responses to anemia and potential means of clinical assessment. Under anemic conditions, renal blood flow is maintained but associated oxygen delivery is decreased. This allows the kidney to sense decreases in blood oxygen content. Renal Erythropoietin (EPO) production is greatly stimulated at all levels of anemia in response to stabilization of Hypoxia-Inducible Factor-alpha (HIF-α). The lack of increased Renal Blood Flow (RBF) makes the kidney susceptible to hypoxia and Acute Kidney Injury (AKI). By contrast, the brain is protected to an extent during anemia via an increase in cerebral blood flow, allowing maintenance of oxygen delivery in mild to moderate anemia. Brain tissue hypoxia in response to severe anemia is associated with increased HIFα and EPO expression and may contribute to neurological injury and stroke. Biomarkers to identify renal and brain hypoxia are listed. This figure was created in BioRender.com. CBF, Cerebral Blood Flow; CO, Cardiac Output; DO2, Oxygen Delivery; CaO2, Arterial Oxygen Content.
Figure 2
Figure 2
Scatterplot of the relationship between kidney microvascular PO2 versus arterial blood oxygen content in anesthetized Sprague-Dawley rats exposed to acute hemodilutional anemia. A significant correlation (y = 0.30x + 6.9, r2 = 0.75) is observed between microvascular kidney tissue PO2 and arterial oxygen content. As arterial oxygen content decreases, microvascular kidney tissue PO2 decreases proportionally in a linear manner. This data demonstrates the ability of the kidney to translate CaO2 into a local regional microvascular PO2 based on organ blood flow and tissue metabolic requirements. Data from Abrahamson et al., AJP 2020 (n = 8); Chin et al., CJA 2021 (n = 5); and Ragoonanan et al., Anesthesiology 2009 (n = 5).
Figure 3
Figure 3
Cardiac output and global oxygen delivery in rats at varying levels of anemia. (A) A strong inverse relationship (y = -0.07x + 24.9, r2 = 0.83) is observed between cardiac output and arterial blood oxygen content. Decreasing arterial oxygen content and increasing severity of anemia results in a proportional increase in cardiac output. (B) A strong positive relationship (y = 0.01x + 0.86, r2 = 0.82) is observed between global oxygen delivery and arterial oxygen content. Reduced arterial oxygen content results in decreased global oxygen delivery, especially under severe anemic conditions. Data from Tsui et al. 2014.
Figure 4
Figure 4
Blood flow and tissue oxygen delivery to the brain and kidney of rats at varying levels of anemia. (A) Renal artery blood flow does not change significantly regardless of anemic status (y = -0.0006x + 0.89, r2 = 0.14). Common carotid artery flow increases proportionally as arterial blood oxygen content decreases and anemic status increases in severity (y = -0.004x + 1.53, r2 = 0.29) (n = 5). (B) Both kidney and brain DO2 decrease proportionally as arterial blood oxygen content decreases and anemic status increases in severity. Brain DO2 (y = 0.0005x + 0.06, r2 = 0.28) decreases less profoundly as compared to kidney DO2 at lower arterial blood oxygen content (y = 0.0007x + 0.006, r2 = 0.48) (n = 15). Data from Tsui et al. 2014.
Figure 5
Figure 5
Organ-specific Erythropoietin (EPO) mRNA and systemic EPO versus arterial blood oxygen content in anemic rats. (A) EPO mRNA expression increases exponentially in both kidney tissue and brain tissue as arterial oxygen content decreases (n = 6). Kidney EPO mRNA expression (y = 178590*10−0.018, r2 = 0.71) increases more dramatically than brain EPO mRNA expression (y = 81.72*10−0.007, r2 = 0.57) in severely anemic conditions. (B) Systemic EPO protein concentration increases exponentially (y = 93806*10−0.02, r2 = 0.82) as arterial oxygen content decreases and the severity of anemic status increases (n = 10). Data from Tsui et al. 2011 and 2014.,

References

    1. Goobie SM, DiNardo JA, Faraoni D. Relationship between transfusion volume and outcomes in children undergoing noncardiac surgery. Transfusion. 2016;56:2487–2494. - PubMed
    1. Patel RM. Short- and Long-Term Outcomes for Extremely Preterm Infants. Am J Perinatol. 2016;33:318–328. - PMC - PubMed
    1. Clarke SE, Jukes MC, Njagi JK, et al. Effect of intermittent preventive treatment of malaria on health and education in schoolchildren: a cluster-randomised, double-blind, placebo-controlled trial. Lancet. 2008;372:127–138. - PMC - PubMed
    1. Kyu HH, Pinho C, Wagner JA, et al. Global and National Burden of Diseases and Injuries Among Children and Adolescents Between 1990 and 2013: Findings From the Global Burden of Disease 2013 Study. JAMA Pediatr. 2016;170:267–287. - PMC - PubMed
    1. Daru J, Zamora J, Fernández-Félix BM, et al. Risk of maternal mortality in women with severe anaemia during pregnancy and post partum: a multilevel analysis. Lancet Glob Health. 2018;6:e548–e554. - PubMed

Publication types