

The role of AURKA/miR-199b-3p in hepatocellular carcinoma cells
- PMID: 36377304
- PMCID: PMC9756977
- DOI: 10.1002/jcla.24758
The role of AURKA/miR-199b-3p in hepatocellular carcinoma cells
Abstract
Background: Previous studies proved that AURKA functions as an oncogene in several cancers. This article aimed to probe the miRNA-induced regulatory mechanism of AURKA in hepatocellular carcinoma (HCC).
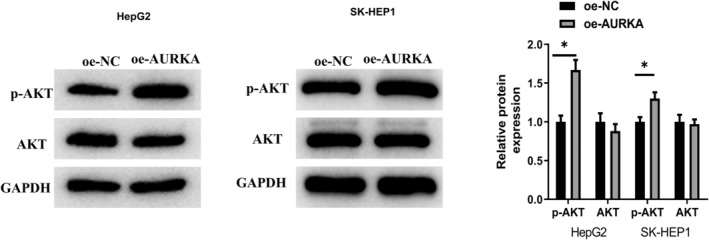
Methods: Differentially expressed genes in TCGA-LIHC dataset were screened by bioinformatics methods. Levels of miR-199b-3p and AURKA mRNA were examined by qRT-PCR. Western blot was utilized to evaluate protein levels of AURKA, p-AKT, and AKT. Dual-luciferase assay was introduced to explore their interaction. MTT, colony formation, scratch healing, transwell, and flow cytometry assays were introduced into cell proliferation, migration, invasion, and apoptosis assessment. The impact of miR-199b-3p/AURKA axis on HCC tumor growth was determined in a tumor xenograft model.
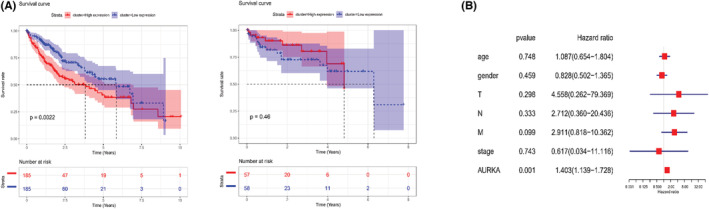
Results: We found that AURKA was highly expressed in HCC and was coupled to poor prognosis of HCC. As manifested by cellular assays, compared to the normal cells HL-7702, AURKA presented notably high expression in HCC cell lines. Overexpressed AURKA evidently impelled the proliferation, colony formation, migration, and invasion of HCC cells while suppressing apoptosis. The regulatory gene upstream of AURKA was predicted to be miR-199b-3p by bioinformatics method, and there was a markedly negative correlation between the two. Overexpressed miR-199b-3p constrained HCC cell proliferation, migration, and invasion while fostering apoptosis, which could be counteracted by upregulating AURKA. MiR-199b-3p repressed the tumor growth in vivo by targeting AURKA and affected PI3K/AKT signaling pathway.
Conclusion: To summarize, this study implied the regulatory mechanism of miR-199b-3p/AURKA axis in HCC, and supplied optional therapeutic targets for HCC patients.
Keywords: AURKA; hepatocellular carcinoma; invasion; miR-199b-3p; migration; proliferation.
© 2022 The Authors. Journal of Clinical Laboratory Analysis published by Wiley Periodicals LLC.
Conflict of interest statement
The authors declare no conflicts of interest.
Figures


Similar articles
-
The role of Aurora kinase A in hepatocellular carcinoma: Unveiling the intriguing functions of a key but still underexplored factor in liver cancer.Cell Prolif. 2024 Aug;57(8):e13641. doi: 10.1111/cpr.13641. Epub 2024 Apr 8. Cell Prolif. 2024. PMID: 38590119 Free PMC article. Review.
-
MiR-101-3p targets the PI3K-AKT signaling pathway via Birc5 to inhibit invasion, proliferation, and epithelial-mesenchymal transition in hepatocellular carcinoma.Clin Exp Med. 2025 Mar 19;25(1):88. doi: 10.1007/s10238-025-01622-1. Clin Exp Med. 2025. PMID: 40106068 Free PMC article.
-
MiR-92a-3p Promotes the Malignant Progression of Hepatocellular Carcinoma by Mediating the PI3K/AKT/mTOR Signaling Pathway.Curr Pharm Des. 2021;27(29):3244-3250. doi: 10.2174/1381612827666210612054156. Curr Pharm Des. 2021. PMID: 34126886
-
IFN-treated macrophage-derived exosomes prevents HBV-HCC migration and invasion via regulating miR-106b-3p/PCGF3/PI3K/AKT signaling axis.Front Cell Infect Microbiol. 2024 Oct 28;14:1421195. doi: 10.3389/fcimb.2024.1421195. eCollection 2024. Front Cell Infect Microbiol. 2024. PMID: 39529637 Free PMC article.
-
Regulating the regulator: a survey of mechanisms from transcription to translation controlling expression of mammalian cell cycle kinase Aurora A.Open Biol. 2022 Sep;12(9):220134. doi: 10.1098/rsob.220134. Epub 2022 Sep 7. Open Biol. 2022. PMID: 36067794 Free PMC article. Review.
Cited by
-
Disulfidptosis and ferroptosis related genes predict prognosis and personalize treatment for hepatocellular carcinoma.Transl Cancer Res. 2024 Feb 29;13(2):496-514. doi: 10.21037/tcr-23-1594. Epub 2024 Feb 27. Transl Cancer Res. 2024. PMID: 38482398 Free PMC article.
-
An Integrated Framework to Identify Prognostic Biomarkers and Novel Therapeutic Targets in Hepatocellular Carcinoma-Based Disabilities.Biology (Basel). 2024 Nov 24;13(12):966. doi: 10.3390/biology13120966. Biology (Basel). 2024. PMID: 39765633 Free PMC article.
-
The role of Aurora kinase A in hepatocellular carcinoma: Unveiling the intriguing functions of a key but still underexplored factor in liver cancer.Cell Prolif. 2024 Aug;57(8):e13641. doi: 10.1111/cpr.13641. Epub 2024 Apr 8. Cell Prolif. 2024. PMID: 38590119 Free PMC article. Review.
-
Evaluation of the Efficacy of OSU-2S in the Treatment of Non-Small-Cell Lung Cancer and Screening of Potential Targets of Action.Pharmaceuticals (Basel). 2024 May 1;17(5):582. doi: 10.3390/ph17050582. Pharmaceuticals (Basel). 2024. PMID: 38794152 Free PMC article.
References
-
- Kollareddy M, Dzubak P, Zheleva D, Hajduch M. Aurora kinases: structure, functions and their association with cancer. Biomed Pap Med Fac Univ Palacky Olomouc Czech Repub. 2008;152(1):27‐33. - PubMed
MeSH terms
Substances
Grants and funding
LinkOut - more resources
Full Text Sources
Medical
Research Materials
Miscellaneous
