. 2022 Dec 20;13(6):e0254122.
doi: 10.1128/mbio.02541-22. Epub 2022 Nov 15.

Systems-Wide Dissection of Organic Acid Assimilation in Pseudomonas aeruginosa Reveals a Novel Path To Underground Metabolism

Affiliations

Systems-Wide Dissection of Organic Acid Assimilation in Pseudomonas aeruginosa Reveals a Novel Path To Underground Metabolism

Stephen K Dolan et al. mBio. .

Abstract

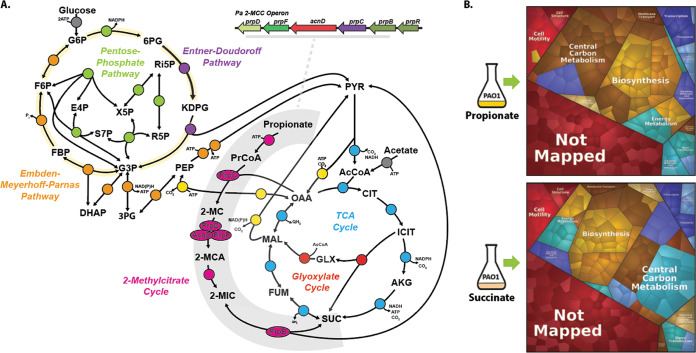
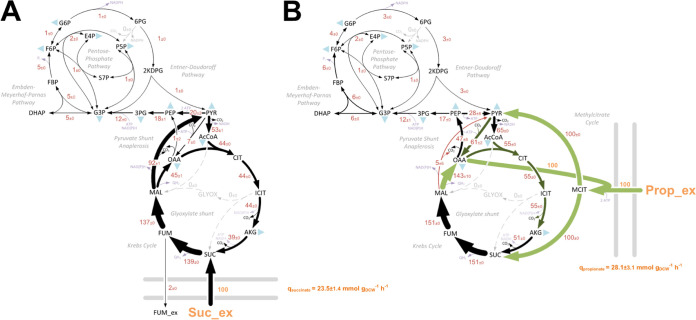
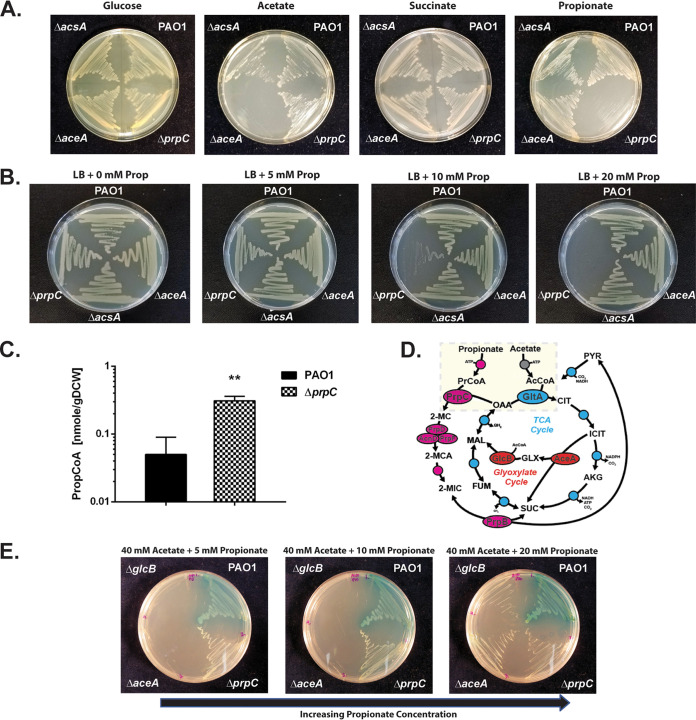
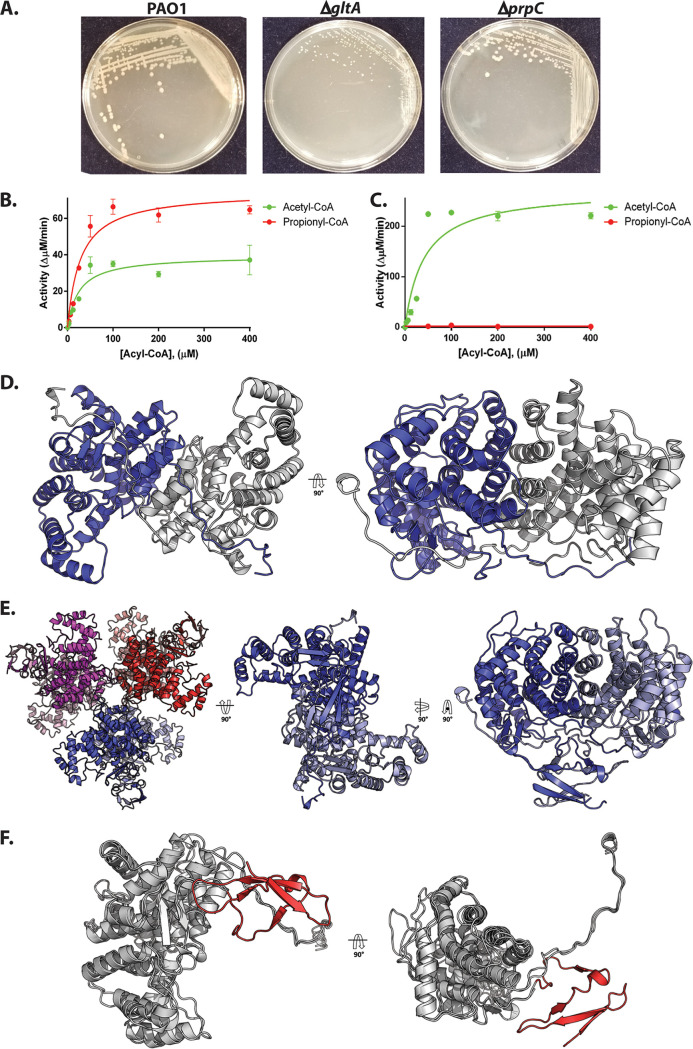
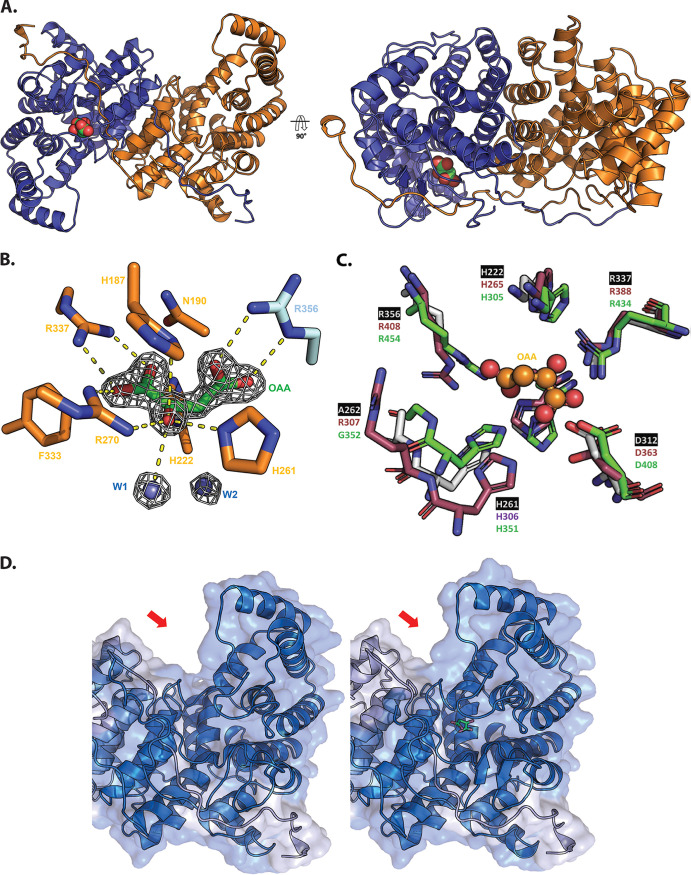
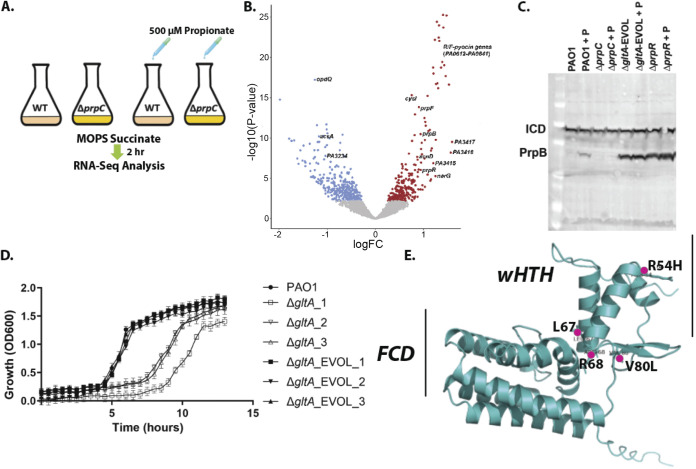
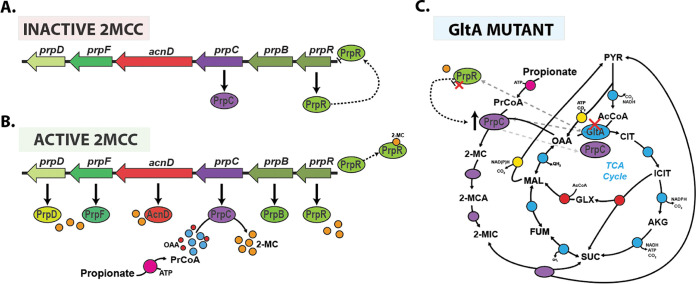
The human pathogen Pseudomonas aeruginosa (Pa) is one of the most frequent and severe causes of nosocomial infection. This organism is also a major cause of airway infections in people with cystic fibrosis (CF). Pa is known to have a remarkable metabolic plasticity, allowing it to thrive under diverse environmental conditions and ecological niches; yet, little is known about the central metabolic pathways that sustain its growth during infection or precisely how these pathways operate. In this work, we used a combination of 'omics approaches (transcriptomics, proteomics, metabolomics, and 13C-fluxomics) and reverse genetics to provide systems-level insight into how the infection-relevant organic acids succinate and propionate are metabolized by Pa. Moreover, through structural and kinetic analysis of the 2-methylcitrate synthase (2-MCS; PrpC) and its paralogue citrate (CIT) synthase (GltA), we show how these two crucial enzymatic steps are interconnected in Pa organic acid assimilation. We found that Pa can rapidly adapt to the loss of GltA function by acquiring mutations in a transcriptional repressor, which then derepresses prpC expression. Our findings provide a clear example of how "underground metabolism," facilitated by enzyme substrate promiscuity, "rewires" Pa metabolism, allowing it to overcome the loss of a crucial enzyme. This pathogen-specific knowledge is critical for the advancement of a model-driven framework to target bacterial central metabolism. IMPORTANCE Pseudomonas aeruginosa is an opportunistic human pathogen that, due to its unrivalled resistance to antibiotics, ubiquity in the built environment, and aggressiveness in infection scenarios, has acquired the somewhat dubious accolade of being designated a "critical priority pathogen" by the WHO. In this work, we uncover the pathways and mechanisms used by P. aeruginosa to grow on a substrate that is abundant at many infection sites: propionate. We found that if the organism is prevented from metabolizing propionate, the substrate turns from being a convenient nutrient source into a potent poison, preventing bacterial growth. We further show that one of the enzymes involved in these reactions, 2-methylcitrate synthase (PrpC), is promiscuous and can moonlight for another essential enzyme in the cell (citrate synthase). Indeed, mutations that abolish citrate synthase activity (which would normally prevent the cell from growing) can be readily overcome if the cell acquires additional mutations that increase the expression of PrpC. This is a nice example of the evolutionary utility of so-called "underground metabolism."

Keywords: 2-methylcitrate cycle; Pseudomonas aeruginosa; central metabolism; enzyme promiscuity; propionate metabolism; underground metabolism.


Conflict of interest statement

The authors declare no conflict of interest.

Figures

FIG 1
FIG 1
Proteomic analysis of Pa grown on succinate and propionate. (A) Schematic depicting the Pa 2-methylcitrate cycle (2MCC) in Pa central carbon metabolism. The Pa central metabolic network shown here consists of six main blocks, designated with different colors: (i) the Embden-Meyerhoff-Parnas pathway (EMP; orange); (ii) the pentose phosphate pathway (PPP; green); (iii) the Entner-Doudoroff pathway (EDP; purple); (iv) the tricarboxylic acid cycle (TCA; blue) and glyoxylate shunt (red); (v) anaplerotic and gluconeogenic reactions (yellow); and (vi) the 2MCC (pink). The 2MCC operon arrangement (inset, gray underline) consists of genes that encode a transcriptional regulator (designated here as prpR), which is thought to encode a ligand-responsive repressor, a methylcitrate synthase (prpC), which condenses propionyl-CoA (PrCoA) with oxaloacetate (OAA) to form 2-methylcitrate (2-MC), a 2-methylcitrate dehydratase/hydratase (prpD), which dehydrates 2-MC to yield 2-methylaconitate (2-MCA), a 2-methylcitrate dehydratase (acnD) and 2-methylaconitate cis-trans isomerase (prpF), which provide an alternative route for the generation of 2-MCA from 2-MC (the reason for an alternative route for 2-MCA generation in Pa is currently unclear), and a 2-methylisocitrate lyase (prpB), which cleaves 2-methylisocitrate (2-MIC) to yield pyruvate (PYR) and succinate (SUC). Note that the 2-MCA generated in the PrpD or AcnD/PrpF reactions is rehydrated by an unlinked aconitase (likely AcnB in Pa) to yield the PrpB substrate 2-MIC. Also, the enzyme responsible for the initial activation of propionate to yield PrCoA has not yet been identified for Pa, although in other organisms this function is carried out by a dedicated propionyl-CoA synthase (PrpE), by acetyl-CoA synthase (AcsA), by a combination of phosphotransacetylase (Pta) and acetate kinase (AckA) activities, or by an additional, uncharacterized propionyl-CoA ligase (7). AcCoA, acetyl-coenzyme A; CIT, citrate; ICIT, isocitrate; AKG, α-ketoglutarate; FUM, fumarate; MAL, malate; KDPG, 2-keto-3-deoxy-6-phosphogluconate; G3P, glyceraldehyde 3-phosphate; FBP, fructose 1,6-bisphosphate; F6P, fructose 6-phosphate; G6P, glucose 6-phosphate; 6PG, 6-phosphogluconate; Ri5P, ribulose 5-phosphate; R5P, ribose 5-phosphate; X5P, xylulose 5-phosphate; S7P, sedoheptulose 7-phosphate; E4P, erythrose 4-phosphate; PEP, phosphoenolpyruvate. (B) Illustration of the statistically significant proteomic changes (P ≤ 0.05, fold change of ≥1) during growth on propionate or succinate, as represented by Voronoi tessellations. Pathway assignment was performed using the KEGG data set. Proteome alterations that could not be assigned to a specific pathway (uncharacterised/hypothetical proteins) are shown as “Not Mapped.” The specific protein identities for the protein clusters that were upregulated during growth on propionate are shown in Fig. S1A in the supplemental material, and statistical analyses of these data are illustrated in Fig. S1B to D. The complete proteomics data set is presented in Data Set S1.
FIG 2
FIG 2
(A and B) In vivo carbon flux distributions in central metabolism of Pa PAO1 during growth on succinate (A) or propionate (B) as sole carbon sources. Flux is expressed as a molar percentage of the average uptake rate for succinate (23.5 mmol g−1 h−1) or propionate (28.1 mmol g−1 h−1), calculated from the individual rates in Data Set S2 in the supplemental material. Anabolic pathways from 11 precursors to biomass are indicated by the filled blue triangles. The flux distributions with bidirectional resolution (i.e., net and exchange fluxes), including the drain from metabolic intermediates to biomass and confidence intervals of the flux estimates, are provided in Data Set S2. The errors given for each flux reflect the corresponding 90% confidence intervals. The full flux data sets are presented in Data Set S2. Colors qualitatively indicate fluxomic correlation with changes on the protein level during growth on propionate compared with growth on succinate (light green or red, significant up- or downregulation (respectively); dark green or red, less significant up- or downregulation).
FIG 3
FIG 3
The Pa ORF (prpC) encoding 2-methylcitrate synthase is essential for growth on propionate. (A) Wild-type Pa (PAO1) and the ΔacsA, ΔaceA, and ΔprpC mutants all grow comparably on MOPS agar containing glucose (20 mM) or succinate (30 mM) as a sole carbon source. The ΔacsA mutant has a growth defect during growth on MOPS-acetate (40 mM) and MOPS-propionate (40 mM). The ΔprpC mutant cannot grow on MOPS propionate. The plates were photographed after 24 h of incubation. (B) Wild-type PAO1 and the ΔacsA, ΔaceA, and ΔprpC mutants were cultured on LB agar containing an increasing concentration of propionate (0, 5, 10, and 20 mM, as indicated). The ΔprpC mutant displays a pronounced growth defect in the presence of propionate concentrations of >10 mM. The plates were photographed after 24 h of incubation. (C) Intracellular propionyl-CoA concentration in wild-type Pa (PAO1) and in the ΔprpC mutant following a 3-h exposure to propionate (5 mM) during growth in succinate (unpaired t test with Welch’s correction, P = 0.0026). The experiment was performed using biological triplicates. (D) Illustration of the interwoven reactions for propionate and acetate activation in Pa, feeding into the 2-methylcitrate cycle and TCA cycle, respectively. Following uptake, acetate and propionate are activated by AcsA. The resulting propionyl-CoA (PrCoA) is condensed with oxaloacetate (OAA) in a PrpC-catalyzed reaction to form 2-methylcitrate (2-MC), whereas the acetyl-CoA (AcCoA) is condensed with oxaloacetate in a GltA-catalyzed reaction to form citrate (CIT). (E) Growth of the Pa glyoxylate shunt mutants ΔaceA and ΔglcB is blocked on MOPS agar plates containing a combination of high acetate concentration (40 mM) and low propionate concentration (5 mM) as the carbon source. However, this growth inhibition is partially overcome by increasing the propionate concentration to 20 mM (left to right in the figure). The plates were photographed after 48 h of growth. The data are representative of two independent experiments, each performed in triplicate.
FIG 4
FIG 4
Biochemical and structural analysis of PrpC and GltA from Pa. (A) A ΔgltA mutant exhibits a growth defect when cultured on LB agar, whereas a ΔprpC mutant displays a wild-type colony morphotype. The plates were photographed after 48 h. The data are representative of two independent experiments, each performed in triplicate. (B) Purified PrpCPa exhibits both citrate synthase activity (with acetyl-CoA as a substrate) and 2-methylcitrate synthase activity (with propionyl-CoA as a substrate). The concentration of OAA in each reaction was fixed at 0.5 mM. The data are representative of two independent experiments, each performed in triplicate. (C) Purified GltAPa is a citrate synthase with no detectable 2-methylcitrate synthase activity. The concentration of OAA was fixed at 0.5 mM. The data are representative of two independent experiments, each performed in triplicate. (D) The X-ray crystal structure of PrpCPa (PDB: 6S6F). PrpCPa is a homodimer. In the ribbon diagram shown, the protomers are colored blue and gray. (E) Cartoon representation of the GltAPa hexamer in the asymmetric unit (left) and, for comparison with PrpCPa, the extracted GltAPa dimers (middle and right). (F) Superposition of the PrpCPa and GltAPa structures. PrpCPa and GltAPa share similar core α-helical folds (shown in gray to highlight similarities). However, GltAPa has an additional antiparallel β-sheet at its N terminus (colored in red to showcase differences).
FIG 5
FIG 5
Structural analysis of oxaloacetate-bound PrpCPa. (A) Crystal structure of oxaloacetate-bound PrpCPa represented in cartoon (PDB: 6S87). One protomer is colored blue and the other orange. A 90° rotation about the x axis is shown (right). Oxaloacetate is shown as green and red spheres. (B) Oxaloacetate binding site from P. aeruginosa PrpC chain D. Water molecules are shown in cyan spheres. Chain D and chain C residues are shown in orange and cyan, respectively. The electron density map (2Fo-Fc) in white is contoured at 1.5σ. (C) Superposition of the PrpCPa (white), GltAPa (pink), and A. fumigatus PrpC (5UQR) (green) oxaloacetate binding site. Oxaloacetate is shown in orange spheres. Most of the amino acid residues forming this site are conserved, except R307 (GltAPa numbering). (D) The left-hand image shows the open (red) apo conformation of PrpCPa, the middle image shows the partially closed (blue) holo conformation of PrpCPa, and the right-hand image shows a superposition of both conformations of PrpCPa. Note the structural rearrangement in the oxaloacetate-bound PrpCPa protomer (indicated by the red arrow).
FIG 6
FIG 6
RNA-seq analysis uncovers that propionate exposure induces expression of the prp operon and of the genes associated with branched-chain amino acid catabolism in Pa. (A) Schematic of the experimental design. At an OD of 0.2, 500 μM sodium propionate was spiked into (triplicate) cultures of PAO1 and the ΔprpC mutant. An equal volume of H2O was added to the control PAO1 and ΔprpC-mutant cultures (also grown in triplicate). The cultures were harvested 2 h after the propionate addition, corresponding to an OD600 of ≅0.6 (exponential growth), and RNA-seq analysis was carried out. (B) Volcano plot illustrating the log2 fold change in transcript abundance versus adjusted P values for wild-type PAO1 grown in MOPS-succinate versus wild-type PAO1 grown in MOPS-succinate + 500 μM propionate. Transcripts that are significantly (q < 0.05) increased (red) or decreased (blue) in abundance are indicated. Selected transcripts are labeled. (C) Western blot showing protein expression levels of PrpB (32.1 kDa) in PAO1 and in the ΔprpC mutant, the ΔgltA_EVOL mutant, and the ΔprpR mutant after exposure to 4 mM propionate (+P) for 3 h. Isocitrate dehydrogenase (ICD; 45.6 kDa) served as loading control. Note that the ΔgltA_EVOL and ΔprpR mutants display constitutively active PrpB expression, independent of propionate addition. Data are representative of three independent experiments. (D) Growth of ΔgltA and ΔgltA_EVOL1 to 3 mutants compared with PAO1 in MOPS-acetate medium. The data are representative of three independent experiments, each performed in triplicate. (E) AlphaFold model of PrpR with the locations of the residues mutated and/or deleted in the ΔgltA_EVOL_1 to 3 mutants highlighted. The winged helix-turn-helix (wHTH) motif and the GntR family FadR C-terminal domain (FCD) are shown.
FIG 7
FIG 7
Model for the operation of the 2MCC in Pa. (A) During growth in the absence of propionate or propionyl-CoA generating substrates, the 2MCC operon (prp) expression is repressed through the binding of PrpR to its upstream promoter region. Incomplete repression of the operon (from basal cellular propionyl-CoA or competing transcriptional activators) results in a basal, low level of prpC transcription. (B) As the cellular propionyl-CoA levels rise, this metabolite is condensed with oxaloacetate by PrpC, resulting in the formation of 2-MC; 2-MC likely then binds to PrpR, inducing conformational changes that lead to the dissociation of PrpR from the DNA. This derepresses the prp operon, allowing expression of the 2MCC enzymes. However, as the concentration of propionyl-CoA falls (due to depletion of propionate or BCAAs due to 2MCC activity) so too does the concentration of 2-MC, which, in turn, leads to rebinding of PrpR to the prp promoter region and a resumption in prp operon repression. (C) In the absence of citrate synthase (GltA), Pa can survive because of the low-level basal expression of PrpC, a promiscuous enzyme that also has citrate synthase activity. However, this low total citrate synthase activity is unable to meet cellular demand, resulting in a severe growth defect and a strong selection pressure to acquire mutations that increase prpC expression. Based on our work, it seems that mutations in prpR that abolish its repressor activity are the most commonly selected mechanism for achieving this. These mutations lead to constitutive expression of the prp genes and, thus, an increase total cellular citrate synthase activity (compensating for the loss of GltA activity).

References

    1. Rossi E, La Rosa R, Bartell JA, Marvig RL, Haagensen JAJ, Sommer LM, Molin S, Johansen HK. 2021. Pseudomonas aeruginosa adaptation and evolution in patients with cystic fibrosis. Nat Rev Microbiol 19:331–342. doi: 10.1038/s41579-020-00477-5. - DOI - PubMed
    1. Sonnleitner E, Abdou L, Haas D. 2009. Small RNA as global regulator of carbon catabolite repression in Pseudomonas aeruginosa. Proc Natl Acad Sci USA 106:21866–21871. doi: 10.1073/pnas.0910308106. - DOI - PMC - PubMed
    1. Sun Z, Kang Y, Norris MH, Troyer RM, Son MS, Schweizer HP, Dow SW, Hoang TT. 2014. Blocking phosphatidylcholine utilization in Pseudomonas aeruginosa, via mutagenesis of fatty acid, glycerol and choline degradation pathways, confirms the importance of this nutrient source in vivo. PLoS One 9:e103778. doi: 10.1371/journal.pone.0103778. - DOI - PMC - PubMed
    1. Palmer KL, Mashburn LM, Singh PK, Whiteley M. 2005. Cystic fibrosis sputum supports growth and cues key aspects of Pseudomonas aeruginosa physiology. J Bacteriol 187:5267–5277. doi: 10.1128/JB.187.15.5267-5277.2005. - DOI - PMC - PubMed
    1. Flynn JM, Niccum D, Dunitz JM, Hunter RC. 2016. Evidence and role for bacterial mucin degradation in cystic fibrosis airway disease. PLoS Pathog 12:e1005846. doi: 10.1371/journal.ppat.1005846. - DOI - PMC - PubMed

LinkOut - more resources