. 2023 Jan 1;59(1):12-19.
doi: 10.1097/SHK.0000000000002036. Epub 2022 Nov 16.

TRAUMA INDUCES INTRAVASCULAR HEMOLYSIS, EXACERBATED BY RED BLOOD CELL TRANSFUSION AND ASSOCIATED WITH DISRUPTED ARGININE-NITRIC OXIDE METABOLISM

Affiliations

TRAUMA INDUCES INTRAVASCULAR HEMOLYSIS, EXACERBATED BY RED BLOOD CELL TRANSFUSION AND ASSOCIATED WITH DISRUPTED ARGININE-NITRIC OXIDE METABOLISM

Terry R Schaid Jr et al. Shock. .

Abstract

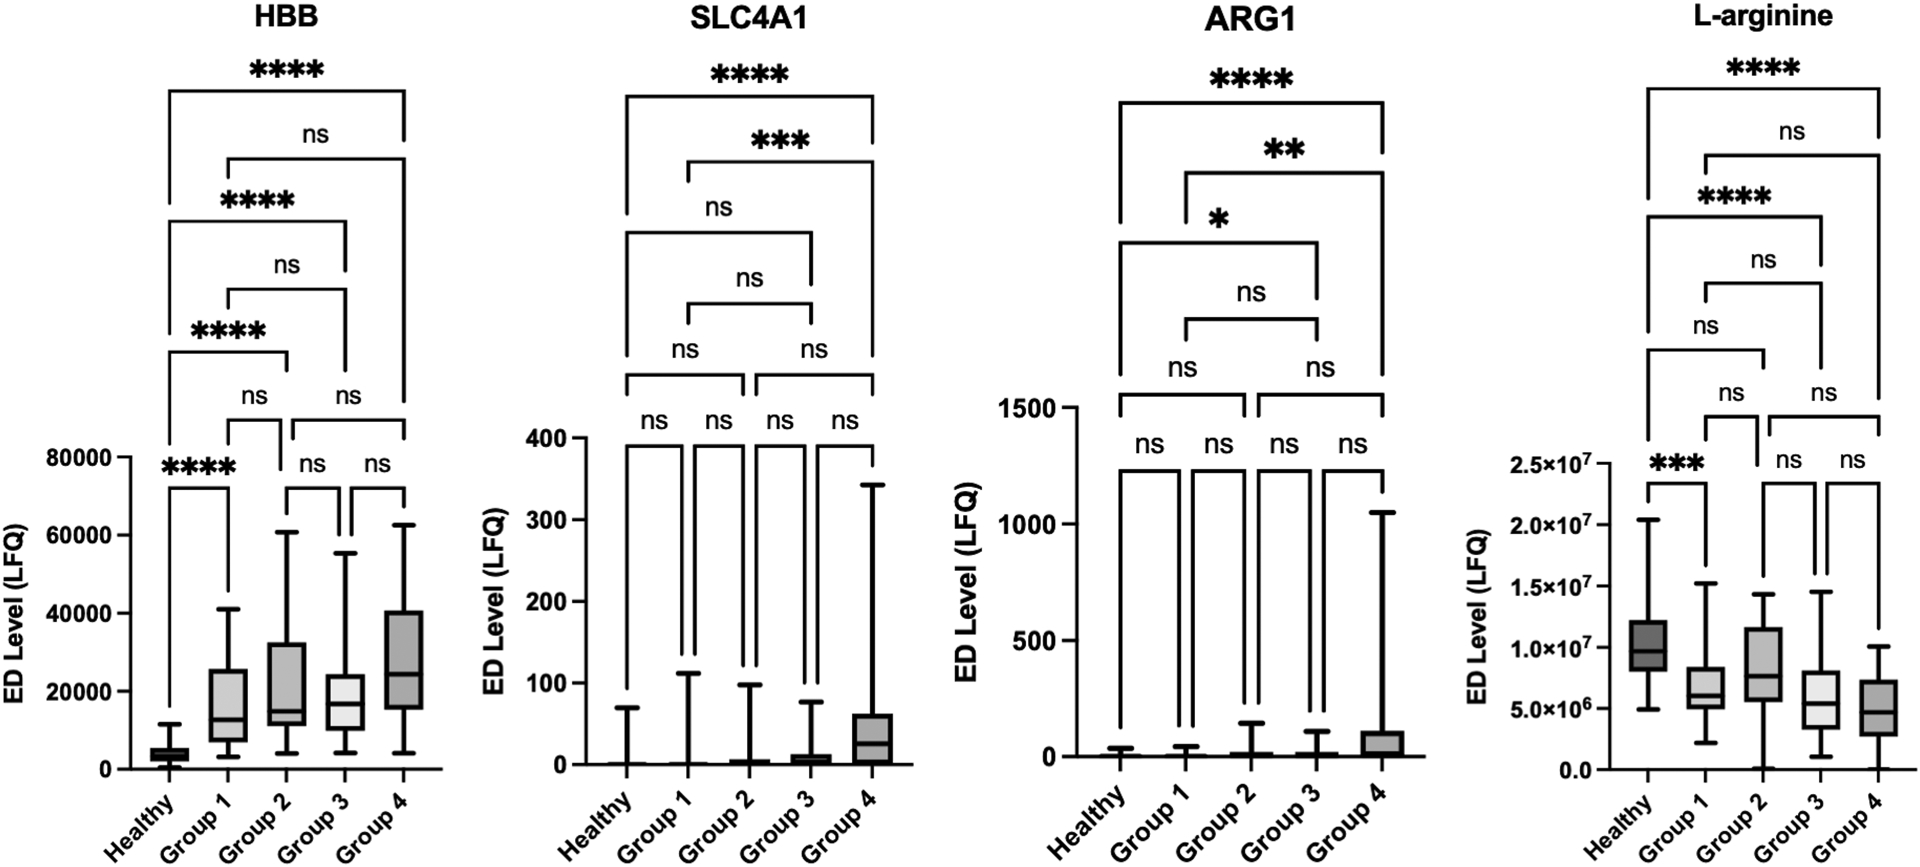
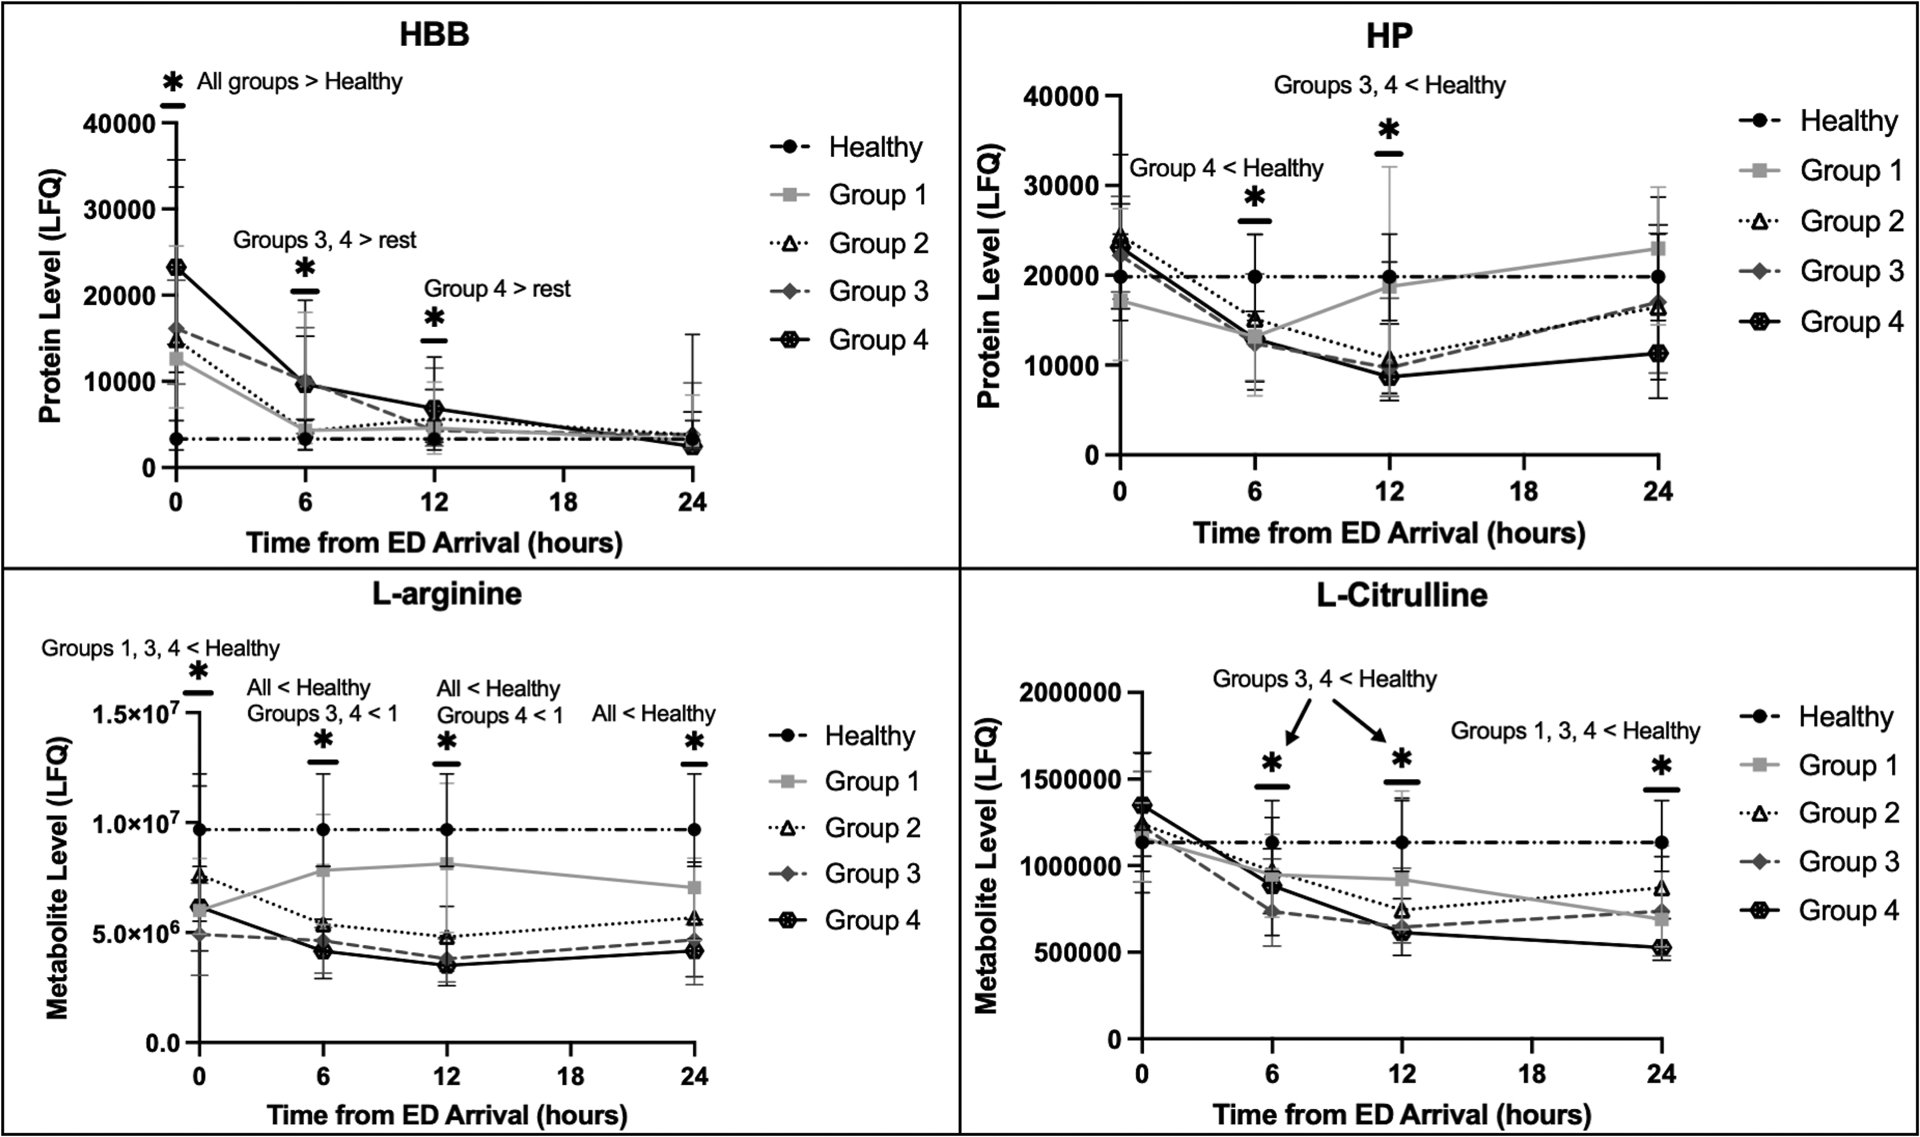
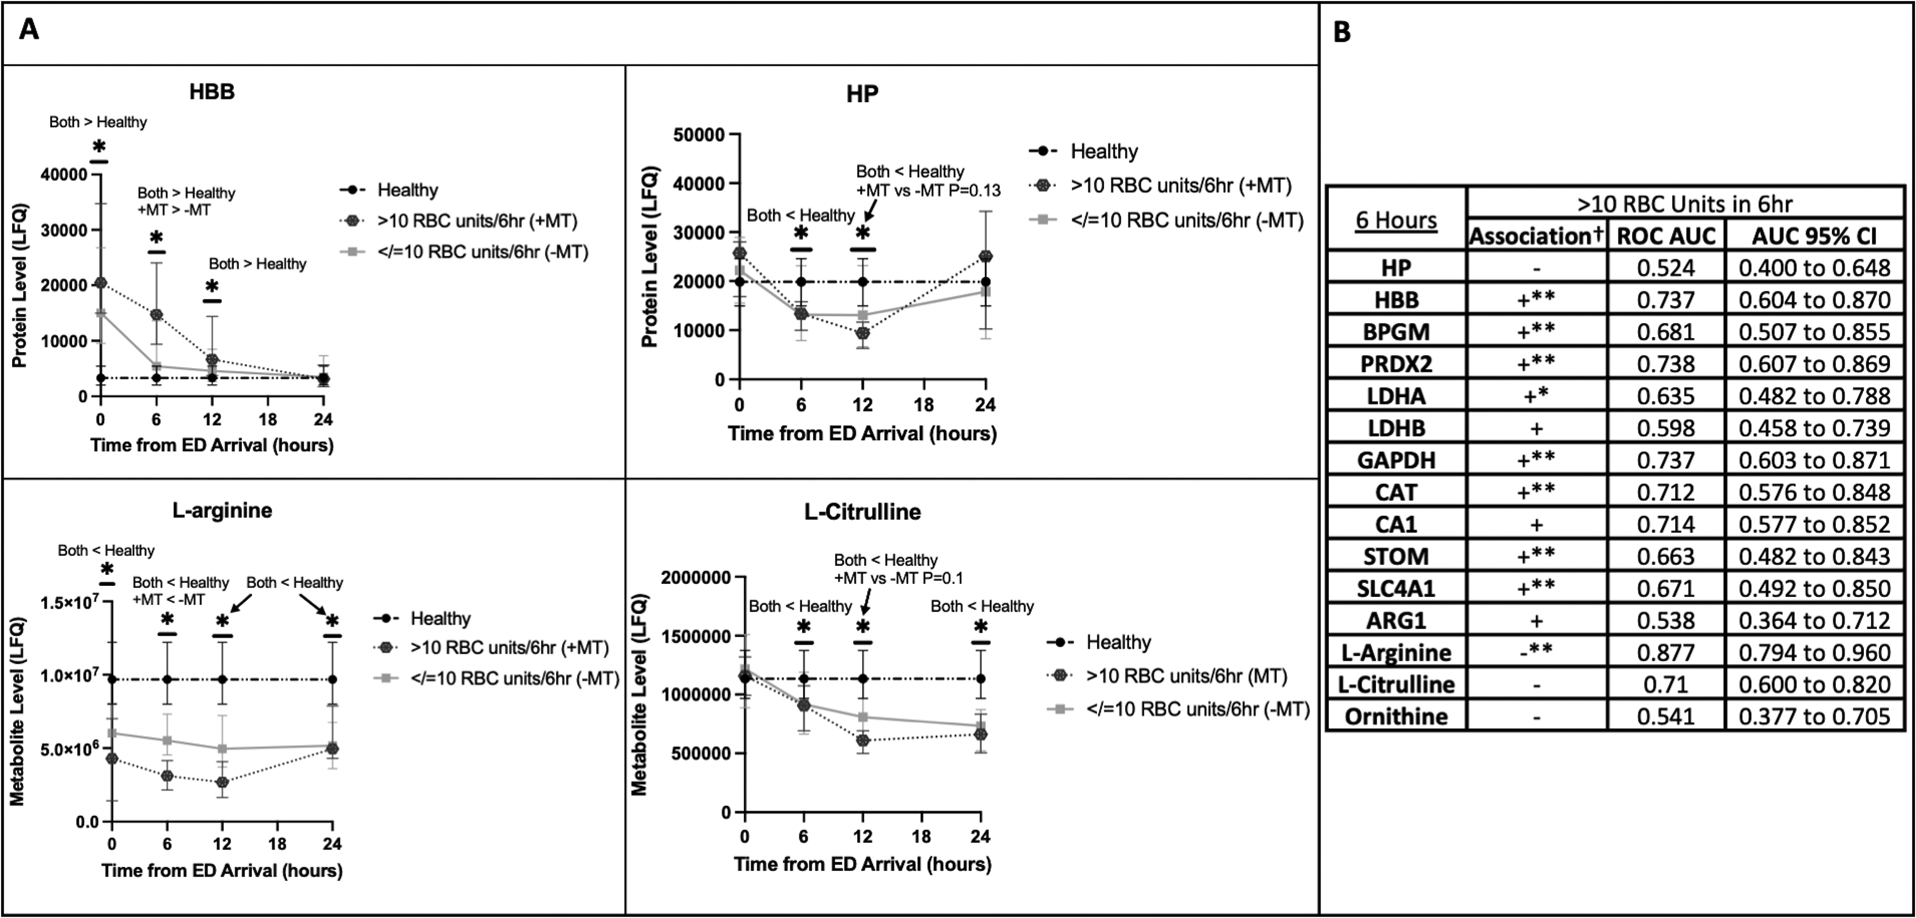
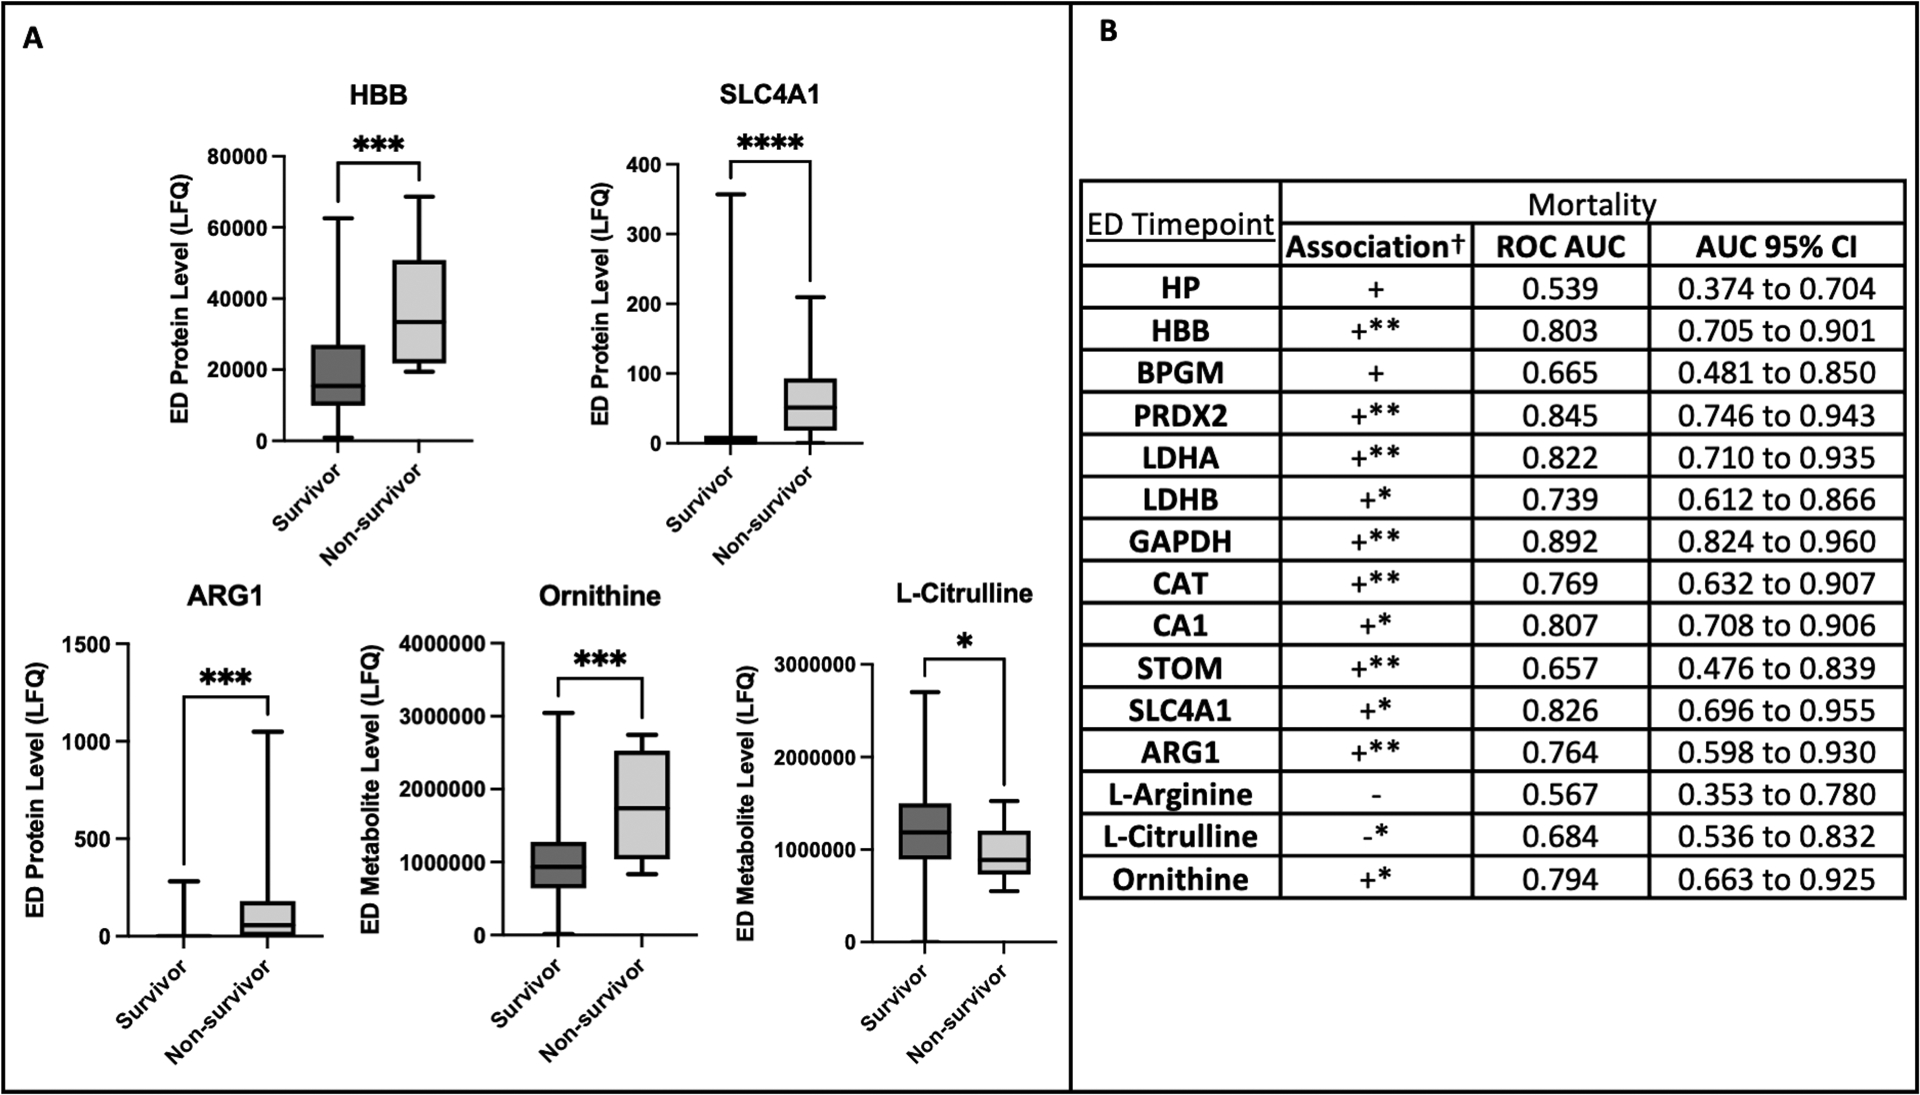
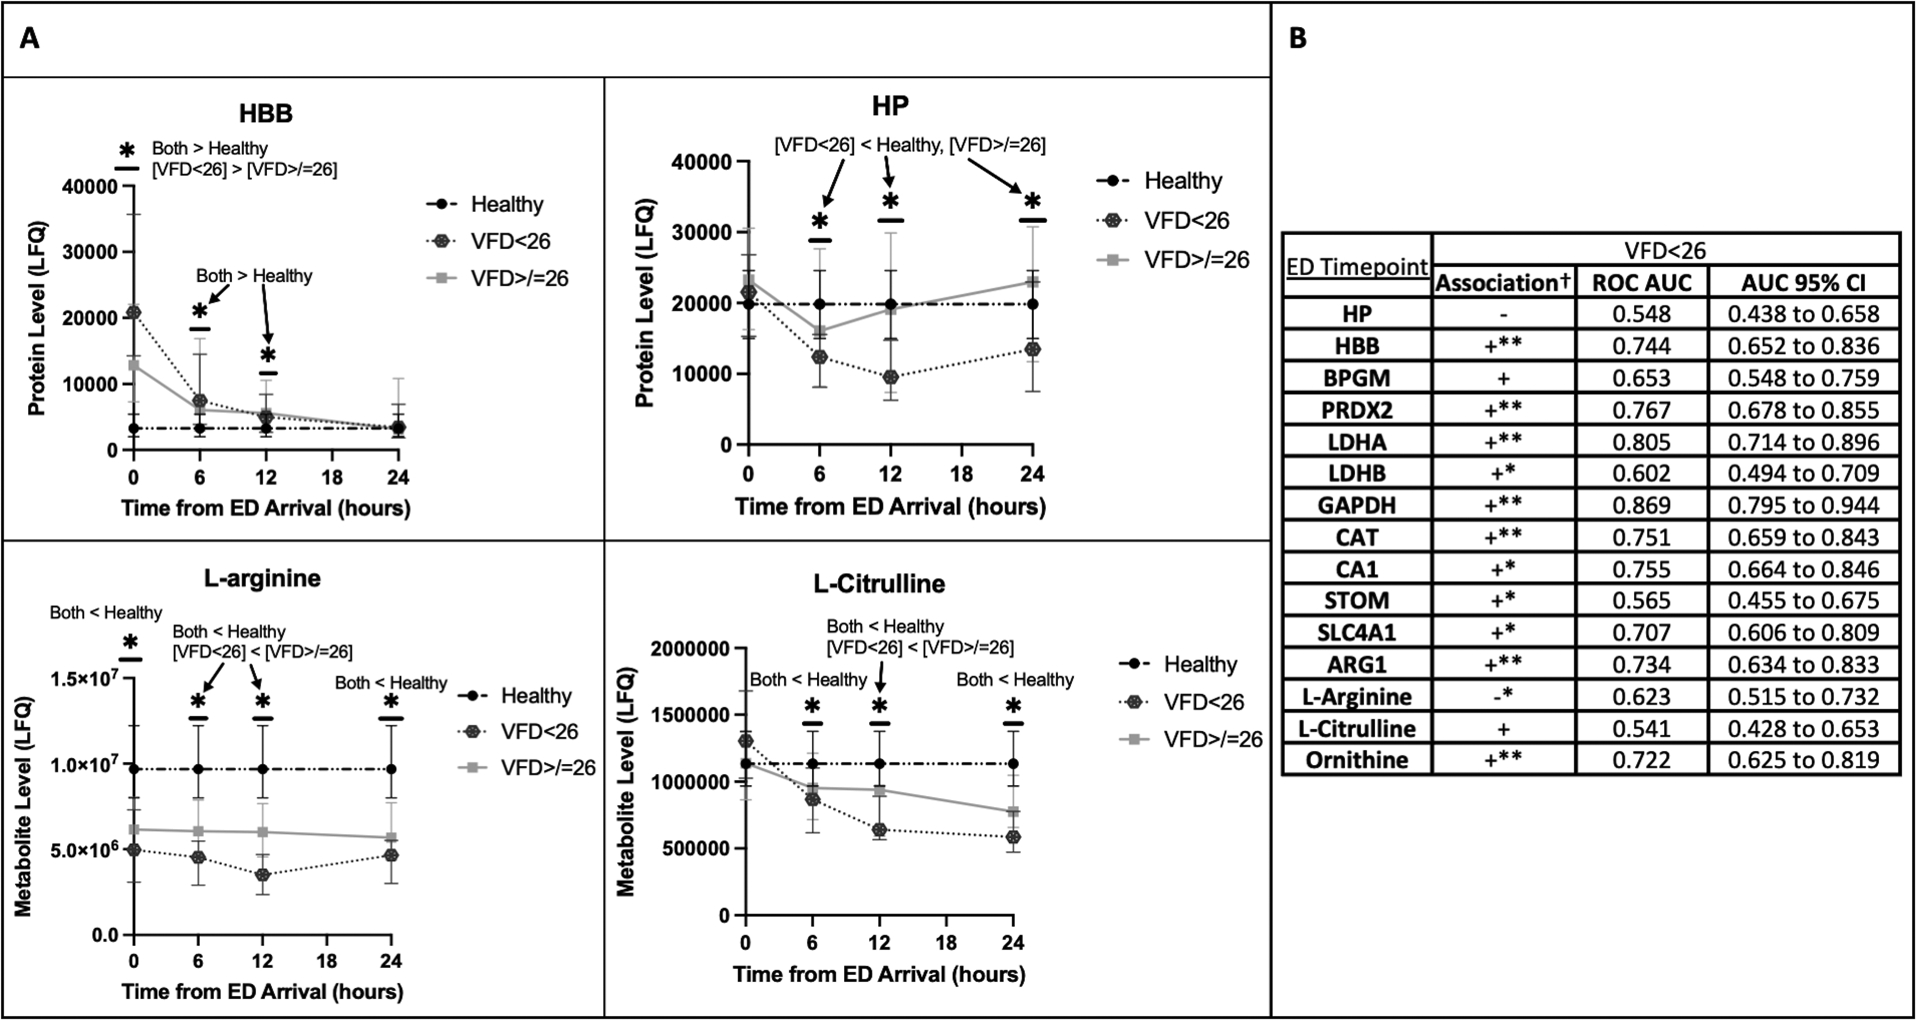
Background: Severe injury can provoke systemic processes that lead to organ dysfunction, and hemolysis of both native and transfused red blood cells (RBCs) may contribute. Hemolysis can release erythrocyte proteins, such as hemoglobin and arginase-1, the latter with the potential to disrupt arginine metabolism and limit physiologic NO production. We aimed to quantify hemolysis and arginine metabolism in trauma patients and measure association with injury severity, transfusions, and outcomes. Methods: Blood was collected from injured patients at a level I trauma center enrolled in the COMBAT (Control of Major Bleeding After Trauma) trial. Proteomics and metabolomics were performed on plasma fractions through liquid chromatography coupled with mass spectrometry. Abundances of erythrocyte proteins comprising a hemolytic profile as well as haptoglobin, l -arginine, ornithine, and l -citrulline (NO surrogate marker) were analyzed at different timepoints and correlated with transfusions and adverse outcomes. Results: More critically injured patients, nonsurvivors, and those with longer ventilator requirement had higher levels of hemolysis markers with reduced l -arginine and l -citrulline. In logistic regression, elevated hemolysis markers, reduced l -arginine, and reduced l -citrulline were significantly associated with these adverse outcomes. An increased number of blood transfusions were significantly associated with elevated hemolysis markers and reduced l -arginine and l -citrulline independently of New Injury Severity Score and arterial base excess. Conclusions: Severe injury induces intravascular hemolysis, which may mediate postinjury organ dysfunction. In addition to native RBCs, transfused RBCs can lyse and may exacerbate trauma-induced hemolysis. Arginase-1 released from RBCs may contribute to the depletion of l -arginine and the subsequent reduction in the NO necessary to maintain organ perfusion.


Conflict of interest statement

The authors report no conflicts of interest.

Figures

Figure 1.
Figure 1.
More critically injured patients had increased hemolysis on emergency department (ED) arrival with elevated plasma arginase-1 (ARG1) and decreased L-arginine. Hemoglobin beta (HBB) and band 3 anion transport protein (SLC4A1) are erythrocyte-specific cytoplasmic and membrane proteins, respectively. ED Level refers to the label-free quantification (LFQ) of analyte abundance. Healthy denotes the group of prospectively collected healthy volunteer samples. Shock/injury phenotypes are defined in Table 1 (Groups 1–4). Plots contain boxes displaying the median and interquartile range (IQR) with whiskers denoting the range. ****P<0.0001, ***P<0.001, **P<0.01, *P<0.05, ns (non-significant)
Figure 2.
Figure 2.
Temporal trends of the hemolysis indicators hemoglobin beta (HBB) and haptoglobin (HP) as well as L-arginine and L-citrulline by shock/injury phenotypes, demonstrating hemolysis persisted longer in more critically injured patients, which paralleled persistent reductions in L-arginine and L-citrulline. HBB was elevated early, which was followed by significant decreases in HP, consistent with HP binding free hemoglobin and being cleared from circulation. The Y-axis indicates the label-free quantification (LFQ) of analyte abundances. The healthy volunteer reference level is shown. Shock/injury phenotypes are defined in Table 1 (Groups 1–4). *P<0.05 for the designated comparisons at each timepoint
Figure 3.
Figure 3.
Increased number of red blood cell (RBC) transfusions in the first six hours was associated with increased hemolysis and decreased L-arginine and L-citrulline. A: Temporal trends of the hemolysis indicators hemoglobin beta (HBB) and haptoglobin (HP) as well as L-arginine and L-citrulline for patients who received >10 RBC units in six hours (+MT [massive transfusion]) and those who received 10 or fewer (-MT). The healthy control reference level is shown. The Y-axis indicates the label-free quantification (LFQ) of analyte abundances. *P<0.05 for the designated comparisons at each timepoint. B: Logistic regression with receiver operating characteristic (ROC) curve areas under the curves (AUC) and corresponding 95% confidence intervals (CI) for association of individual analyte levels at six hours with having received >10 RBC units in six hours. †Association in simple logistic regression is designated with “+” if the odds ratio (OR) is >1.0 and “−” if the OR is <1.0. Lack of clinical significance for the label-free quantification of analytes renders actual OR values meaningless. *The 95% CI for the OR in simple logistic regression falls entirely above or below 1.0, and the association is considered statistically significant. **The OR for individual analytes remains statistically significant after adjustment for new injury severity score (NISS) and base excess (BE) in multiple logistic regression.
Figure 4.
Figure 4.
Non-survivors had increased hemolysis on emergency department (ED) arrival with elevated arginase-1 (ARG1), elevated ornithine, and decreased L-citrulline. A: Comparison of ED levels by mortality. Hemoglobin beta (HBB) and band 3 anion transport protein (SLC4A1) are erythrocyte-specific cytoplasmic and membrane proteins, respectively. Protein/metabolite level refers to the label-free quantification (LFQ) of analyte abundance. Plots contain boxes displaying the median and interquartile range (IQR) with whiskers denoting the range. ****P<0.0001, ***P<0.001, *P<0.05. B: Logistic regression with receiver operating characteristic (ROC) curve areas under the curves (AUC) and corresponding 95% confidence intervals (CI) for association of individual analyte levels on ED arrival with mortality. †Association in simple logistic regression is designated with “+” if the odds ratio (OR) is >1.0 and “−” if the OR is <1.0. Lack of clinical significance for the label-free quantification of analytes renders actual OR values meaningless. *The 95% CI for the OR in simple logistic regression falls entirely above or below 1.0, and the association is considered statistically significant. **The OR for individual analytes remains statistically significant after adjustment for new injury severity score (NISS) and base excess (BE) in multiple logistic regression.
Figure 5.
Figure 5.
Increased hemolysis and decreased L-arginine and L-citrulline were associated with longer ventilator requirement. A: Temporal trends of the hemolysis indicators hemoglobin beta (HBB) and haptoglobin (HP) as well as L-arginine and L-citrulline for patients with <26 ventilator-free days (VFD) and those with ≥26 VFD. The healthy control reference level is shown. The Y-axis indicates the label-free quantification (LFQ) of analyte abundances. *P<0.05 for the designated comparisons at each timepoint. B: Logistic regression with receiver operating characteristic (ROC) curve areas under the curves (AUC) and corresponding 95% confidence intervals (CI) for association of individual analyte levels on ED arrival with having <26 VFD. †Association in simple logistic regression is designated with “+” if the odds ratio (OR) is >1.0 and “−” if the OR is <1.0. Lack of clinical significance for the label-free quantification of analytes renders actual OR values meaningless. *The 95% CI for the OR in simple logistic regression falls entirely above or below 1.0, and the association is considered statistically significant. **The OR for individual analytes remains statistically significant after adjustment for new injury severity score (NISS) and base excess (BE) in multiple logistic regression.

References

    1. Hardaway RM, Johnson DG, Elovitz MJ, Houchin DN, Jenkins EB, Burns JW, Jackson DR. Influence of trauma and hemolysis on hemorrhagic shock in dogs. J Trauma. 4:624–641, 1964. - PubMed
    1. Stahl WM. Acute phase protein response to tissue injury. Crit Care Med. 15(6):545–550, 1987. - PubMed
    1. Gando S, Tedo I. The effects of massive transfusion and haptoglobin therapy on hemolysis in trauma patients. Surg Today. 24(9):785–790, 1994. - PubMed
    1. Moore HB, Moore EE, Gonzalez E, Hansen KC, Dzieciatkowska M, Chapman MP, Sauaia A, West B, Banerjee A, Silliman CC. Hemolysis exacerbates hyperfibrinolysis, whereas platelolysis shuts down fibrinolysis: evolving concepts of the spectrum of fibrinolysis in response to severe injury. Shock. 43(1):39–46, 2015. - PMC - PubMed
    1. Muroya T, Kannan L, Ghiran IC, Shevkoplyas SS, Paz Z, Tsokos M, Dalle Lucca JJ, Shapiro NI, Tsokos GC. C4d deposits on the surface of RBCs in trauma patients and interferes with their function. Crit Care Med. 42(5):e364–e372, 2014. - PMC - PubMed

Publication types