. 2022 Nov 15;17(11):e0277616.
doi: 10.1371/journal.pone.0277616. eCollection 2022.

Intra-annual fluctuation in morphology and microfibril angle of tracheids revealed by novel microscopy-based imaging

Affiliations

Intra-annual fluctuation in morphology and microfibril angle of tracheids revealed by novel microscopy-based imaging

Yusuke Kita et al. PLoS One. .

Abstract

Woody cells, such as tracheids, fibers, vessels, rays etc., have unique structural characteristics such as nano-scale ultrastructure represented by multilayers, microfibril angle (MFA), micro-scale anatomical properties and spatial arrangement. Simultaneous evaluation of the above indices is very important for their adequate quantification and extracting the effects of external stimuli from them. However, it is difficult in general to achieve the above only by traditional methodologies. To overcome the above point, a new methodological framework combining polarization optical microscopy, fluorescence microscopy, and image segmentation is proposed. The framework was tested to a model softwood species, Chamaecyparis obtusa for characterizing intra-annual transition of MFA and tracheid morphology in a radial file unit. According our result, this framework successfully traced the both characteristics tracheid by tracheid and revealed the high correlation (|r| > 0.5) between S2 microfibril angles and tracheidal morphology (lumen radial diameter, tangential wall thickness and cell wall occupancy). In addition, radial file based evaluation firstly revealed their complex transitional behavior in transition and latewood. The proposed framework has great potential as one of the unique tools to provide detailed insights into heterogeneity of intra and inter-cells in the wide field of view through the simultaneous evaluation of cells' ultrastructure and morphological properties.


Conflict of interest statement

The authors have declared that no competing interests exist.

Figures

Fig 1
Fig 1. Experimental flows for image detection and analysis.
The S2 microfibril angle (MFA) values of radial and tangential walls were obtained from polarization optical microscopy (POM)-based imaging (step A). Tracheid morphology in a radial file unit was extracted from fluorescence microscopy (FLM)-based imaging and image analyses (step B). Finally, the two results were integrated to simultaneously evaluate S2 MFA and tracheid morphology (step C). Details of each experimental step are explained in the main text.
Fig 2
Fig 2. Example of image concatenation applied to a set of retardation images.
The reconstructed retardation image comprised 72 partly overlapping retardation images in total (9 columns × 8 rows). Each image contained 66% overlapping regions with adjacent image patches in the horizontal and vertical directions.
Fig 3
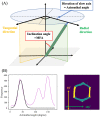
Fig 3. Azimuthal angle calculation from retardation imaging, and selective radial and tangential wall extraction from azimuthal angle distributions.
(A) Definitions of azimuthal angle, and radial and tangential directions in the present experimental condition. Radial and tangential planes are colored green and yellow, respectively. (B) Azimuthal angle distribution (left, purple line) of a hexagonal-shaped tracheid (right). Tangential and radial walls are defined as pixels whose azimuthal angle is near to 45° (left: Area covered by the black curve; right: Yellow pixels, directions of yellow double-headed arrows) or the remaining parts (right: Green pixels).
Fig 4
Fig 4. Examples of retardation, microfibril angle (MFA), and azimuthal angle images.
(A–C) Retardation, MFA, and azimuthal angle images of latewood tracheids. (E–G) those of earlywood tracheids. (D) and (H) Sectional views of retardation (grey solid line) and MFA values (black dotted line) along red lines drawn on latewood tracheids (A and B) and earlywood tracheids (E and F). In (D) and (H), the S2 and S1+S3 layers appear as local-intensity minima and maxima, respectively. Bars, 10 μm.
Fig 5
Fig 5. Selective detection of S2 or S1+S3 layers.
(A) S2 detection and (B) S1+S3 detection in a latewood, (D) S2 detection and (E) S1+S3 detection in an earlywood. (C) and (F) are merged images of (A) and (B), and (D) and (E), respectively. Red and green dots correspond to the detected S2 (local-intensity minima) and S1+S3 (local-intensity maxima) layers’ contributions, respectively. Bars, 10 μm.
Fig 6
Fig 6. Normalized intra-annual transitional behaviors of a portion of the anatomical parameters.
(A) Cell wall occupancy, (B) lumen radial diameter, and (C) tangential wall thickness, respectively. (D–F) Percentage changes of each anatomical parameter (A–C) from preceding tracheids. Solid lines and the shaded area surrounding them in each figure indicate the mean intra-annual transitions and their standard deviations, respectively. Cell no. 1 corresponds to the tracheid positioned at the most earlywood. Cell number ranges from no. 1 to no. 27 in normalized radial files.
Fig 7
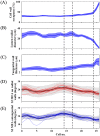
Fig 7. Comparison of normalized intra-annual transitional behaviors of anatomical parameters and S2 microfibril angle (MFA).
(A) Cell wall occupancy, (B) lumen radial diameter, (C) tangential wall thickness, (D) S2 MFA on radial walls, and (E) S2 MFA on tangential walls. In (A–C), blue solid lines and the shaded area surrounding them indicate the mean intra-annual transitions and their standard deviation, respectively. In (D) and (E), black solid lines, and gray and dark gray bands correspond to the mean intra-annual trends of S2 MFA, their standard deviations, and standard errors of the mean, respectively. Red and blue lines in (D) and (E) indicate normalized S2 MFA transitions of each radial file in the radial and tangential walls, respectively. Horizontal dotted lines indicate the positions of Cell no. 15, 18, and 25 from the left side, respectively. Cell no. 1 corresponds to the tracheid positioned at the most earlywood. Cell number ranges from no. 1 to no. 27 in normalized radial files.
Fig 8
Fig 8. Results of Steel-Dwass test applied to anatomical parameters and S2 microfibril angle (MFA).
(A) Cell wall occupancy, (B) lumen radial diameter, (C) tangential wall thickness, (D) S2 MFA on radial walls, and (E) S2 MFA on tangential walls. In these matrices, yellow color cells indicate the statistically significant pairs (P < 0.05). Observation cell number is 432.

References

    1. Côté WA. Cellular ultrastructure of woody plants. New York: Syracuse University Press; 1965.
    1. Donaldson L. Wood cell wall ultrastructure The key to understanding wood properties and behavior. IAWA J. 2019; 40: 645–672.
    1. Donaldson L, Xu P. Microfibril orientation across the secondary cell wall of Radiata pine tracheids. Trees 2004; 19-644-653.
    1. Donaldson L. Microfibril angle: measurement, variation and relationships—a review. IAWA J. 2008; 29: 345–386.
    1. Richter HG, Grosser D, Heinz I, Gasson PE. IAWA list of microscopic features for softwood identification. IAWA J. 2004; 25: 1–70.

Publication types