. 2022 Nov 4;378(6619):eabm8797.
doi: 10.1126/science.abm8797. Epub 2022 Nov 4.

Dual-polarity voltage imaging of the concurrent dynamics of multiple neuron types

Affiliations

Dual-polarity voltage imaging of the concurrent dynamics of multiple neuron types

Madhuvanthi Kannan et al. Science. .

Abstract

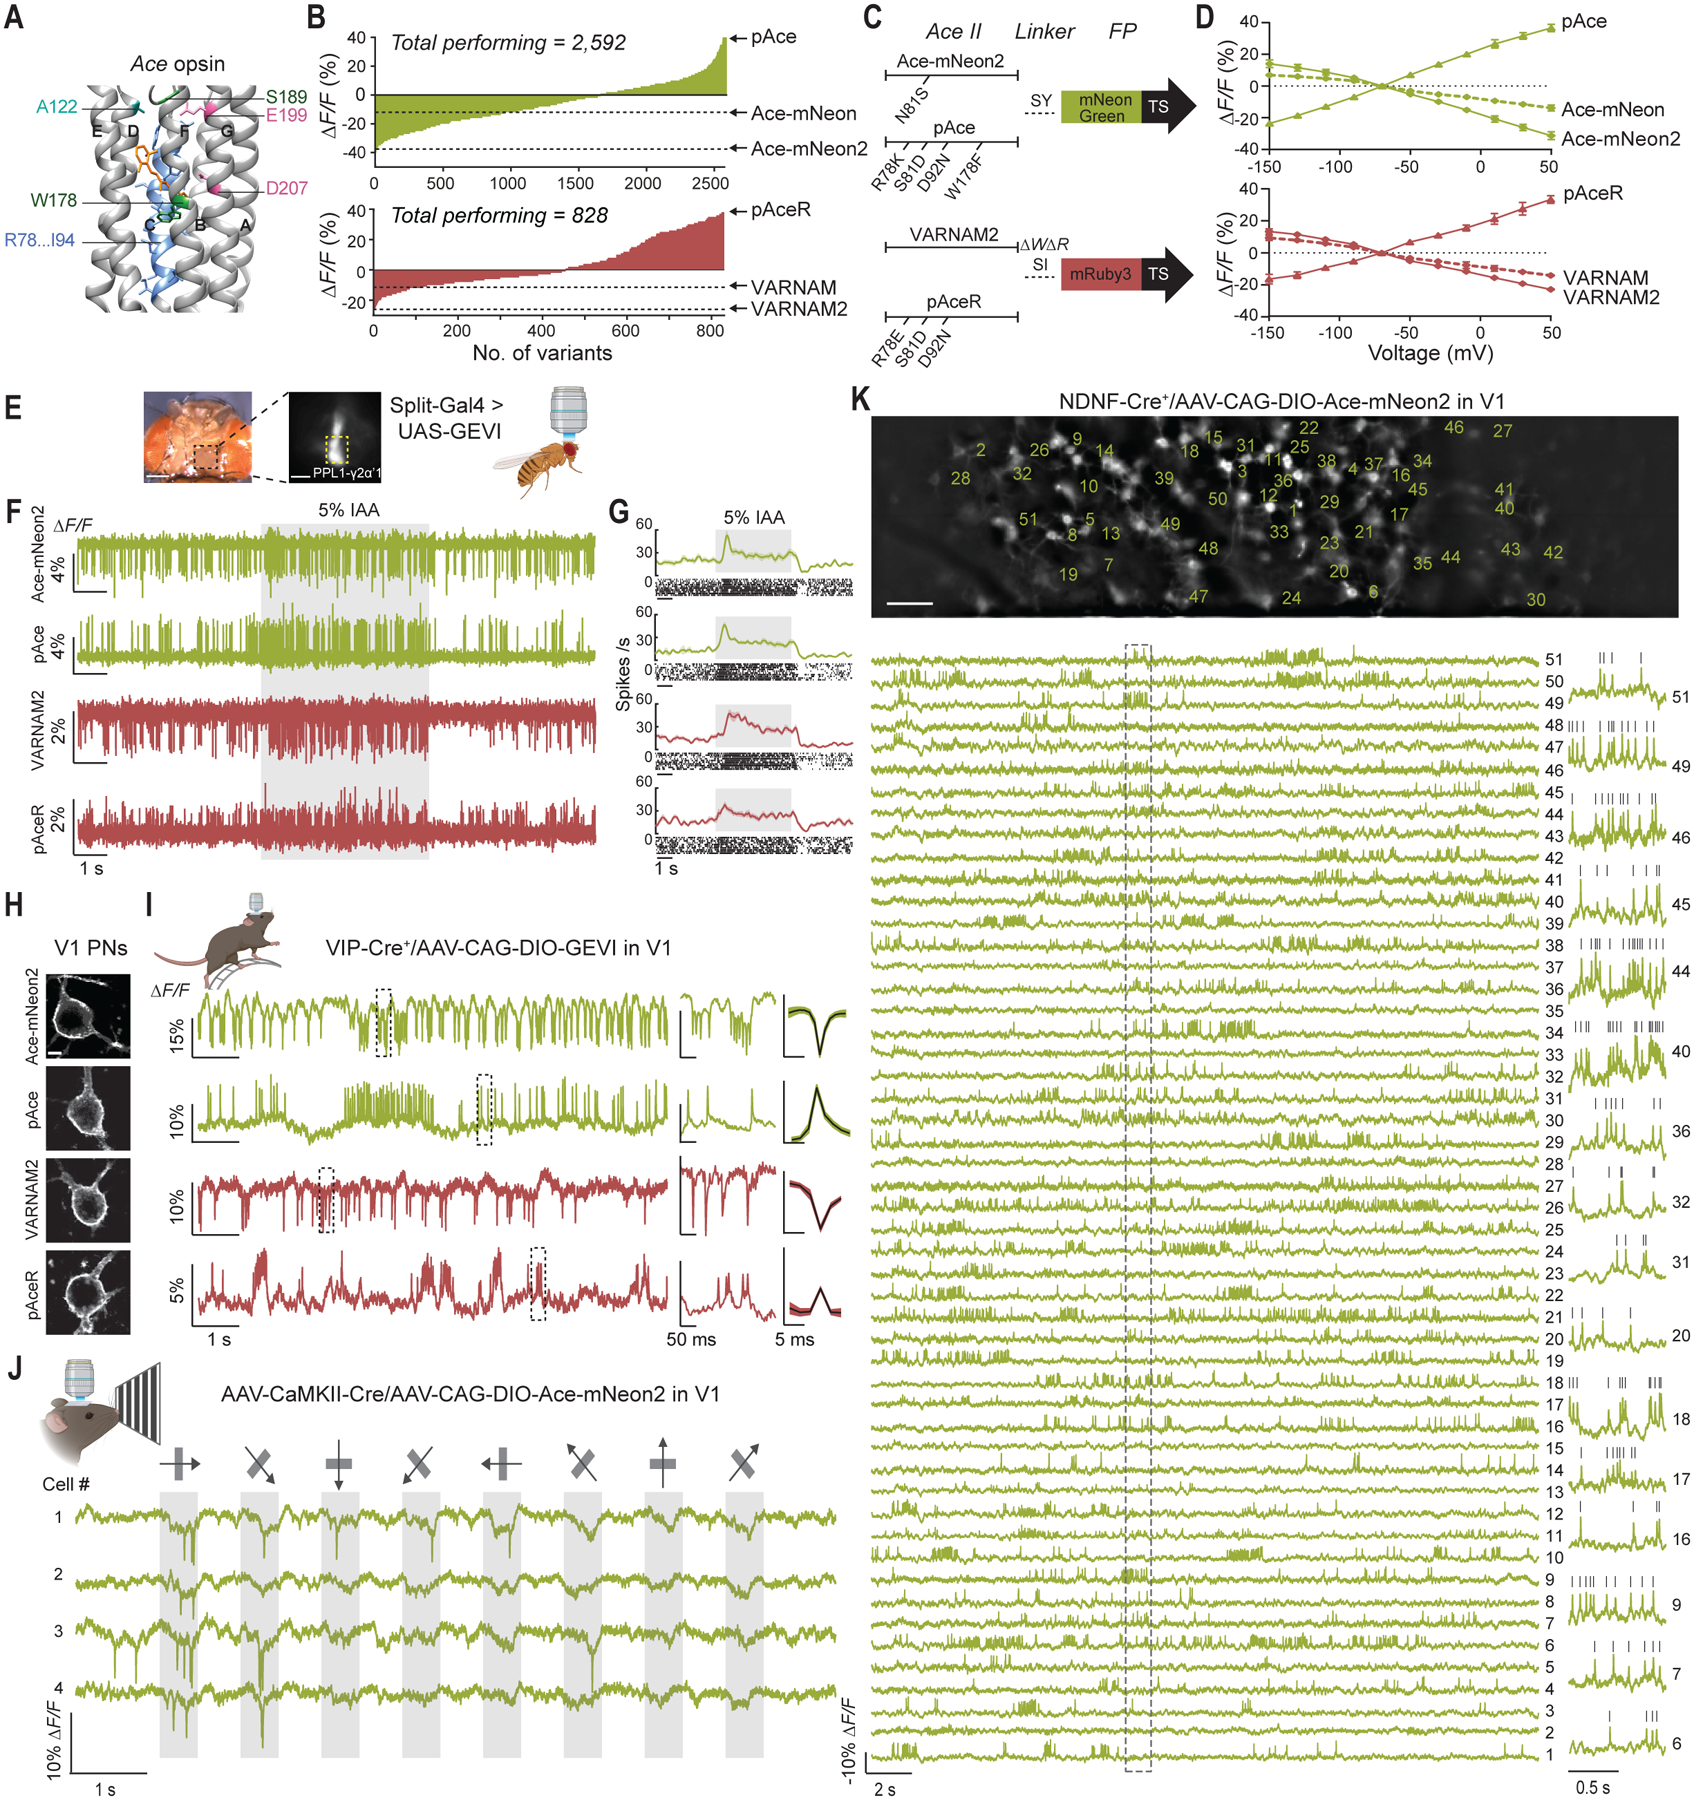
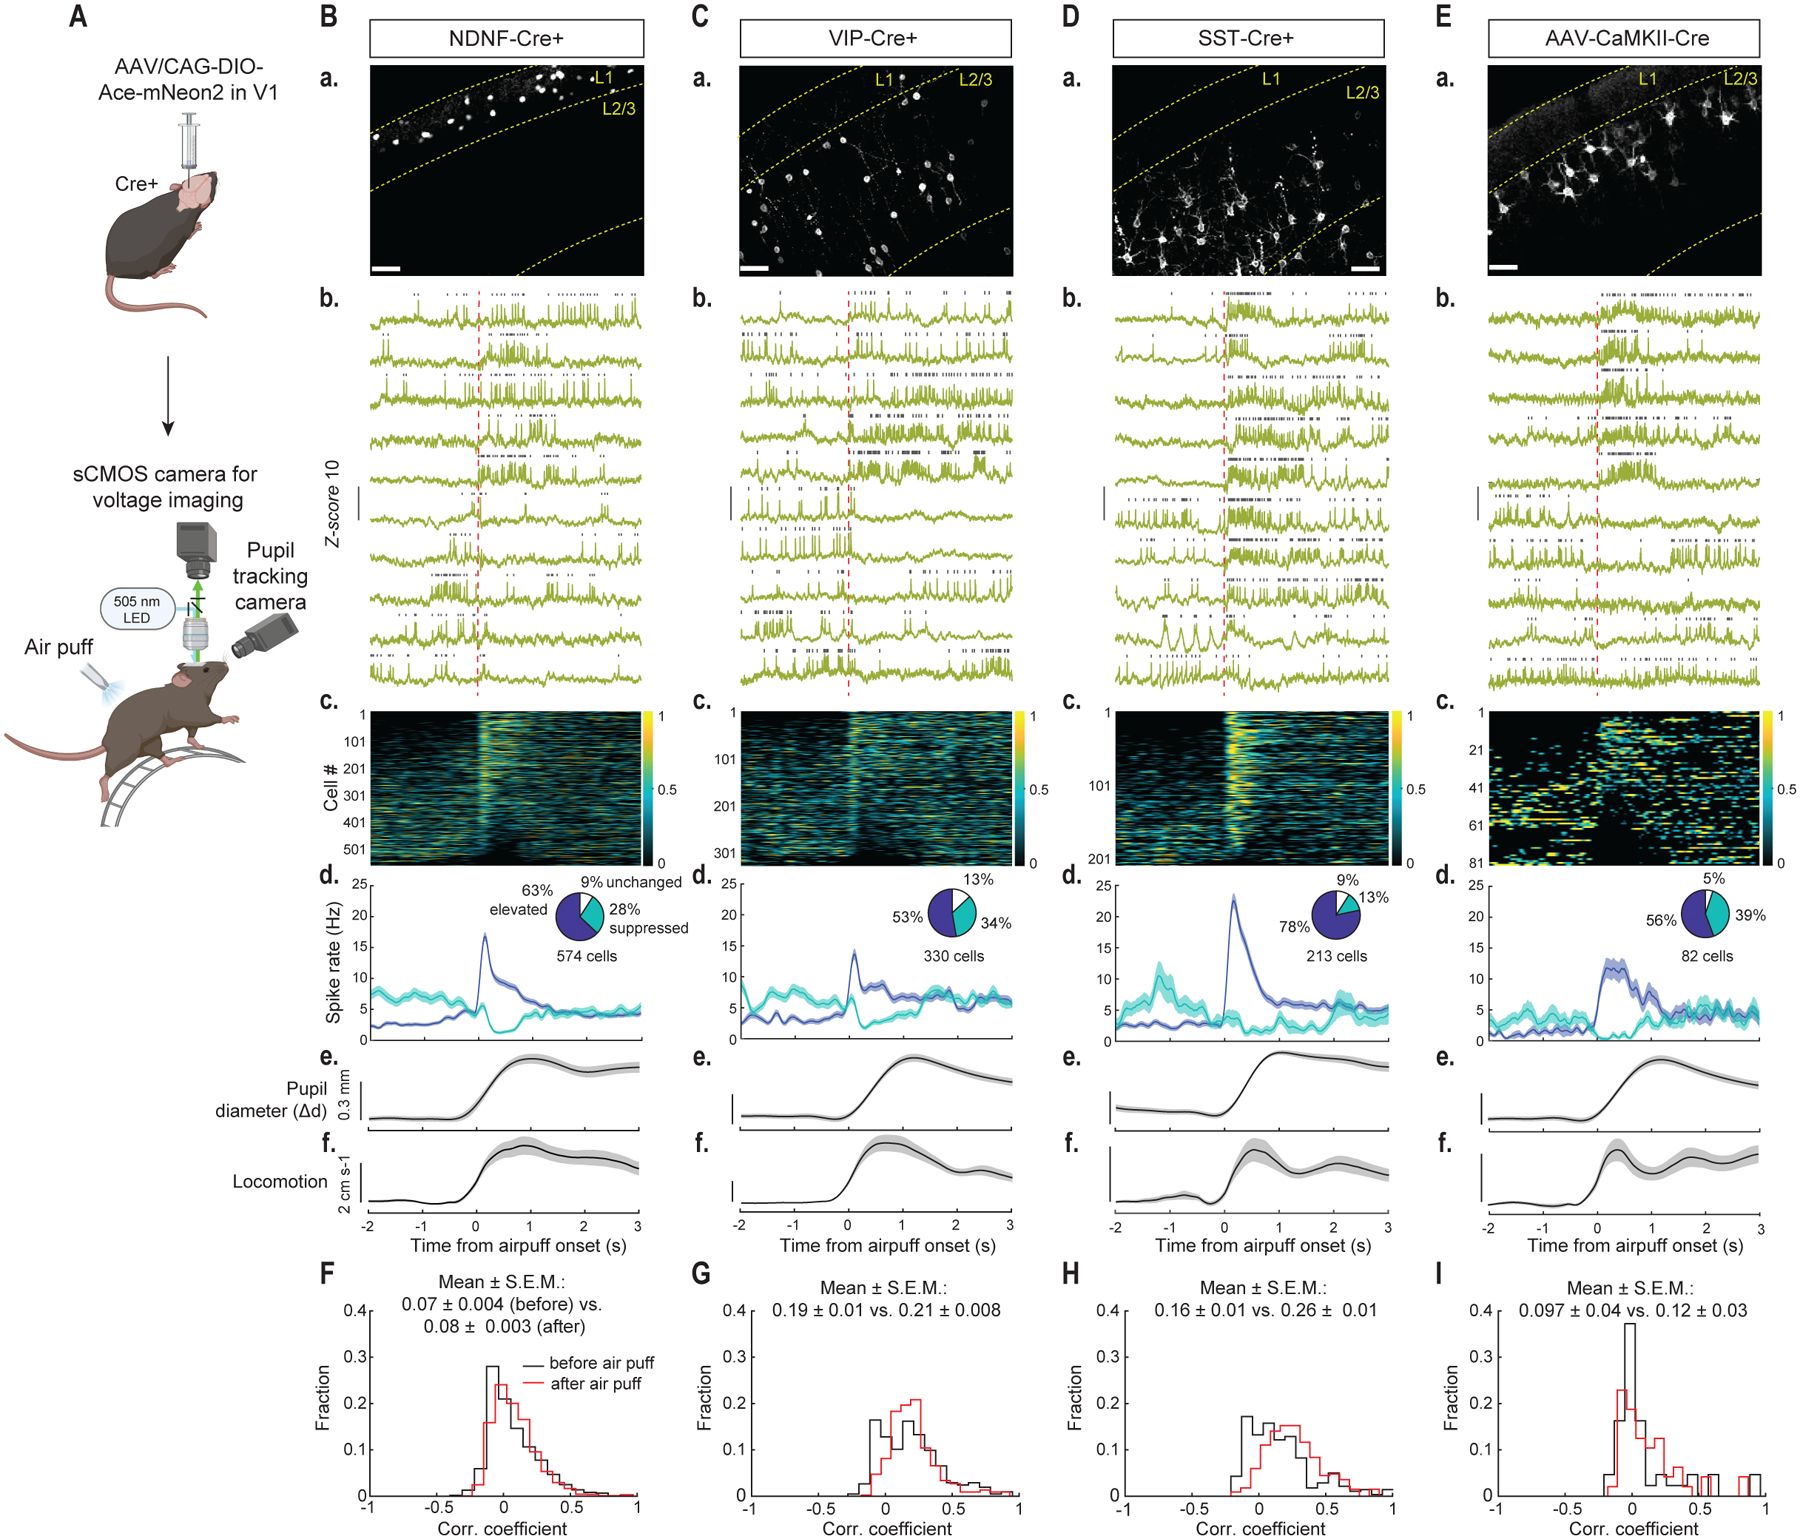
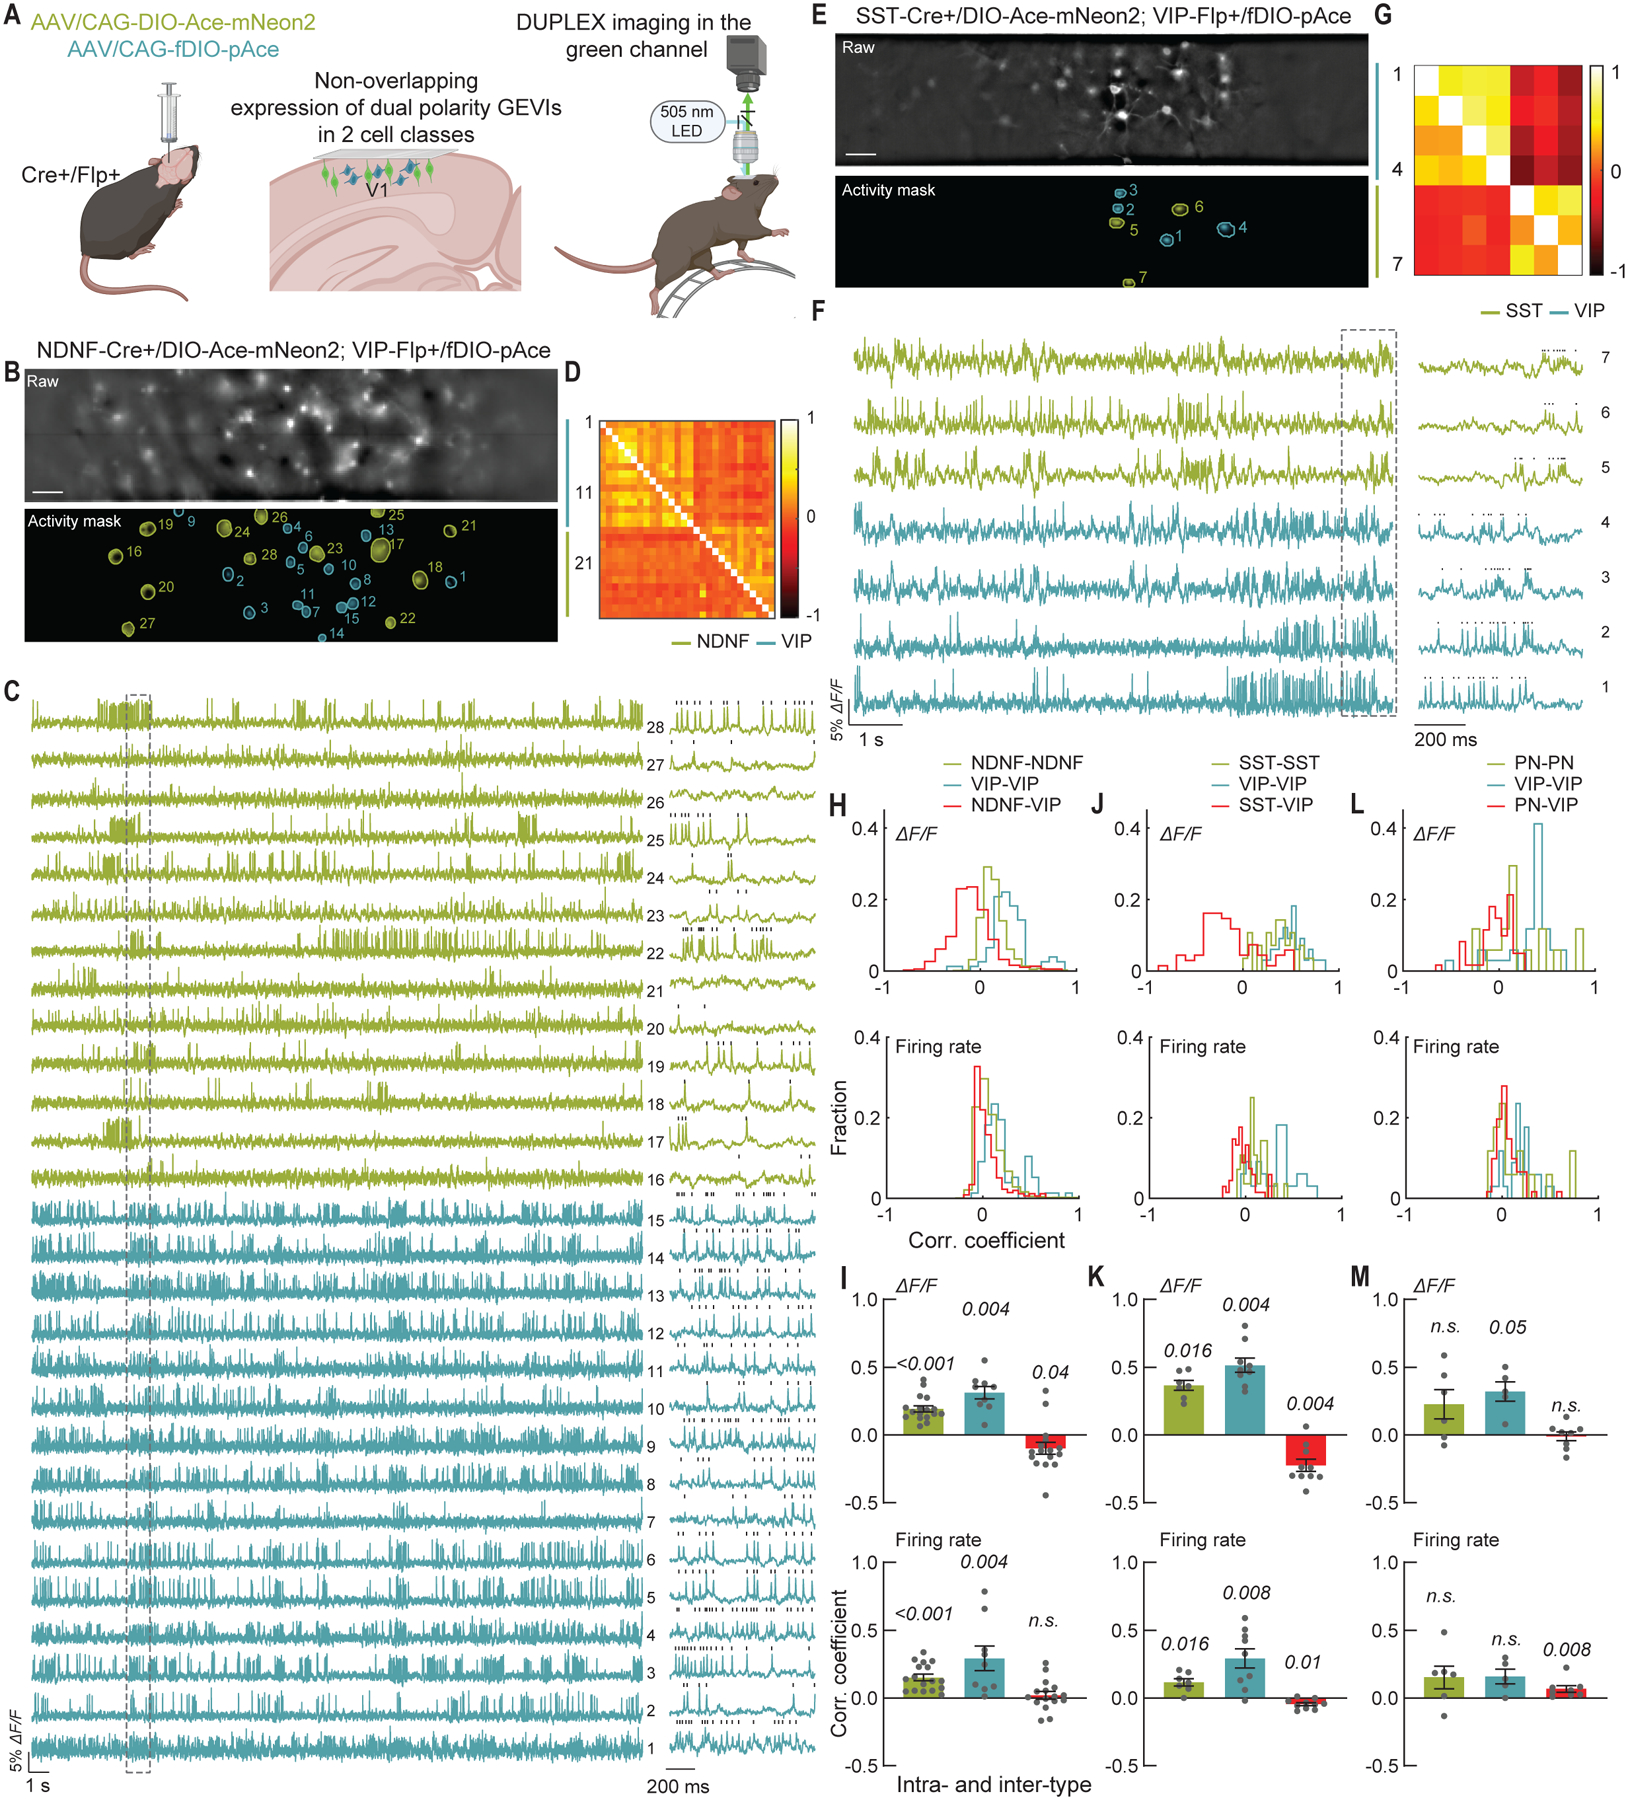
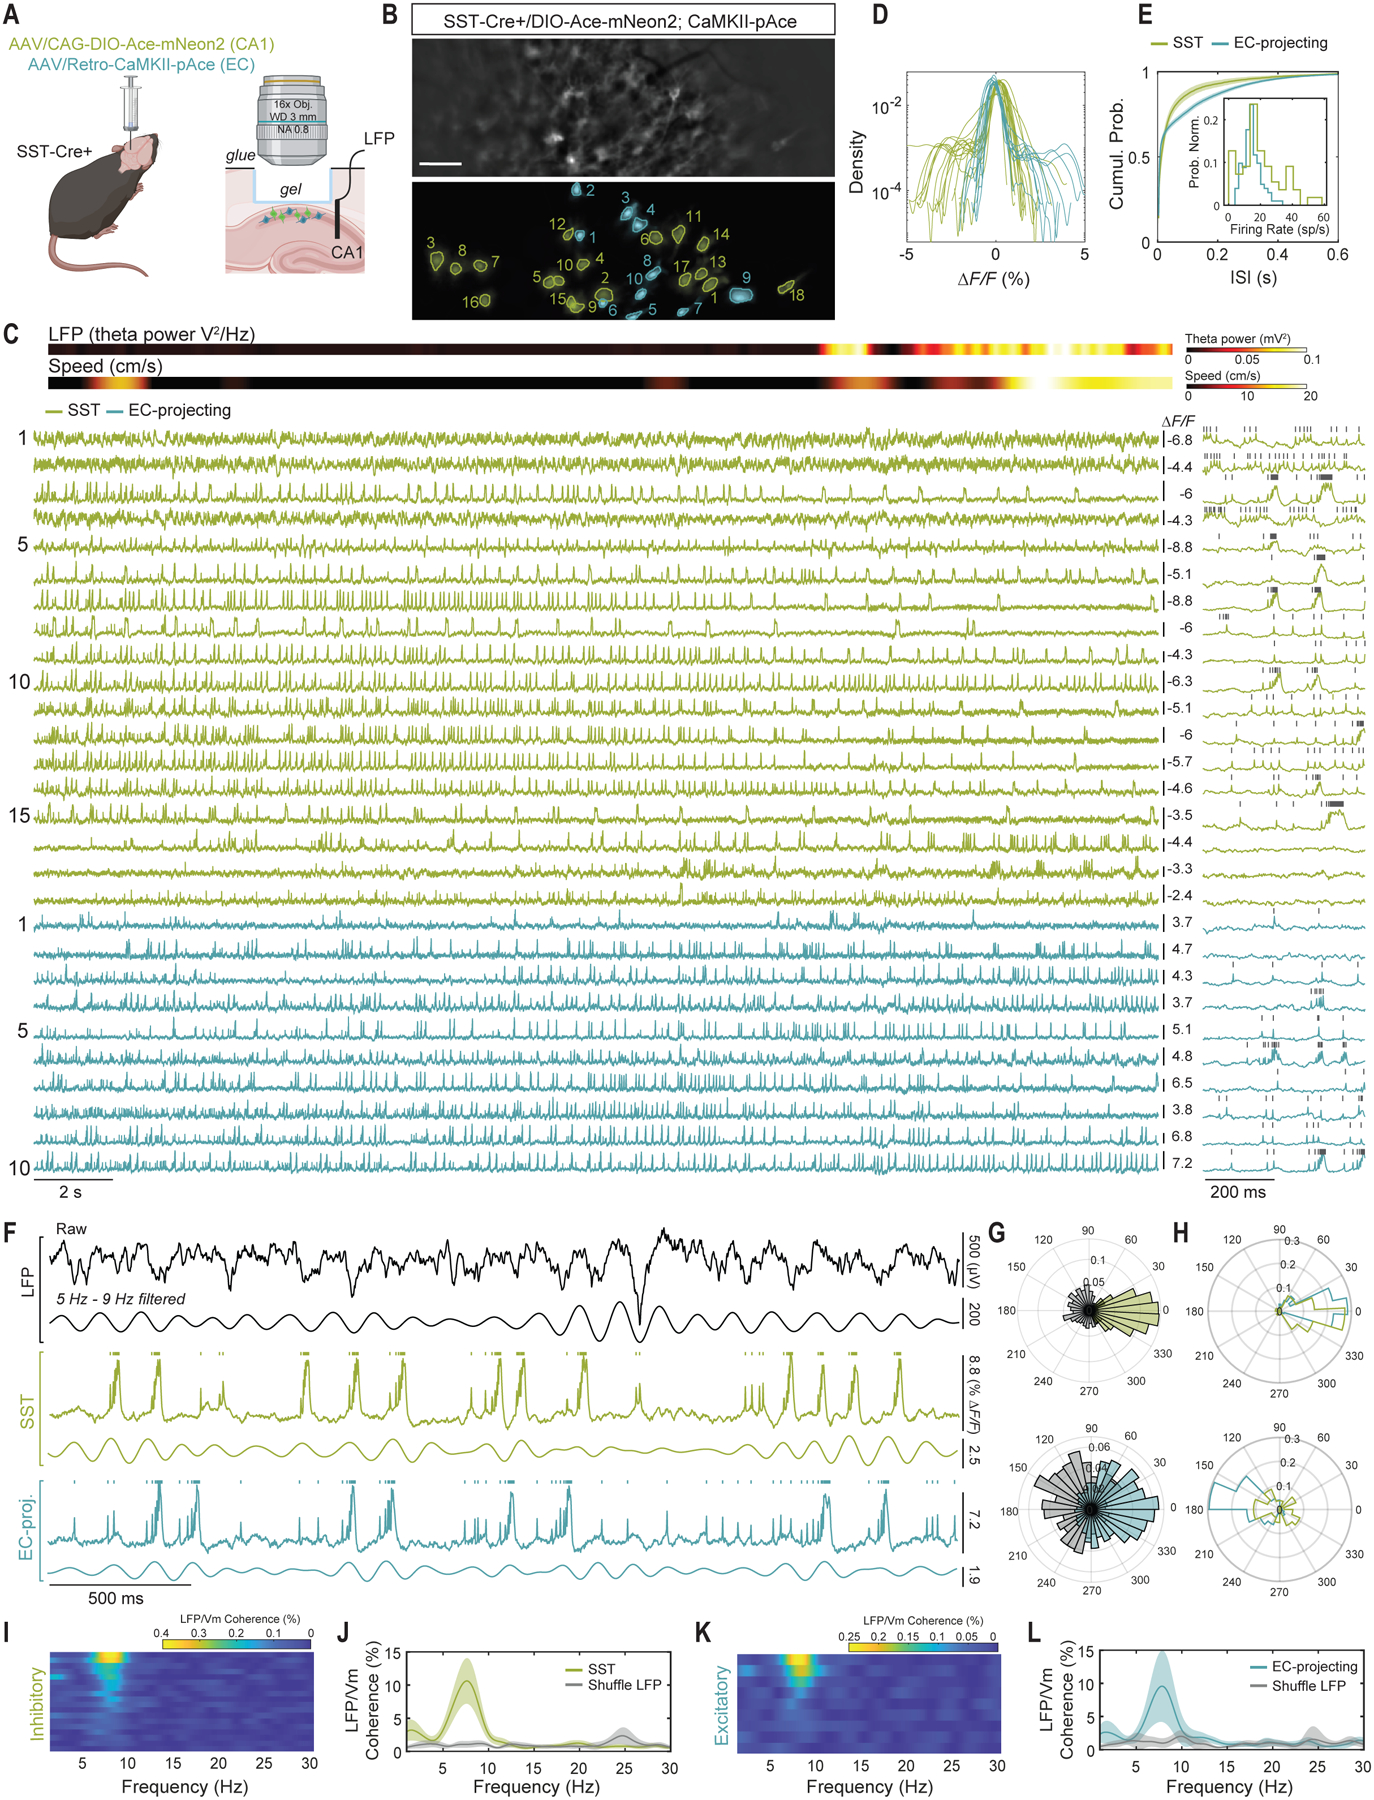
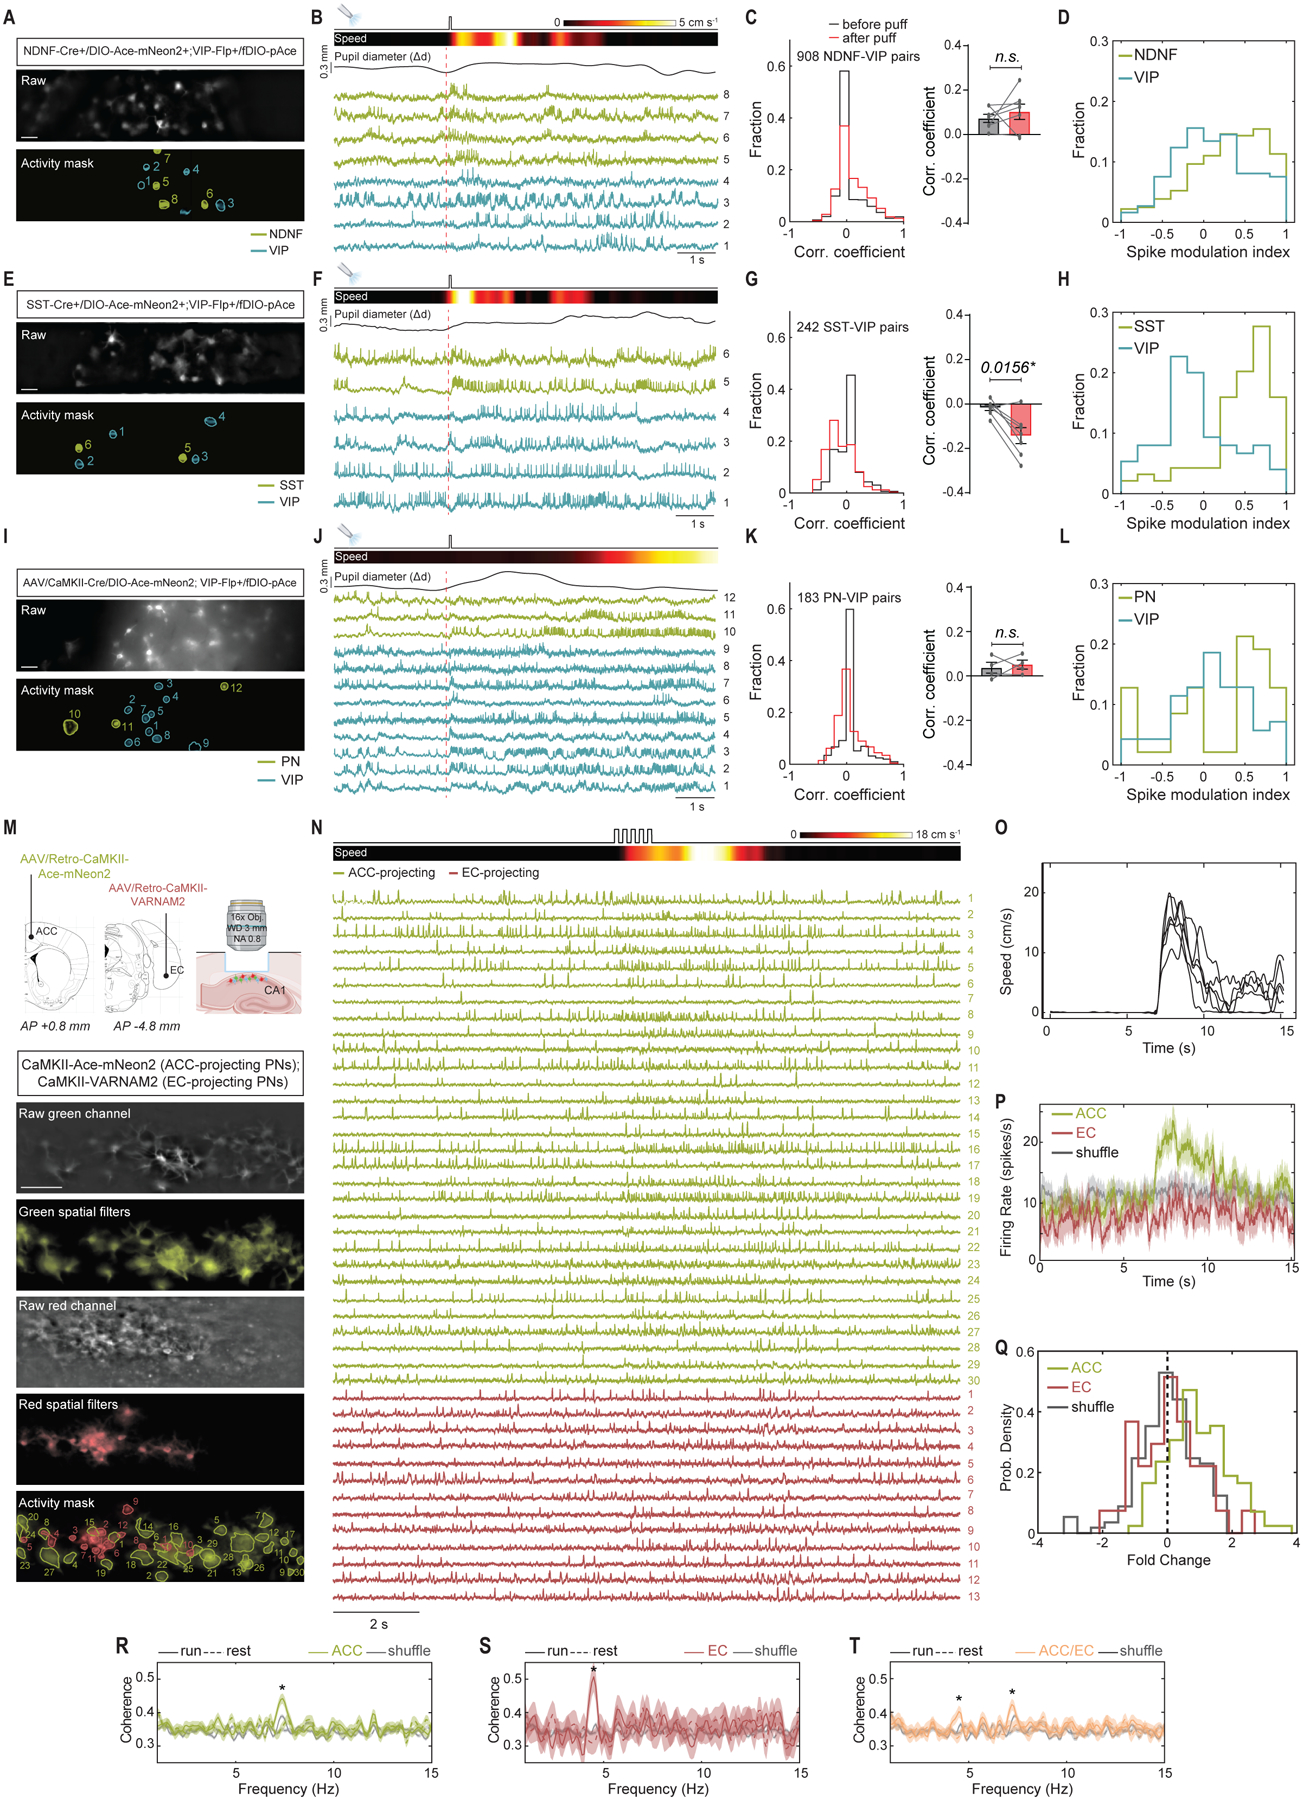
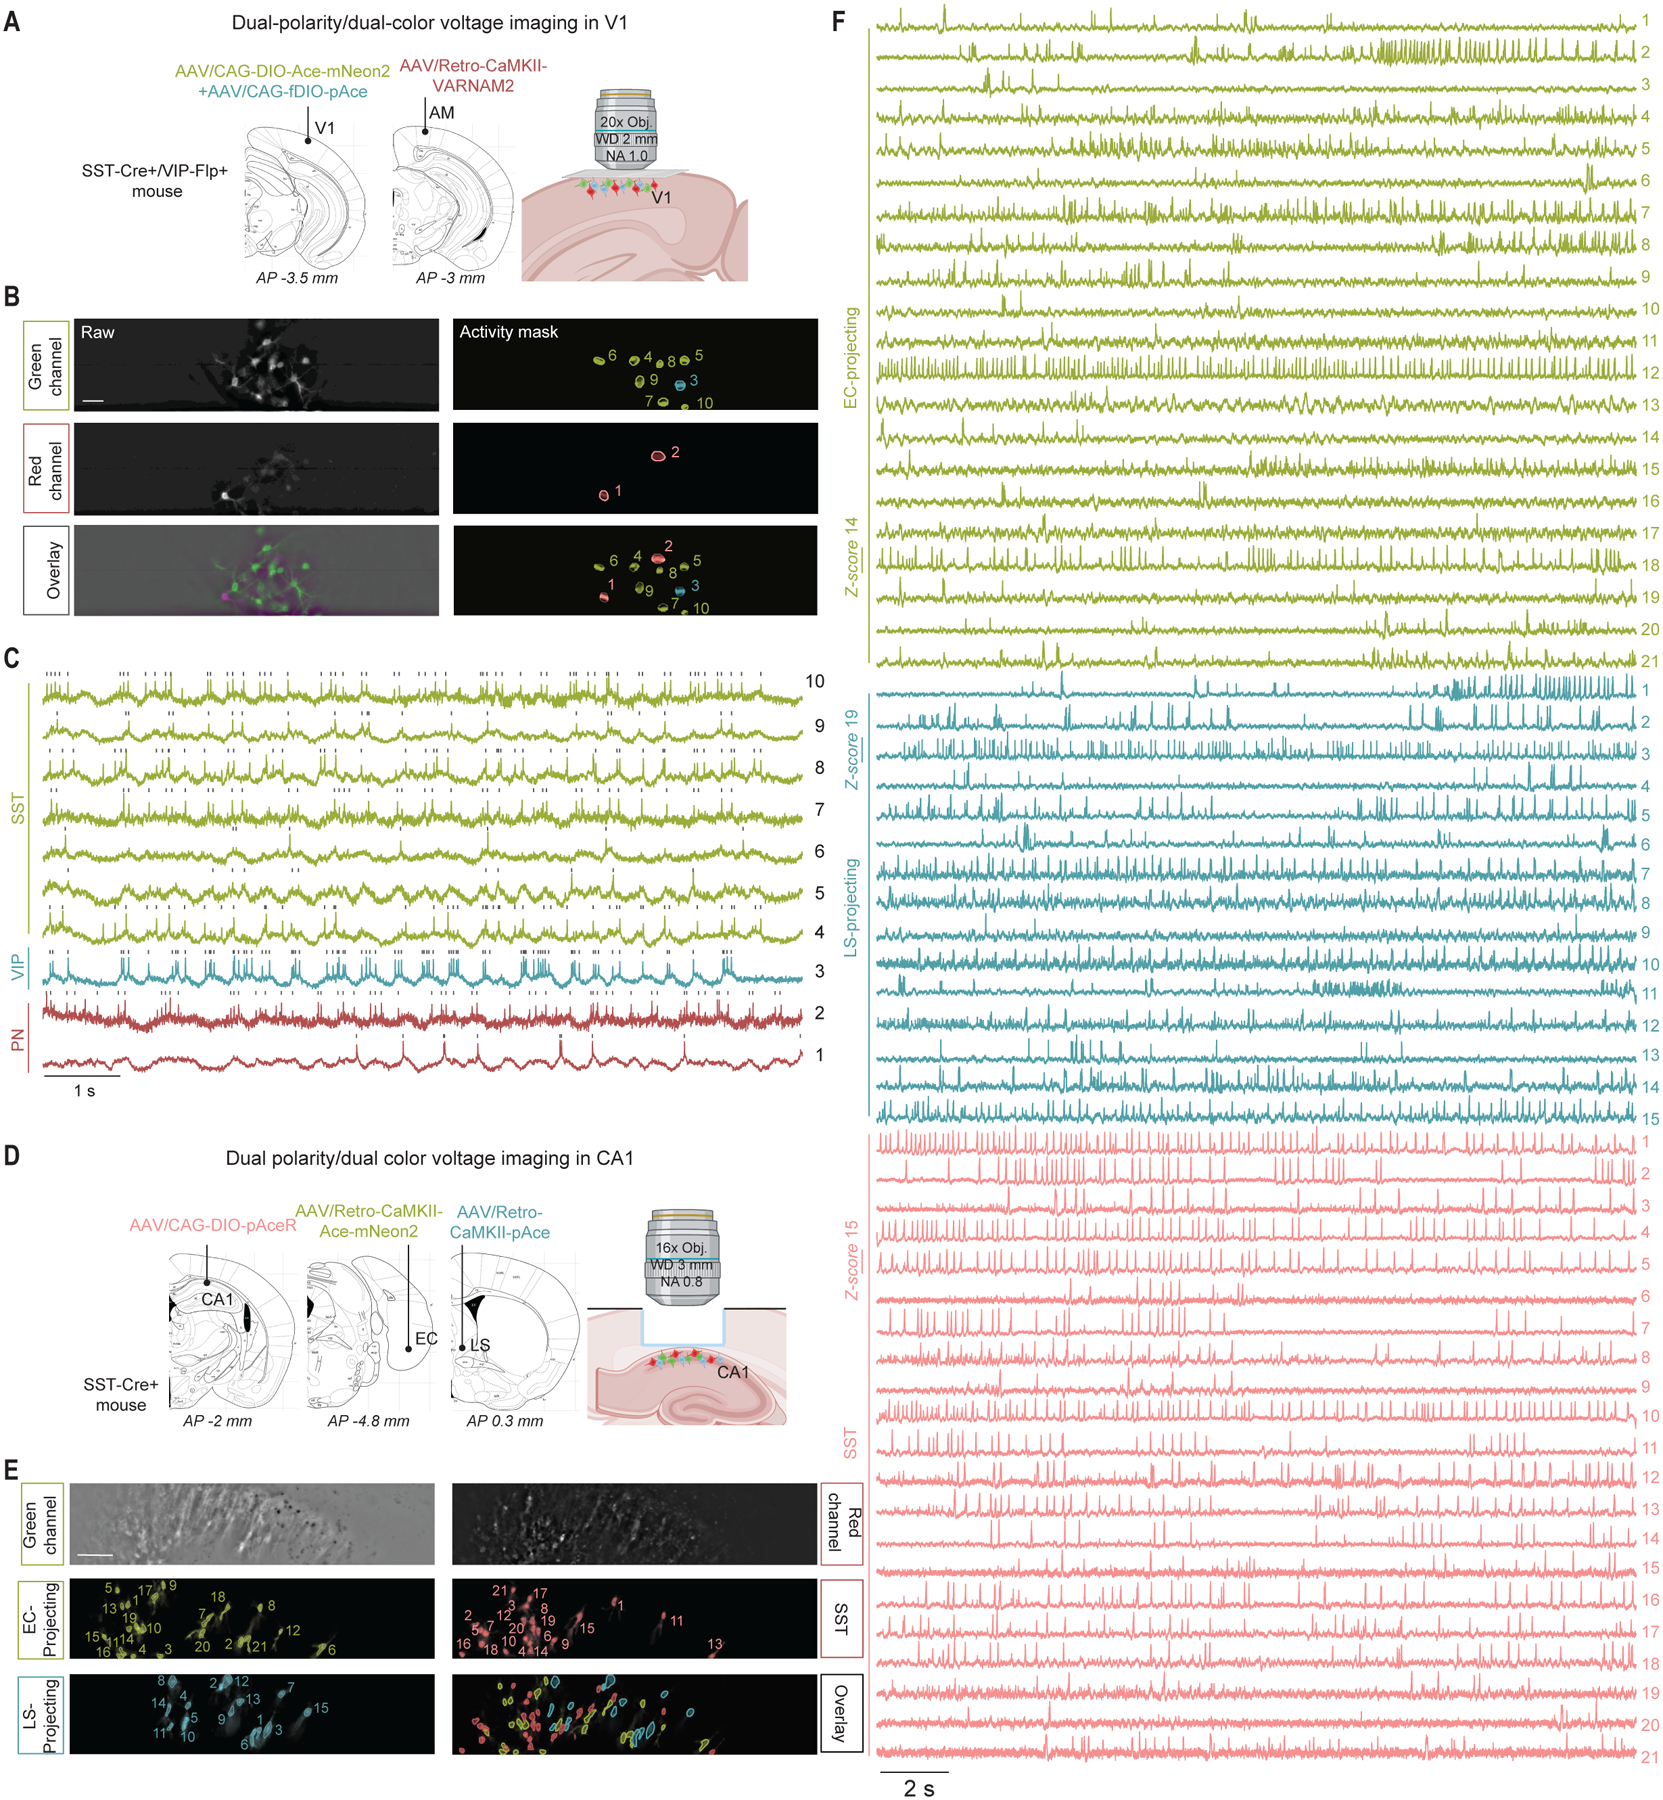
Genetically encoded fluorescent voltage indicators are ideally suited to reveal the millisecond-scale interactions among and between targeted cell populations. However, current indicators lack the requisite sensitivity for in vivo multipopulation imaging. We describe next-generation green and red voltage sensors, Ace-mNeon2 and VARNAM2, and their reverse response-polarity variants pAce and pAceR. Our indicators enable 0.4- to 1-kilohertz voltage recordings from >50 spiking neurons per field of view in awake mice and ~30-minute continuous imaging in flies. Using dual-polarity multiplexed imaging, we uncovered brain state-dependent antagonism between neocortical somatostatin-expressing (SST+) and vasoactive intestinal peptide-expressing (VIP+) interneurons and contributions to hippocampal field potentials from cell ensembles with distinct axonal projections. By combining three mutually compatible indicators, we performed simultaneous triple-population imaging. These approaches will empower investigations of the dynamic interplay between neuronal subclasses at single-spike resolution.


Conflict of interest statement

Competing interests: MK, GV, and VAP are co-inventors on a patent application describing dual-polarity multiplexing; the other authors declare no competing interests;

Figures

Fig. 1.
Fig. 1.. Design and characterization of Ace-mNeon2, VARNAM2 and reverse polarity variants pAce and pAceR.
(A) Crystal structure of Ace (PDB ID: 3AM6), showing residues targeted for site-directed saturation mutagenesis on Ace-mNeon and VARNAM. The 7 transmembrane helices are labeled A through G. AAs R78 through I94 on helix C and specified loci on other helices were targeted. (B) Distribution of fluorescence responses to field stimulation acquired from spiking HEK cells expressing Ace-mNeon (top) and VARNAM (bottom) variants obtained on the high-throughput platform. (C) Schematic representations of Ace-mNeon2, pAce, VARNAM2, and pAceR constructs, depicting the point mutations in Ace and the Ace-FP linker. (D) ΔF/ΔV curves obtained using whole-cell recordings and concurrent fluorescence imaging of HEK cells transfected with Ace-mNeon, Ace-mNeon2, and pAce (top), and VARNAM, VARNAM2, and pAceR (bottom). Values represent mean ± S.E.M. (E) In vivo voltage imaging through a transparent surgical window implanted on a fly head (left). Each of the indicators was selectively expressed in PPL1-γ2α’1 dopaminergic neuron using a split-GAL4 system (right). Yellow dashed box indicates the axonal region of PPL1-γ2α’1. (F) Representative recordings from PPL1-γ2α’1 using the four GEVIs, showing odor-evoked spiking elicited by 5 s delivery (gray shading) of 5% isoamyl acetate. (G) Top panels: Mean ± S.E.M. spiking rates during odor delivery and raster plots of individual trials (n = 10 trials, 2 trials/fly). (H) Confocal images from coronal cortical slices of V1 PNs expressing the indicated sensors. Scale bar: 5 μm. (I) Left, example fluorescence traces showing spontaneous spiking obtained from awake, head-restrained mice selectively expressing the indicators in V1 VIP+ interneurons; Center, the boxed areas on the traces are shown at an expanded timescale; Right, Mean ± S.E.M. optical spike waveform (n=5 neurons per condition ranked in order of decreasing signal-to-noise ratios, 3 mice each (Ace-mNeon2 and pAce) and 2 mice each (VARNAM2 and pAceR)). (J) Example visual responses from layer 2/3 PNs to drifting gratings presented at 8 different orientations, acquired using Ace-mNeon2 in an awake mouse. Arrows indicate stimulus orientation. Gray shading denotes stimulus periods. (K) Top, Representative epifluorescence image of a single field-of-view from a NDNF-Cre+ mouse expressing Cre-dependent soma-targeted Ace-mNeon2 in V1. Scale bar: 50 μm. Bottom, ΔF/F traces showing spontaneous activity from regions-of-interest (ROIs), numbered in the image above. Fluorescence traces are inverted for visualization. Boxed region is shown at an expanded timescale on the right for select cells. Grey ticks denote identified spikes.
Fig. 2.
Fig. 2.. Ace-mNeon2 voltage imaging unveils state-dependent modulation of spontaneous firing in excitatory and inhibitory cell classes in V1.
(A) Schematic of AAV injection and experimental setup. (B) (a) Confocal images of soma-targeted Ace-mNeon2 expression in NDNF+ interneurons. Scale bar: 50 μm. (b) Representative fluorescence-time traces from individual cells (inverted for visualization purposes). Vertical dashed line in red indicates air puff onset. Grey ticks denote identified spikes. (c) Z-scored firing rate for all NDNF+ interneurons (n=574 cells, 6 mice). Cells are arranged in order of decreasing spike modulation indices (Methods). (d) Mean ± S.E.M. firing rate aligned to air puff onset for activated (dark blue) and suppressed (cyan) fractions. Pie chart insets indicate % of cells with elevated (dark blue), suppressed (cyan) or unchanged (white) spike rates following air puff. (e) Mean ± S.E.M. pupil diameter and (f) locomotor speed. (C) Same as (B) for VIP+ interneurons (n=330 cells, 5 mice). (D) Same as (B) for SST+ interneurons (n=213 cells, 6 mice). (E) Same as (B) for PNs (n=82 cells, 4 mice). (F) Distribution of pairwise correlation coefficients of mean firing rates across a sliding 20-ms-window, as determined for 3-s-intervals, before (black) and after (red) air puff for NDNF+ interneurons (2300 cell pairs in the same fields-of-view, 6 mice; **P=0.0021; Wilcoxon matched-pairs signed rank test for before vs. after air puff). The mean ± S.E.M. correlation coefficient values are shown above the distribution plots. (G) Same as (F) for VIP+ interneurons (n=442 pairs, 5 mice; **P=0.0011). (H) Same as (F) for SST+ interneurons (n=334 pairs, 6 mice; ***P<0.0001). (I) Same as (F) for PNs (n=51 pairs, 4 mice; *P=0.03).
Fig. 3.
Fig. 3.. DUPLEX captures the concerted activation dynamics between cell class pairs in V1.
(A) Schematic of AAV injections and experimental setup. (B-F) Example DUPLEX recordings from two targeted cell classes. (B-E) Raw epifluorescence (top) and activity-mask (bottom) images of single fields-of-view from a (B) NDNF-Cre+/VIP-Flp+ mouse expressing Ace-mNeon2 in NDNF+ interneurons (green) and pAce in VIP+ cells (blue), and (E) SST-Cre+/VIP-Flp+ mouse expressing Ace-mNeon2 in SST+ interneurons (green) and pAce in VIP+ interneurons (blue). Active regions-of-interest (ROIs) are numbered. Scale bar: 50 μm. (C-F) ΔF/F traces from the ROIs numbered in (B) and (E), respectively. Ace-mNeon2 traces are inverted for visualization purposes. The boxed region in (B) is shown at an expanded timescale to the right. Grey ticks indicate identified spikes. (D-G) Intra- and inter-population correlation coefficient matrices of pairwise, zero time-lag correlation coefficients of the ΔF/F traces (upper triangle) and spiking rates (lower triangle), determined using a 20 ms sliding window for the cells in (C) and (F), respectively. (H) Distribution of pairwise correlation coefficients, for ΔF/F traces (top) and spiking rates (bottom), across all mice for NDNF/VIP recordings (n=1795 NDNF-NDNF pairs, 77 VIP-VIP pairs, and 373 NDNF-VIP pairs; 208 NDNF-neurons and 54 VIP-neurons, 5 mice). (I) Mean ± S.E.M. pairwise correlation coefficients, for ΔF/F traces (top) and spiking rates (bottom), for the NDNF/VIP dataset in (H) (n=17 fields-of-view). P values are italicized (One sample Wilcoxon test against zero). (J-K) Same as (H-J) for SST/VIP recordings (n=28 SST-SST pairs, 33 VIP-VIP pairs, and 67 SST-VIP pairs; 25 SST+ neurons and 29 VIP+ neurons, 10 fields-of-view, 3 mice). (L-M) Same as (H-J) for PN/VIP recordings (n=17 PN-PN pairs, 34 VIP-VIP pairs, and 61 PN-VIP pairs; 20 PNs and 22 VIP+ neurons, 8 fields-of-view, 3 mice).
Fig. 4.
Fig. 4.. DUPLEX uncovers cell class-specific contributions to LFP in hippocampal CA1.
(A) Schematic of AAV injections and experimental setup. (B) Representative raw epifluorescence image (top) and spatial footprint of negative- and positive-polarity signals (in green and blue, respectively) of 18 and 10 identified neurons. Scale bar: 50 μm. (C) ΔF/F traces for all the neurons in (B) along with wheel speed and LFP theta (top). Ace-mNeon2 traces are inverted for visualization purposes. The first 500 ms are shown at the expanded timescale to the right. Grey ticks denote identified spikes. (D) Time course distribution of all neurons across all fields-of-view. Note the opposite polarities within similar dynamic ranges for Ace-mNeon2 and pAce. (E) Cumulative distribution of inter-spike interval and firing rate (inset) for all recorded neurons (n=55 SST+ interneurons and 102 projection neurons, 6 fields-of-view, 1 mouse). Shaded area: 95% CI. (F) Phase relationships between spike and theta oscillations extracted from the LFP or cellular transmembrane voltage oscillations, for projection neurons and SST+ cells recorded simultaneously. Shown here, raw LFP trace (top), theta-filtered (5 Hz-10 Hz) (center) and unfiltered excitatory and inhibitory traces (bottom). (G) Spike-theta phase relationship for the two neurons in (F). Color and gray represent theta Vm and theta LFP, respectively. Note that both neurons are phase-locked to their own Vm and to the LFP but with approximately opposite phases. (H) Polar histogram of the probability density of the average spike-theta phase relationship for all 157 neurons, computed against their respective theta Vm (top) or theta LFP (bottom). For each neuron, average spike timing relative to theta cycle was computed using the circular mean. (I-L) LFP-subthreshold coherence of all neurons in (C), showing that a fraction of (I-J) SST+ interneurons and (K-L) EC-projecting excitatory neurons are phase-locked to theta LFP. (I and K) Raster plots sorted in decreasing order of theta-band coherence strength. (J and L) LFP coherence averaged across all neurons in (I and K). Shaded area: 95% CI.
Fig. 5.
Fig. 5.. Dual population recordings in V1 and CA1 during state transitions.
(A-L) DUPLEX recordings in V1. (A) Representative raw epifluorescence (top) and activity-mask (bottom) images of a single field-of-view from a NDNF-Cre+/VIP-Flp+ mouse expressing Ace-mNeon2 in NDNF+ interneurons (green) and pAce in VIP-cells (blue). Scale bar: 50 μm. (B) ΔF/F traces from the ROIs numbered in (A) aligned to air puff onset (vertical dashed line). Ace-mNeon2 traces are inverted for visualization purposes. Also shown (top), air puff onset, locomotion speed, and pupil diameter. (C) Left, Distribution of pairwise inter-class correlation coefficients of spike rates determined using a 20 ms sliding window, for a 3 s-interval before (black) or after (red) air puff (n=908 NDNF-VIP pairs from 393 NDNF+ and 188 VIP+ cells, 7 mice). Right, Mean ± S.E.M. correlation coefficients by mouse (n=7 mice, n.s.=not significant, One-tailed Wilcoxon matched-pairs signed rank test). (D) Distribution of spike modulation indices for all NDNF+ and VIP+ neurons in (C). (E-G) Same as (A-C) for DUPLEX recordings in SST-Cre+/VIP-Flp+ mice (n=242 SST-VIP pairs from 103 SST+ and 79 VIP+ cells, 6 mice, *P<0.05, One-tailed Wilcoxon matched-pairs signed rank test). (H) Same as (D) for all SST+ and VIP+ neurons. (I-K) Same as (A-C) for DUPLEX recordings in AAV-CaMKII-Cre/VIP-Flp+ mice (n=183 PN-VIP pairs from 75 PNs and 67 VIP+ cells, 4 mice, n.s.=not significant, One-tailed Wilcoxon matched-pairs signed-rank test). (D) Same as (D) for all PNs and VIP+ neurons. (M-T) Dual-color voltage recordings from hippocampal projection neurons. (M) Top, Schematic of the experimental approach. Bottom, Representative field-of-view of the red and green channels in grayscale, their respective overlay of spatial filters estimated by EXTRACT for each spiking neuron in each spectral channel, and the overlay of the spatial filter contours for all 30 and 13 identified, projection specific neurons, respectively. Scale bar: 50 μm. (N) ΔF/F traces for all neurons in (M), aligned to the rest-run transition. Also shown (top), the onset of 5 consecutive air puffs and wheel speed. (O) Average mouse speed for 5 trials (black). Individual trials are shown in grey. (P) Average firing rate (250 ms window) for each projection-specific class. Shuffle is computed by random circular permutations of each neuron’s spike train. Shaded area: 95% CI. (Q) Fold-change in cells’ spiking rates, computed across 2 s-intervals before and after air puff. Shuffle is computed using a random circular permutation of each neuron’s spike train. (R-T) Average pairwise coherence of the subthreshold dynamics of neurons belonging to the ACC-projecting subclass (R; n=101 neurons); the EC-projecting subclass (S; n=34 neurons); and across the two subclasses (T; n=135 neurons, 5 fields-of-view, 1 mouse). *P value<0.0001 (rank-sum test computed during epochs of running, against levels estimated from neurons belonging to different fields-of-view). Shaded areas represent 95% CI.
Fig. 6.
Fig. 6.. Simultaneous dual-polarity and dual-color imaging capture the voltage dynamics of three distinct cell classes in awake mice.
(A) Schematic of AAV injections for three cell class V1 imaging. (B) Raw epifluorescence (left) and activity-mask (right) images of a single field-of-view in the green and red channels, and overlay. Scale bar: 50 μm. (C) ΔF/F traces from the ROIs numbered in the mask overlay image in (B) and representing SST+ interneurons, VIP+ interneurons, and PNs, expressing Ace-mNeon2 (green), pAce (blue), and VARNAM2 (dark red), respectively. Ace-mNeon2 and VARNAM2 traces are inverted for visualization purposes. (D) Schematic of AAV injections for three cell class voltage imaging in CA1. (E) Representative field-of-view of the red and green channels with the respective spatial footprint of the identified neurons belonging to each of the three cell classes. Scale bar: 50 μm. (F) ΔF/F traces for all neurons in (E), representing EC-projecting and LS-projecting excitatory neurons, and SST+ interneurons expressing Ace-mNeon2 (green), pAce (blue), and pAceR (pale red), respectively. Ace-mNeon2 traces are inverted for visualization purposes.

References

    1. Ferguson KA, Cardin JA, Mechanisms underlying gain modulation in the cortex. Nature Reviews Neuroscience 21, 80–92 (2020). - PMC - PubMed
    1. Fu Y et al. , A cortical circuit for gain control by behavioral state. Cell 156, 1139–1152 (2014). - PMC - PubMed
    1. Lee CCY, Kheradpezhouh E, Diamond ME, Arabzadeh E, State-Dependent Changes in Perception and Coding in the Mouse Somatosensory Cortex. Cell Reports 32, 108197 (2020). - PubMed
    1. Polack P-O, Friedman J, Golshani P, Cellular mechanisms of brain state–dependent gain modulation in visual cortex. Nature Neuroscience 16, 1331–1339 (2013). - PMC - PubMed
    1. Schiemann J et al. , Cellular Mechanisms Underlying Behavioral State-Dependent Bidirectional Modulation of Motor Cortex Output. Cell Reports 11, 1319–1330 (2015). - PMC - PubMed

Publication types