. 2022 Nov 4;378(6619):523-532.
doi: 10.1126/science.abq6656. Epub 2022 Nov 3.

On-demand cell-autonomous gene therapy for brain circuit disorders

Affiliations

On-demand cell-autonomous gene therapy for brain circuit disorders

Yichen Qiu et al. Science. .

Abstract

Several neurodevelopmental and neuropsychiatric disorders are characterized by intermittent episodes of pathological activity. Although genetic therapies offer the ability to modulate neuronal excitability, a limiting factor is that they do not discriminate between neurons involved in circuit pathologies and "healthy" surrounding or intermingled neurons. We describe a gene therapy strategy that down-regulates the excitability of overactive neurons in closed loop, which we tested in models of epilepsy. We used an immediate early gene promoter to drive the expression of Kv1.1 potassium channels specifically in hyperactive neurons, and only for as long as they exhibit abnormal activity. Neuronal excitability was reduced by seizure-related activity, leading to a persistent antiepileptic effect without interfering with normal behaviors. Activity-dependent gene therapy is a promising on-demand cell-autonomous treatment for brain circuit disorders.


Conflict of interest statement

Competing interests: G.L., D.M.K., S.S., Y.Q., and M.C.W. are listed as inventors on patent WO2021191474A1. G.L., D.M.K., S.S., and M.C.W. have equity in a company that aims to bring epilepsy gene therapy to the clinic.

Figures

Fig. 1
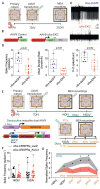
Fig. 1. Activity-dependent gene therapy paradigm.
(A) Cartoon illustrating the activity-dependent strategy. (B) Schematic seq uence of activity-dependent promoter and transgene expression. The star indicates the beginning of the pathological event. (C) Timeline of MEA recordings from primary cultures. (D) Network mean firing rate after disinhibition with PTX application [*P < 0.05; one-way analysis of variance (ANOVA) followed by Bonferroni multiple-comparison test versus 0 hours]. (E) dsGFP expression in primary neurons transduced with cfos-dsGFP 0, 6, 24, and 48 hours after addition of PTX. Scale bars, 100 μm. (F) dsGFP-positive neurons expressed as a percentage of all 4’,6-diamidino-2-phenylindole (DAPI)−positive neurons at different time points after PTX application (**P < 0.01; ***P < 0.001; one-way ANOVA followed by Bonferroni multiple-comparison test versus 0 hours).
Fig. 2
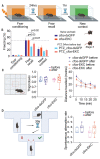
Fig. 2. Activity-dependent gene therapy decreases epileptiform activity in vitro.
(A) Timeline of MEA recordings in primary cultures. DIV, days in vitro. (B) Primary cultures were transduced with either cfos-dsGFP as control or cfos-EKC. (C) MEA traces. (D) Effect of cfos-EKC compared with cfos-dsGFP on spike frequency, mean bursting rate, and average number or spikes per burst. Student’s t test corrected for multiple comparisons, a = 0.02. (E) Timeline of MEA recordings in primary cultures transduced with dual AAVs controlled by doxycycline: one expressing an inducible dCAS9 fused to a transcriptional activator, and the other carrying an sgRNA targeting either the Kcna1 promoter or a LacZ sequence. (F) Spike frequency before PTX addition was similar between neurons transduced with cfos-CRISPRa_LacZ and cfos-CRISPRa_Kcna1. (G) Spike frequency over time normalized to network activity recorded at 14 days in vitro (*P < 0.05; two-way ANOVA followed by Bonferroni multiple-comparison test; interaction time × sgRNA, P = 0.006). (F) and (G) use the same color scheme.
Fig. 3
Fig. 3. Activity-dependent gene therapy is effective in decreasing excitatory neuronal excitability and in protecting against sequential chemoconvulsant challenges.
(A) Illustrative timeframe for electro physiology and immunofluorescence analysis. (B) Evoked trains of action potentials recorded in neurons transduced with either cfos-dsGFP or cfos-EKC. (C) Neuronal excitability parameters of neurons expressing either cfos-dsGFP or cfos-EKC after a single generalized seizure. (Left) Number of action potentials evoked by increasing current steps. (Middle) Maximum number of evoked action potential. (Right) Current and voltage thresholds. Input/output, two-way ANOVA; other graphs, Student’s t test corrected for multiple comparisons, α = 0.02. (D) Immunofluorescence images and analysis of the percentage of inhibitory neurons positive or negative for dsGFP, of excitatory neurons positive or negative for dsGFP, and of dsGFP positive neurons identified as excitatory or inhibitory (n = 3 animals) (***P < 0.001 two-way ANOVA followed by Bonferroni multiple-comparison test). Scale bar, 100 μm. (E) Illustrative timeline for repeated PTZ injections. OFF, basal cfos-driven transgene expression; ON, seizure-induced cfos-driven expression. (F) Raw Racine scale data in animals transduced with either cfos-dsGFP or cfos-KCNA1 and then injected with PTZ at three time points (0 hours, 24 hours, and 2 weeks). (G) Averaged Racine scores of data shown in (F). Racine score of >4 was considered as a generalized seizure. Two-way ANOVA followed by Bonferroni multiple comparison test. (H) Percentage of mice experiencing generalized seizures from (F) (χ2 test).
Fig. 4
Fig. 4. Activity-dependent gene therapy does not affect normal behavior.
(A) Schematic of the CFC test. (B) Percentage of freezing time for naïve or PTZ-treated mice injected with either cfos-dsGFP (n = 7 and 8, respectively) or cfos-EKC (n = 7 and 9, respectively) during fear conditioning, fear recall, and in a new context. Two-way ANOVA followed by Bonferroni multiple-comparison test. (C) Open field test. Shown is thigmotaxis (fraction of time spent in the periphery) and distance traveled before and after either cfos-dsGFP or cfos-EKC injection in both hippocampi. (D) Spontaneous T-maze alternation test. Shown are the spontaneous alternation rates before and after either cfos-dsGFP or cfos-EKC injection.
Fig. 5
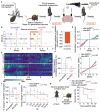
Fig. 5. Activity-depieindent gene therapy decreases spontaneous generalized seizures and interictal spikes and protects against a subsequent chemoconvulsant challenge.
(A) Schematic of the preclinical trial. (B) Seizures (vertical bars) over time for each mouse. Gray boxes indicate the viral injection, either with cfos-dsGFP or cfos-EKC, followed by a 2-week period to allow viral expression. (C) Percentage change in spontaneous generalized seizures after cfos-EKC treatment compared with baseline, normalized to the same percentage of change in cfos-dsGFP treated mice. One Sample t test versus 0 hours. (D) Weighted cumulative plot normalized by the total seizure count before treatment. Two-way ANOVA. (E) (Left) Number of spikes per hour plotted against time. Red dotted lines indicate the viral injection, with either cfos-dsGFP or cfos-KCNA1. Spike rates were normalized to the maximum for each animal (yellow, maximum; blue, minimum spike rate). (Middle) Spike frequency normalized to baseline (before viral injection) (Student’s t test). (Right) Weighted cumulative plot normalized by the total interictal spike count before viral treatment (two-way ANOVA). (F) Percentage change in coastline normalized to baseline (before viral injection). Student’s t test. (G) Percentage power change versus baseline in different frequency bands (two-way ANOVA). (H) Chronic epileptic animals or naïve animals (injected with cfos-dsGFP) received an intraperitoneal PTZ injection at the end of the study. Kaplan-Meier plot showing survival rate. Log-rank (Mantel-Cox) test.
Fig. 6
Fig. 6. Activity-dependent gene therapy decreases epileptiform activity in hCAs.
(A) Schematic representation for the generation of human fore brain assembloids after fusion of hCSs and hSSs. (B) Inhibitory neurons migrate from hSS to hCS, recapitulating human cortical development. Scale bar, 100 μm. (C and D) Trains of evoked action potentials and spontaneous inhibitory postsynaptic events recorded in excitatory neurons in cortical assembloids at the latest stage of differentiation (d240). (E) Cortical assembloids were maintained either in control medium or in a medium with 4AP and PTX. (F) Local field potential showing an increase in activity after addition of 4AP and PTX (orange triangle). (G) Immunofluorescence images of c-Fos obtained 4 hours after control medium (left) or medium supplemented with 4AP and PTX (right). Scale bar, 100 μm. (H) Cortical assembloids were transduced with cfos-dsGFP and then, 12 days later, moved to either control medium or medium supplemented with 4AP and PTX. (I to K) After 4 hours, cortical assembloids were fixed and stained for dsGFP, and the density of dsGFP-positive neurons was plotted. Scale bars, (I) and (J), 100 μm; (K) 10 μm. Student’s t test. (L) Schematic representation for a test of activity-dependent gene therapy in hCAs. (M) Local field potential showing a decrease in activity after addition of KCl (orange line) in hCAs transduced with cfos-EKC compared with cfos-dsGFP. For the purpose of illustration, the voltage range illustrated is ± 0.5 mV. (N) (Top) Baseline LFP amplitude spectra for hCAs treated with cfos-dsGFP or cfos-EKC. (Bottom) Amplitude changes across frequencies after KCl. (O) Percentage change in the median standard deviation (SD), normalized to baseline activity, as a proxy for network activity. Student’s t test. (P) Time course of SD during the experiment. Two-way ANOVA. (Q) Change in SD in hCA transduced with either cfos-dsGFP or cfos-EKC divided into two periods: <2000 s before cfos activation and >2000 s after cfos activation (two-way ANOVA followed by Bonferroni multiple comparison test).

Comment in

References

    1. Fusar-Poli P, et al. JAMA Psychiatry. 2013;70:107–120. - PMC - PubMed
    1. Harvey S, King MD, Gorman KM. Front Neurol. 2021;12:659064. - PMC - PubMed
    1. Staley K. Nat Neurosci. 2015;18:367–372. - PMC - PubMed
    1. Brodie MJ. CNS Drugs. 2017;31:527–534. - PubMed
    1. Kullmann DM, Schorge S, Walker MC, Wykes RC. Nat Rev Neurol. 2014;10:300–304. - PubMed

Publication types

Substances