. 2022 Nov 4;378(6619):eadc9020.
doi: 10.1126/science.adc9020. Epub 2022 Nov 4.

Molecular basis of astrocyte diversity and morphology across the CNS in health and disease

Affiliations

Molecular basis of astrocyte diversity and morphology across the CNS in health and disease

Fumito Endo et al. Science. .

Abstract

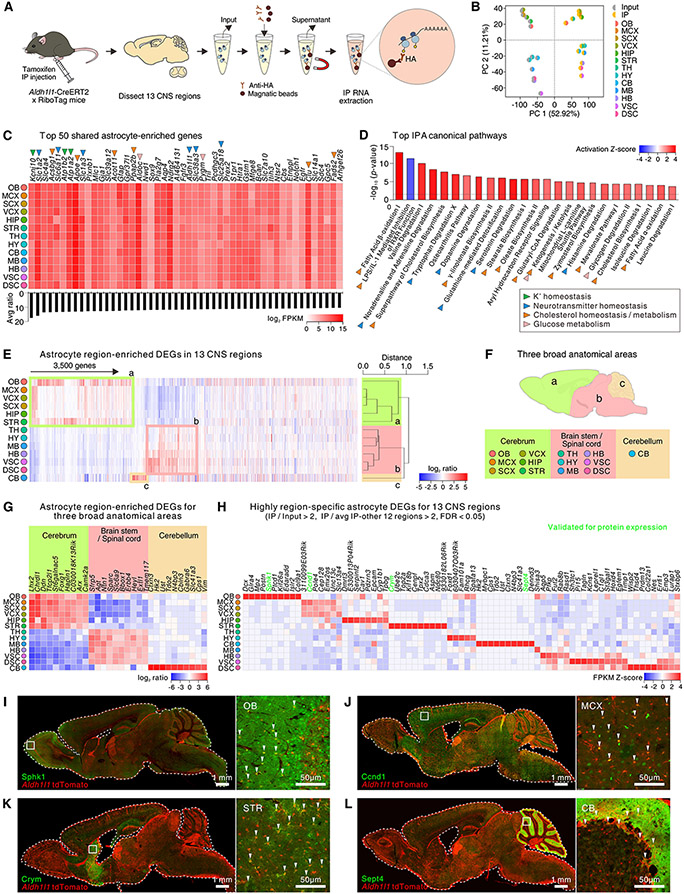
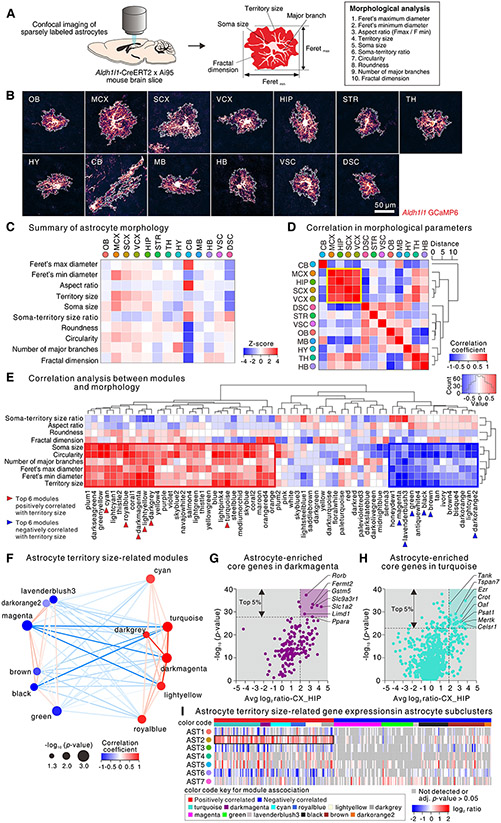
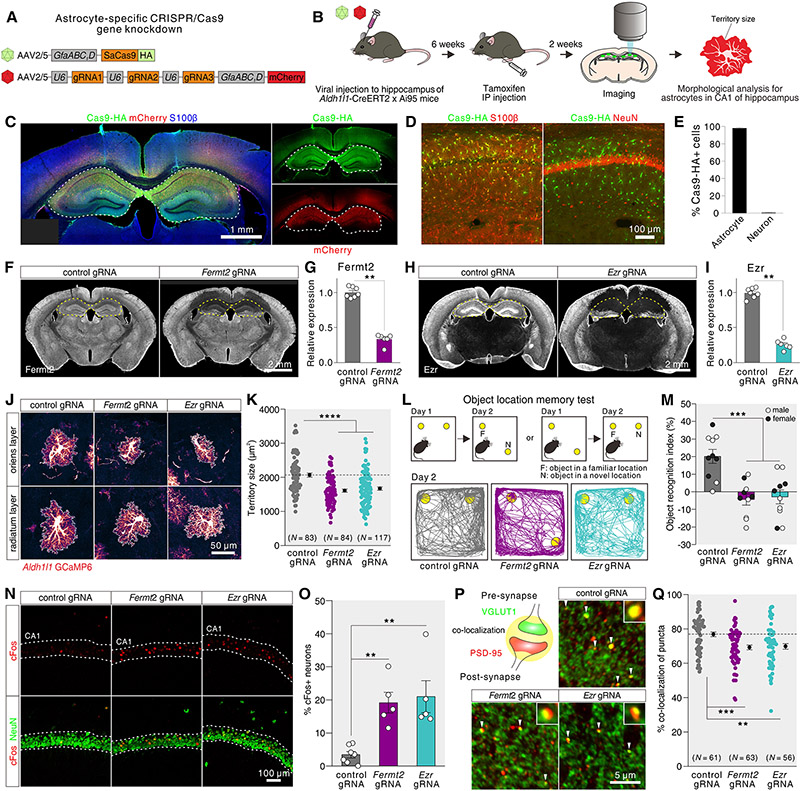
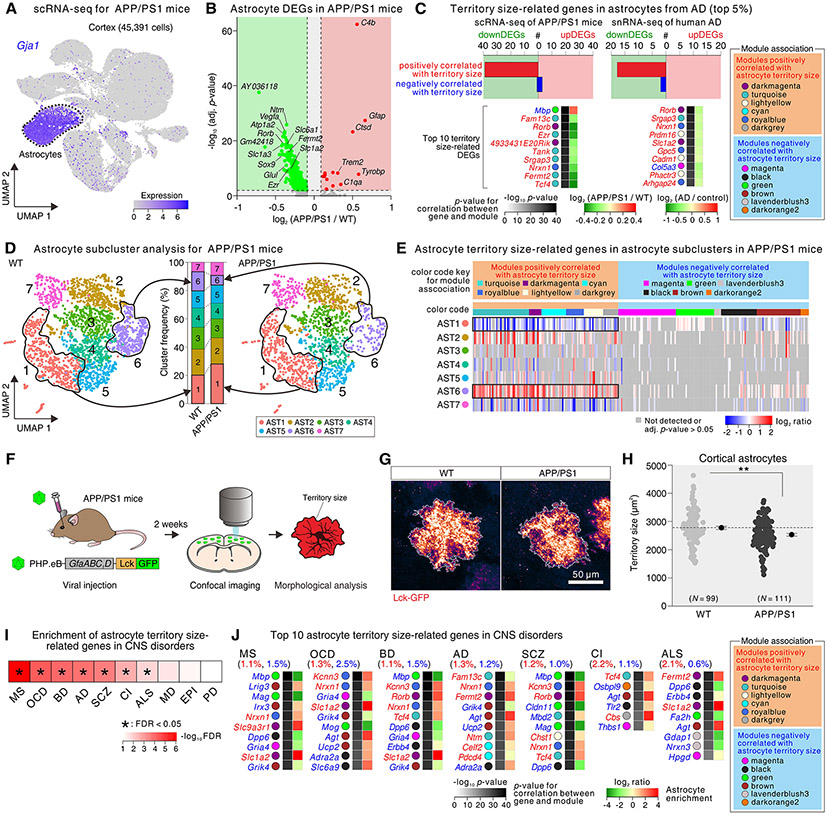
Astrocytes, a type of glia, are abundant and morphologically complex cells. Here, we report astrocyte molecular profiles, diversity, and morphology across the mouse central nervous system (CNS). We identified shared and region-specific astrocytic genes and functions and explored the cellular origins of their regional diversity. We identified gene networks correlated with astrocyte morphology, several of which unexpectedly contained Alzheimer's disease (AD) risk genes. CRISPR/Cas9-mediated reduction of candidate genes reduced astrocyte morphological complexity and resulted in cognitive deficits. The same genes were down-regulated in human AD, in an AD mouse model that displayed reduced astrocyte morphology, and in other human brain disorders. We thus provide comprehensive molecular data on astrocyte diversity and mechanisms across the CNS and on the molecular basis of astrocyte morphology in health and disease.


Figures

Fig. 1.
Fig. 1.. Astrocyte density and astrocyte-to-neuron ratios across mouse CNS.
(A) Experimental design for investigating astrocytes in 13 CNS regions. (B) Illustration and representative images of whole-brain astrocyte imaging by FAST (A: anterior, L: lateral, V: vertical). The brains were from Aldh1l1-Cre/ERT2 x Ai14 (Aldh1l1 tdTomato) mice. (C) Representative coronal sections of Aldh1l1-Cre/ERT2 x Ai14 (Aldh1l1 tdTomato) mouse brains imaged by FAST. Magnified images show tdTomato+ astrocytes in the motor cortex (MCX), hippocampus (HIP), and striatum (STR), the other 10 regions are shown in fig. S1. The color images show exemplar Sox9 and Aldh1l1 driven tdTomato images (see fig. S2). (D) Astrocyte density measurements by FAST in 13 CNS regions (N = 3 mice for spinal cord; N = 6 mice for brain). (E) Plot shows the astrocyte-to-neuron ratio in 13 CNS regions (N = 8 mice). (F,G) Plot of astrocyte and neuron numbers in 13 CNS regions. (H) Correlation between astrocyte and neuron numbers. Data are shown as mean ± SEM.
Fig. 2:
Fig. 2:. Shared and unique astrocyte CNS molecular signatures and mechanisms.
(A) Approach for astrocyte-specific RNA-seq. (B) Multi-dimensional scaling plot for input and immunoprecipitated (IP) (N = 4-5 mice) RNA-seq data. (C) Heat map shows the log2 FPKM values of the top 50 most enriched astrocyte genes shared in 13 regions. The bar graph shows the average ratio of IP versus input. Colored arrowheads indicate functional class. (D) The bar graph depicts the top 25 Ingenuity Pathway Analysis (IPA) canonical pathways for the 825 shared astrocyte-enriched genes with a threshold of p value < 0.05. The colored arrowheads indicate functional class. (E) Heat map showing 3,500 astrocyte region-enriched DEGs in 13 CNS regions with a cluster dendrogram. Astrocyte region-specific DEGs are defined by comparing IP in one CNS region with the average of IP samples from the other 12 regions with a threshold of log2 ratio > 1, FDR < 0.05, and FPKM > 1. From the dendrogram, astrocytes classified into 3 broad groups. Genes defining OB, MCX, SCX, HIP, and STR (cerebrum) are outlined in green (a). Genes highly expressed within and defining TH, HY, MB, HB, VSC, and DSC (brain stem or spinal cord) are outlined in pink (b). Genes highly expressed within and defining CB (cerebellum) are outlined in orange (c) and include Bergmann glia genes. (F) Schematic of anatomical grouping of astrocytes in 13 CNS regions based on RNA-seq. (G) Heat map depicts the log2 ratio of IP vs the averaged IP from the other 12 regions of the top 10 astrocyte-specific DEGs for anatomically relevant CNS regions. (H) The heat map shows the top region specific astrocyte genes from RNA-seq. (I-L) Representative (N = 4 mice) IHC images for Sphk (I), Ccnd1 (J), Crym (K), and Sept4 (L), which reproduced regional expression in OB, MCX, striatum and cerebellum, respectively.
Fig. 3:
Fig. 3:. Origins of astrocyte diversity from regional and scRNA-seq data.
(A) Experimental procedure for scRNA-seq. Single cells were dissociated from the cortex, hippocampus, and striatum of wild type mice (N = 4-7 mice). Data of striatal cells were partly from our recent study (34) and combined with new cortical, hippocampal, and striatal single cell data. (B) Uniform manifold approximation and projection (UMAP) plot of 89,553 brain cells from 3 CNS regions grouped by expression similarity identified 26 major cell populations (10 major cell types). (C) UMAP plot of cluster analysis for 8,898 astrocytes (AST1 and AST2 in panel B) from 3 CNS regions. The cell numbers of astrocyte subclusters are shown as AST1 to AST7. (D) UMAP plot of the astrocyte subclusters to illustrate the three different brain regions examined. (E) UMAP plots from panel C showing expression of Chrdl1, Gfap, and Crym. (F). The heat map shows the top 100 genes that were upregulated in each astrocyte subcluster relative to the others. Example genes are identified. (G) Proportional bar graph showing the percentage of each astrocyte subcluster representation in the 3 CNS regions from scRNA-seq data. (H) Correlations between astrocyte-region specific RNA-seq data (left), bulk RNA-seq data (middle), and bulk RNA-seq minus astrocyte region specific RNA-seq (right) that were gathered as part of Fig 2. The correlation plots show that astrocytes grouped into three broad anatomical areas (a, b, and c).
Fig. 4:
Fig. 4:. Astrocyte morphology-related gene networks.
(A) Procedure for morphological analysis of astrocytes (an artificial red LUT was used). (B) Representative images of single astrocytes from 13 CNS regions. (C) A heat map of aggregate Z-score of the astrocyte morphological parameters across 13 CNS regions (raw data in fig. S16). (D) A heat map showing the correlation coefficient along with a cluster dendrogram of morphological parameter Z-scores of astrocytes in 13 CNS regions. Four regions (MCX, SCX, VCX, and HIP) that are the most correlated are outlined in yellow. (E) Heat map showing correlation coefficients along with cluster dendrograms among 62 module eigengenes (MEs) in WGCNA as well as the morphological parameters of astrocytes from 13 CNS regions. A histogram in the color scale represents the coefficient values. The WGCNA modules highly correlated with morphological parameters, including for territory size, are outlined in red (positive correlation) or blue (negative correlation). (F) Multidimensional scaling plot of MEs significantly correlated with astrocyte territory size (p value < 0.05). Size of the node indicates p value, color of the node indicates correlation coefficient with astrocyte territory size, and color of the line indicates correlation coefficient between two MEs. (G, H) Scatter plots showing log2 ratio (IP vs input) for the average value from MCX, SCX, VCX, and HIP and -log10 (p value) for correlation of genes within darkmagenta (G) and turquoise (H) modules. Several genes are named and the top 5% are emphasized in the graphs with background coloring. (I) Heat map shows expression of the top 5% morphology-related genes within astrocyte subclusters from 3 CNS regions identified in Fig. 3.
Fig. 5:
Fig. 5:. Evaluation of astrocyte morphology-related genes with CRISPR/Cas9.
(A) AAVs used for astrocyte-specific CRISPR-Cas9 gene knockdown. (B) Schematic of morphology analysis of hippocampal astrocytes using astrocyte-specific CRISPR/Cas9 gene knockdowns. (C) Exemplar images of brain sections immunostained for SaCas9-HA (green) and mCherry (red). (D) Images of hippocampal astrocytes in 2-3 month wild type mice injected with AAV for astrocyte-specific SaCas9 immunostained for SaCas9-HA (green), S100β (red, left) or NeuN (red, right). (E) Percentage of SaCas9-HA+ astrocytes or neurons in the hippocampus of wild type mice injected with AAV for SaCas9 (N = 3). (F) Exemplar images of sections immunostained with Fermt2 antibody. Brains were microinjected with AAV for astrocyte-specific SaCas9 and with AAV for control gRNAs or AAV for Fermt2 gRNAs in the hippocampus. Loss of Fermt2 immunostaining was observed in the hippocampus. (G) Knocking-down efficiency for Fermt2 protein in the hippocampus of Aldh1l1-Cre/ERT2 x Ai95 mice injected with astrocyte-specific AAV for SaCas9 and AAV for Fermt2 gRNAs (N = 6-7). (H-I) As in F-G, but for Ezr (N = 6-7). (J, K) Images and data for astrocytes in the hippocampal CA1 layers of Aldh1l1-Cre/ERT2 x Ai95 mice injected with AAV for astrocyte-selective SaCas9 and AAV for control gRNAs, Fermt2 gRNAs, or Ezr gRNAs (83-117 astrocytes from N = 3 mice per group). (L, M) Object location memory test to assess control, Fermt2, and Ezr knockdown mice. Schematic, representative traces and average data are shown (N = 10 mice; males and females shown). The differences were significant for both sexes (p = 0.015 for males, p = 0.0076 for females) and for pooled data (p < 0.0001) using ANOVA; sex differences were not our focus and so average data are shown. (N, O) Representative images and average data for cFos positive neurons (NeuN) in the CA1 region of the hippocampus from control, Fermt2, and Ezr knockdown mice (N = 5-7 mice). (P, Q) Representative images and average data for VGLUT1 and PSD-95 co-localization in the CA1 region of the hippocampus from control, Fermt2, and Ezr knockdown mice (25-35 images from N = 5-7 mice per group). The graph shows the % of PSD95 puncta co-localized with VGLUT1. In panel Q, the points represent the average co-localization between VGLUT1 and PSD-95 puncta for each image (see fig. S19 for additional analyses). Data are shown as mean ± SEM.
Fig. 6:
Fig. 6:. Astrocyte morphology-related genes in an AD mouse model, human AD, and for other CNS disorders.
(A) UMAP plot (45,391 cells) from the cortex of wild type and APP/PS1 mice grouped by expression similarity identified 10 cell populations. Astrocytes were identified by the expression of Gja1. (B) Volcano plot showing DEGs within astrocytes of APP/PS1 vs wild type mice (adj. p-value < 0.05, log2 fold change > 0.10 or < −0.10); several genes named. (C) The upper graphs show the number of territory size-related genes from the up and downregulated DEGs in astrocytes that were altered in scRNA-seq data from APP/PS1 mice and in human AD snRNA-seq data. The heat maps show the top 10 territory size-related genes that displayed high log10 p values in the WGCNA analyses (from the top 5% from WGCNA). The WGCNA modules that the genes belong to are on the right. (D) UMAP plot of cluster analysis (3,808 astrocytes) from wild type (WT) and APP/PS1 mice in relation to the bar graph showing cluster frequency of astrocyte subclusters for wild type (WT) and APP/PS1 mice (N = 9-10 mice). (E) Heat map shows expression of the morphology-related genes (top 5% from Fig. 4) within astrocyte subclusters in APP/PS1 mice. Genes positively correlated with astrocyte morphology were enriched in cluster 6, which was reduced in APP/PS1 mice. In contrast, genes positively correlated with morphology were depleted in cluster 1, which was increased in APP/PS1 mice. (F) Procedure for morphology analysis of cortical astrocytes in APP/PS1 mice. (G) Images of single astrocytes from the cortex labeled with Lck-GFP in wild type (WT) and APP/PS1. (H) Analysis of Lck-GFP labeled astrocyte territory size in the cortex of WT and APP/PS1 mice (N = 99-111 astrocytes from 3 mice per group). (I) Hypergeometric heat map shows enrichment of astrocyte territory related genes within those associated with CNS disorders. * indicates significance with a FDR < 0.05. (J) Top 10 astrocyte territory size-related genes that overlapped with genes associated with AD, amyotrophic lateral sclerosis (ALS), cerebral infarction (CI), multiple sclerosis (MS), schizophrenia (SCZ), bipolar disorder (BD), and obsessive-compulsive disorder (OCD). Data are shown as mean ± SEM.

Comment in

References

    1. Bargmann C et al., BRAIN 2025: a scientific vision. Brain Research through Advancing Innovative Neurotechnologies (BRAIN) Working Group Report to the Advisory Committee to the Director, NIH, (2014).
    1. Insel TR, Landis SC, Collins FS, Research priorities. The NIH BRAIN Initiative. Science (New York, N.Y.) 340, 687–688 (2013). - PMC - PubMed
    1. Barres BA, The mystery and magic of glia: a perspective on their roles in health and disease. Neuron 60, 430–440 (2008). - PubMed
    1. Allen NJ, Lyons DA, Glia as architects of central nervous system formation and function. Science (New York, N.Y.) 362, 181–185 (2018). - PMC - PubMed
    1. Yu X, Nagai J, Khakh BS, Improved tools to study astrocytes. Nature reviews. Neuroscience 21, 121–138 (2020). - PubMed

Publication types