. 2023 Feb 23;141(8):886-903.
doi: 10.1182/blood.2022016835.

Aging drives Tet2+/- clonal hematopoiesis via IL-1 signaling

Affiliations

Aging drives Tet2+/- clonal hematopoiesis via IL-1 signaling

Francisco Caiado et al. Blood. .

Abstract

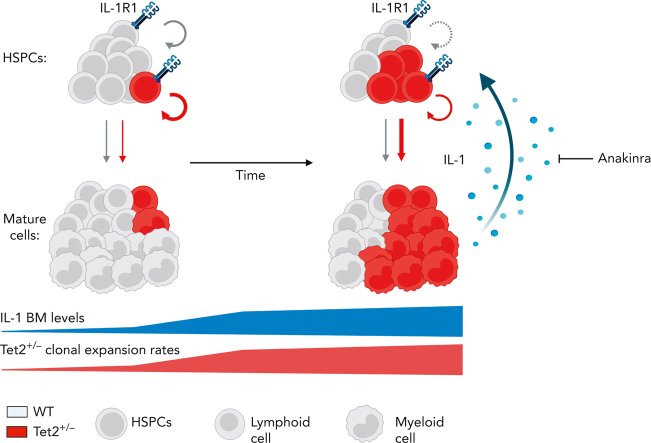
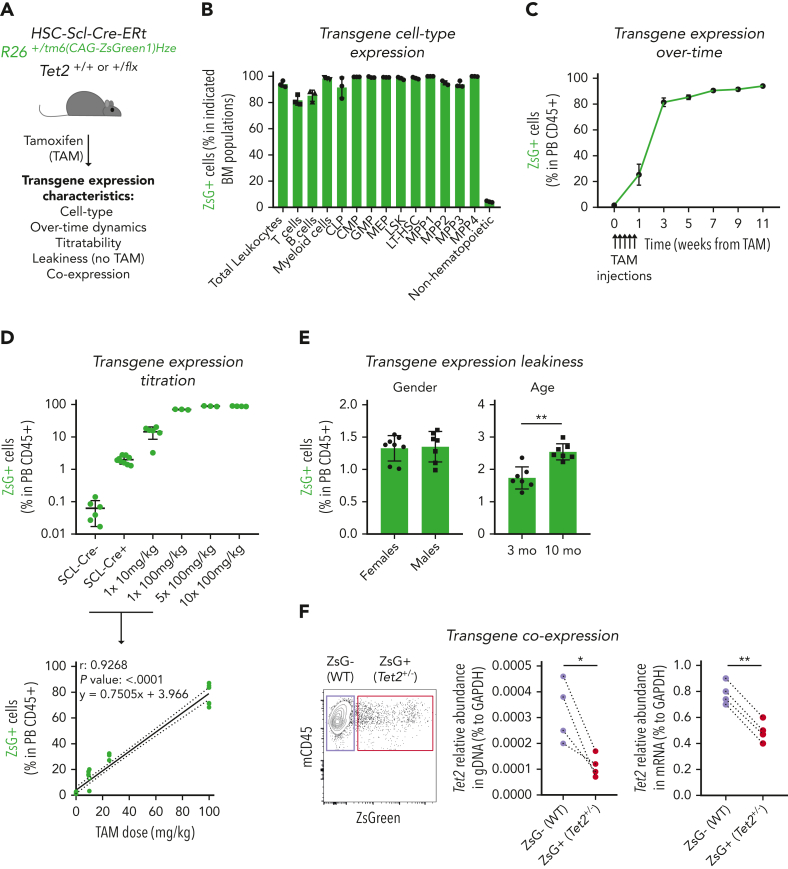
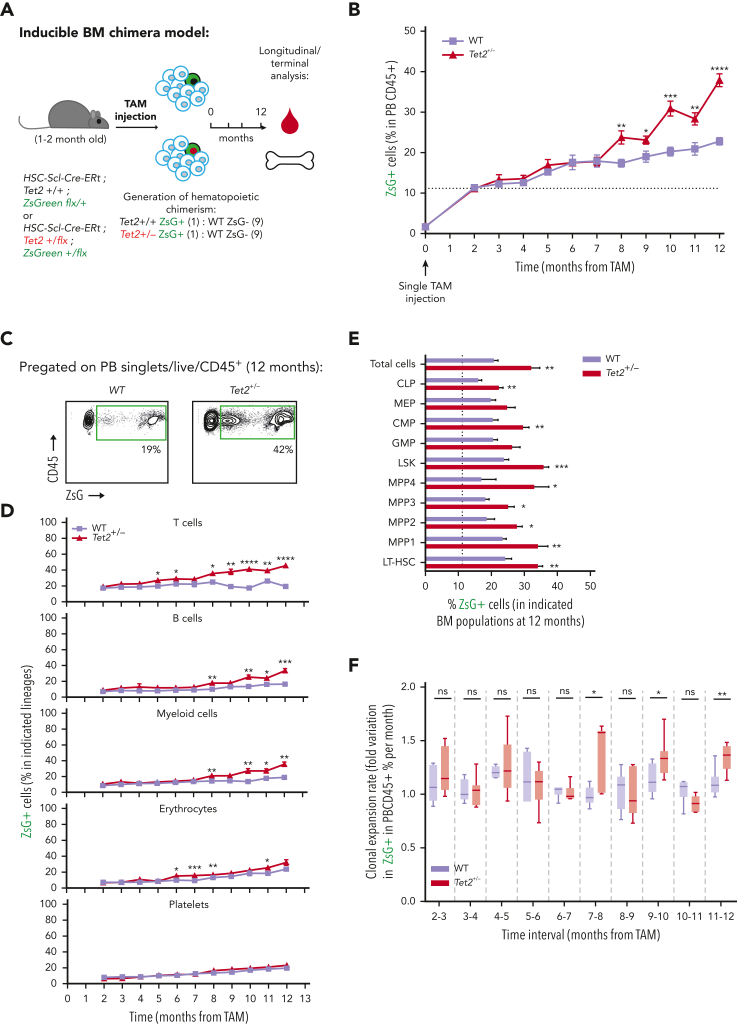
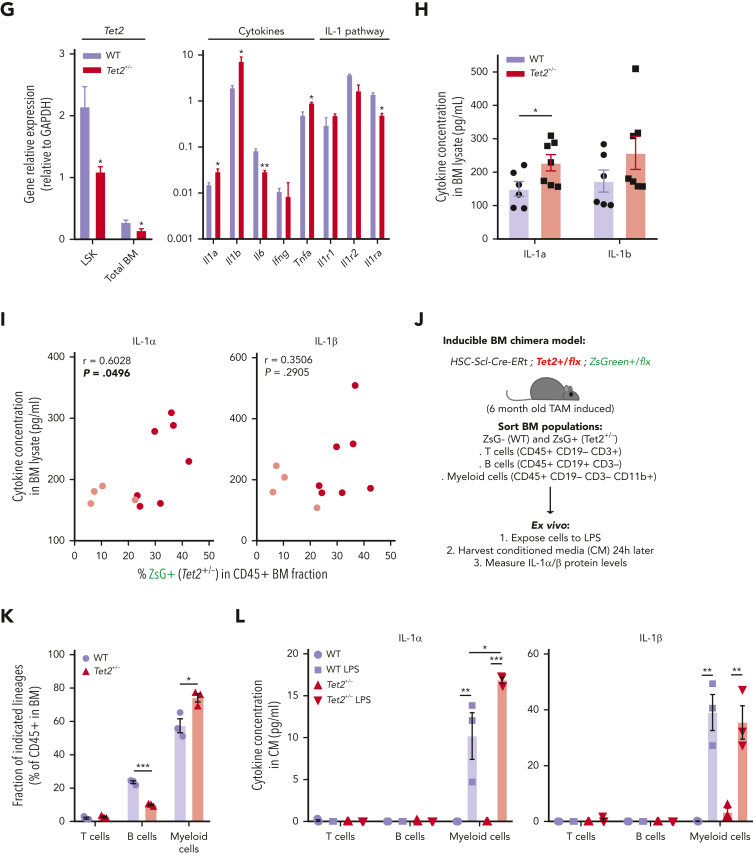
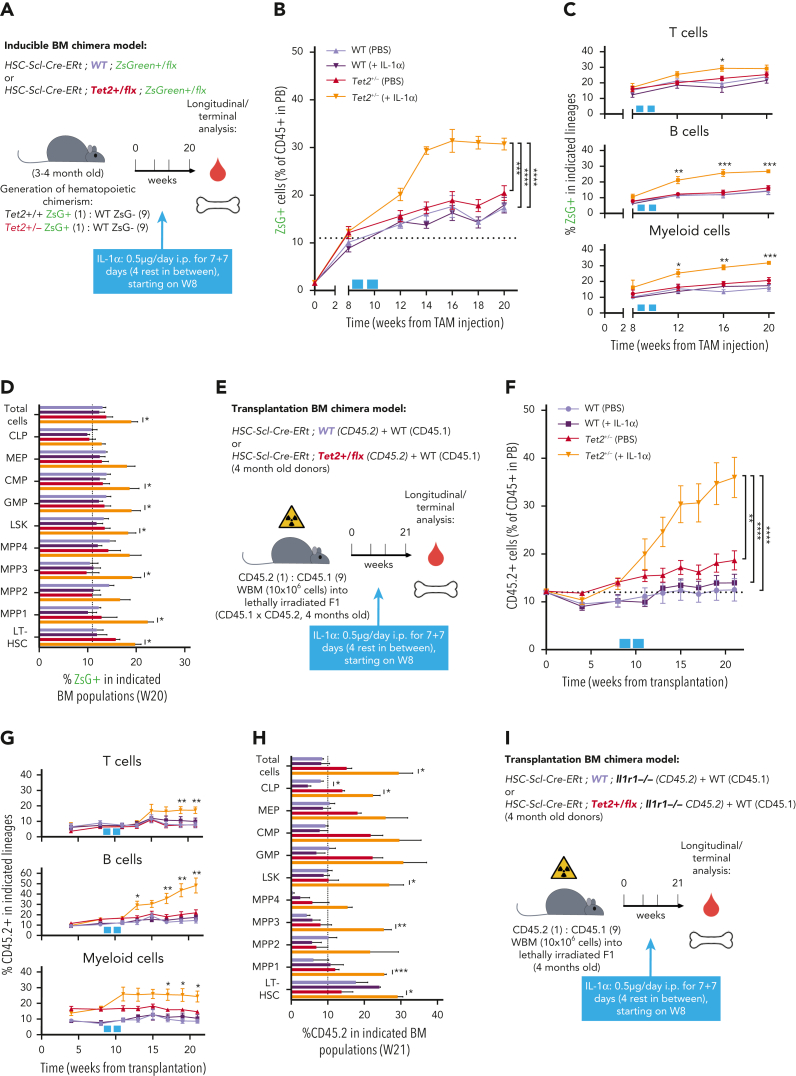
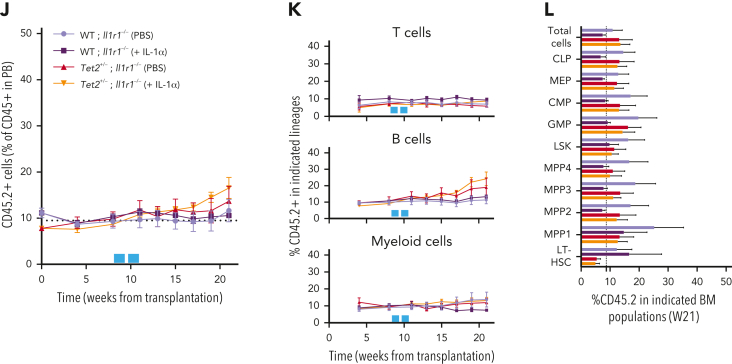
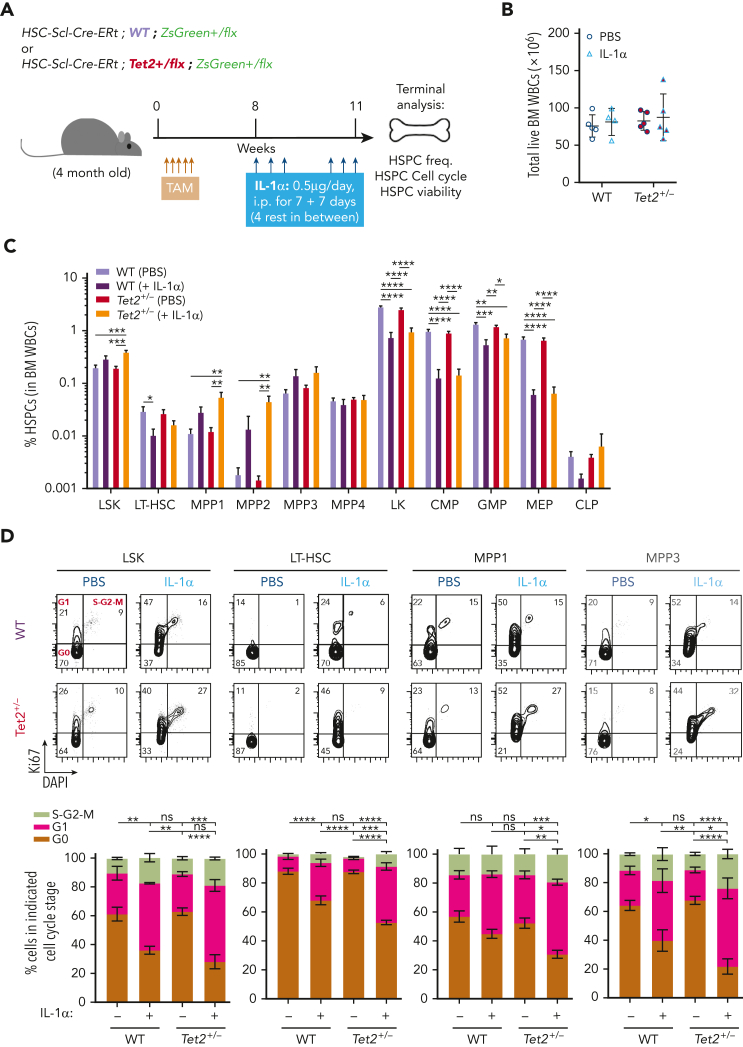
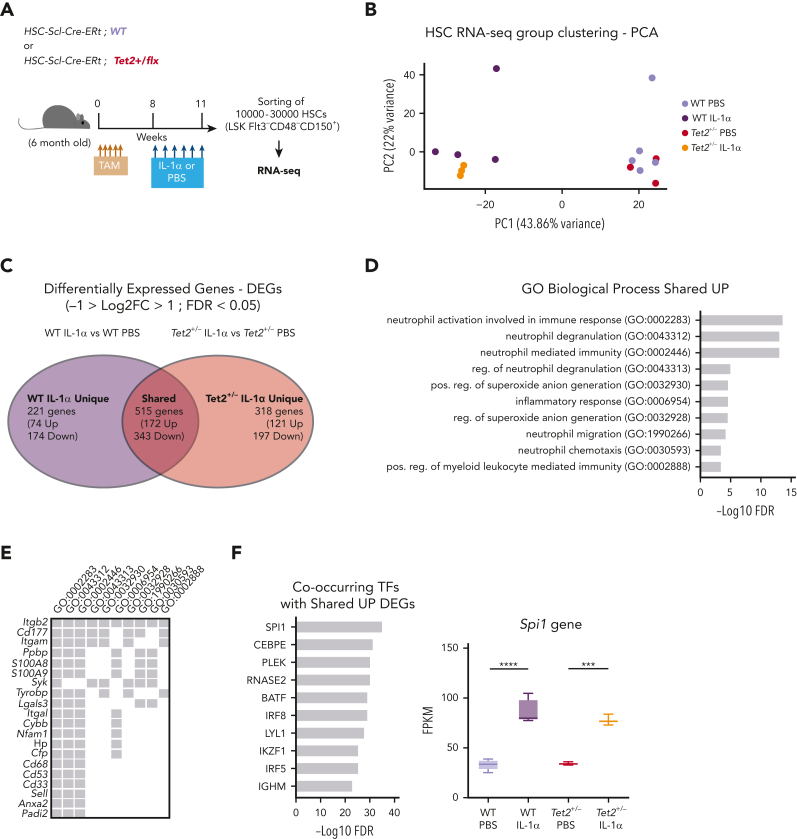
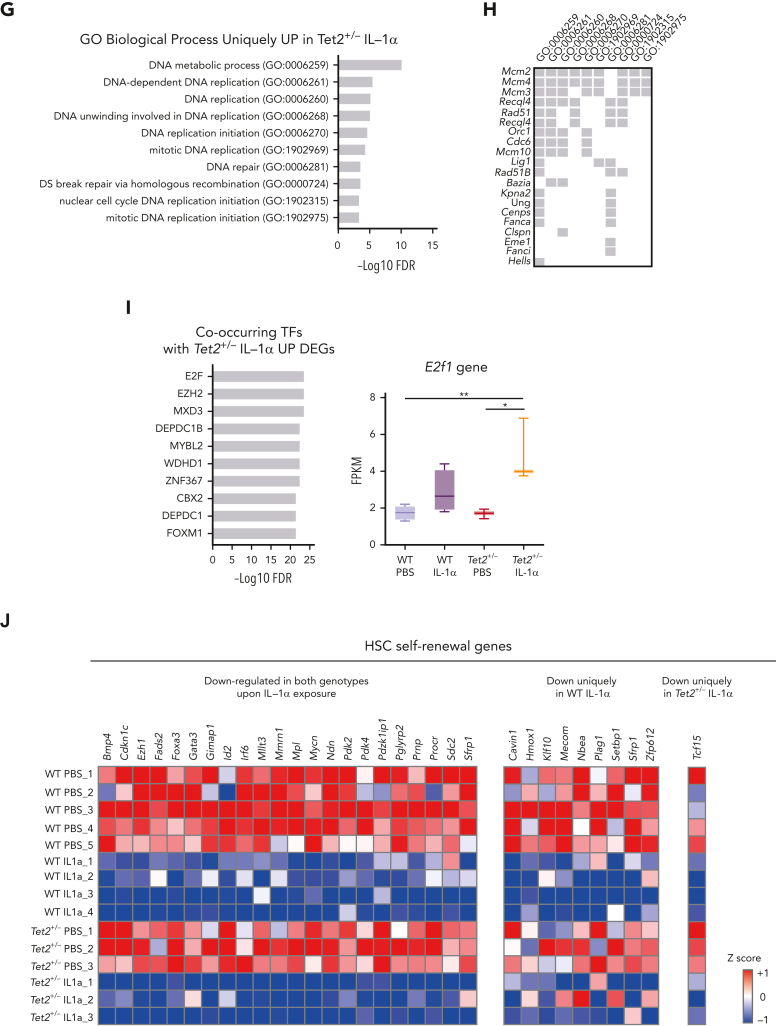
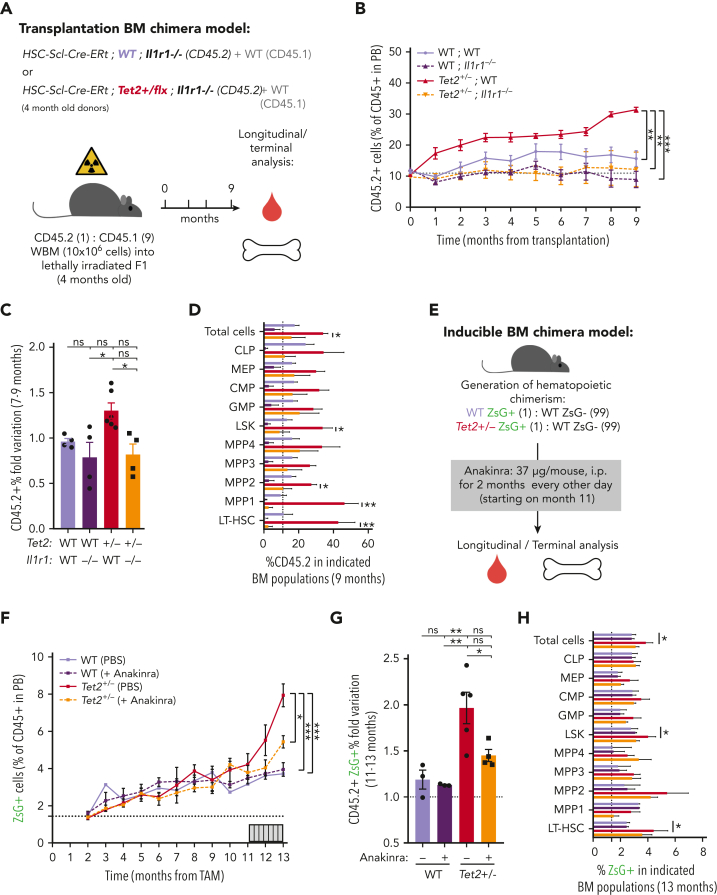
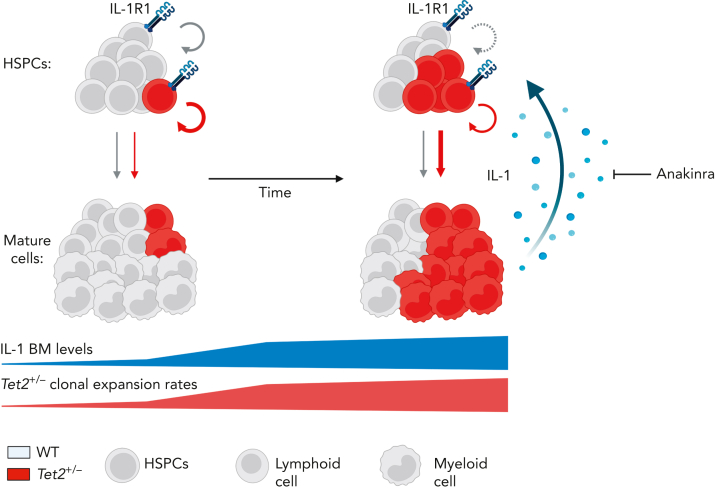
Clonal hematopoiesis of indeterminate potential (CHIP), also referred to as aging-related clonal hematopoiesis, is defined as an asymptomatic clonal expansion of mutant mature hematopoietic cells in ≥4% of blood leukocytes. CHIP associates with advanced age and increased risk for hematological malignancy, cardiovascular disease, and all-cause mortality. Loss-of-function somatic mutations in TET2 are frequent drivers of CHIP. However, the contribution of aging-associated cooperating cell-extrinsic drivers, like inflammation, remains underexplored. Using bone marrow (BM) transplantation and newly developed genetic mosaicism (HSC-SCL-Cre-ERT; Tet2+/flox; R26+/tm6[CAG-ZsGreen1]Hze) mouse models of Tet2+/-driven CHIP, we observed an association between increased Tet2+/- clonal expansion and higher BM levels of the inflammatory cytokine interleukin-1 (IL-1) upon aging. Administration of IL-1 to mice carrying CHIP led to an IL-1 receptor 1 (IL-1R1)-dependent expansion of Tet2+/- hematopoietic stem and progenitor cells (HSPCs) and mature blood cells. This expansion was caused by increased Tet2+/- HSPC cell cycle progression, increased multilineage differentiation, and higher repopulation capacity compared with their wild-type counterparts. In agreement, IL-1α-treated Tet2+/- hematopoietic stem cells showed increased DNA replication and repair transcriptomic signatures and reduced susceptibility to IL-1α-mediated downregulation of self-renewal genes. More important, genetic deletion of IL-1R1 in Tet2+/- HPSCs or pharmacologic inhibition of IL-1 signaling impaired Tet2+/- clonal expansion, establishing the IL-1 pathway as a relevant and therapeutically targetable driver of Tet2+/- CHIP progression during aging.


Conflict of interest statement

Conflict-of-interest disclosure: The authors declare no competing financial interests.

Figures

None
Graphical abstract
Figure 1.
Figure 1.
Generation of an inducible hematopoietic genetic mosaicism mouse model of Tet2+/−-driven clonal hematopoiesis. (A) Schematic representation of tamoxifen (TAM)–inducible, dose-dependent, and hematopoietic-specific genetic mosaicism mouse model of Tet2+/−-driven clonal hematopoiesis. (B) Percentage of ZsG+ cells in indicated BM populations 4 weeks after exposure to 5 consecutive TAM injections at 100 mg/kg (n = 3): common lymphoid progenitors (CLPs), common myeloid progenitors (CMPs), granulocyte-macrophage progenitors (GMPs), megakaryocyte-erythrocyte progenitors (MEPs), lineage Sca-1+ c-Kit+ (LSK), long-term hematopoietic stem cells (LT-HSCs), multipotent progenitors 1 to 4 (MPP1-4), and nonhematopoietic cells. (C) Longitudinal quantification of the percentage of ZsG+ in peripheral blood (PB) CD45+ cells after exposure to 5 consecutive TAM injections at 100 mg/kg (n = 3). (D) Percentage of ZsG+ in PB CD45+ cells 4 weeks after exposure to indicated TAM doses (n = 3) (top). Correlation between the percentage of PB ZsG+ CD45+ cells and the amount of TAM injected. Pearson correlation coefficient (r), P value, and linear equation are indicated (n = 29) (bottom). (E) Percentage of ZsG+ CD45+ cells in the absence of TAM injection (n = 7-8), in female or male adult mice (left); in 3-month-old (3 mo) or 10-month-old (10 mo) mice (right). (F) Representative dot plot of ZsG wild type (WT; purple box) and ZsG+Tet2+/− (red box) (left). Quantification of Tet2 gene abundance in genomic DNA (gDNA) from ZsG (WT) and ZsG+ (Tet2+/−) CD45+ cells (n = 4) (right). Quantification of Tet2 gene abundance in complementary DNA from ZsG (WT) and ZsG+ (Tet2+/−) CD45+ cells (n = 4). ∗P < .05, ∗∗P < .01 by unpaired (E) and paired (F) t-test. Error bars represent standard error of the mean. GAPDH, glyceraldehyde-3-phosphate dehydrogenase.
Figure 2.
Figure 2.
Hematopoietic Tet2+/− clonal expansion rate increases in aged mice and associates with increased IL-1 BM levels. (A) Experimental design. (B) Longitudinal quantification of the percentage of PB CD45+ WT ZsG+ (n = 6; purple line) and CD45+Tet2+/− ZsG+ (n = 7; red line) cells over 1 year after TAM induction. (C) Representative fluorescence-activated cell sorting plot of ZsG expression on PB CD45+ cells in 12-month-old WT and Tet2+/− mice. (D) Percentage of WT (n = 6) or Tet2+/− (n = 7) ZsG+ cells in PB T cells, B cells, myeloid cells, erythrocytes, and platelets. (E) Percentage of WT ZsG+ (n = 6) and Tet2+/− ZsG+ (n = 7) on indicated BM populations. (F) Monthly expansion rates of PB CD45+ WT ZsG+ (n = 6) and CD45+Tet2+/− ZsG+ (n = 7) populations at indicated time intervals. (G) Gene expression levels of indicated genes in WT ZsG+ (n = 3) and Tet2+/− ZsG+ (n = 3) in total BM white blood cells, 1 year after TAM induction. (H) IL-1α and IL-1β protein levels in BM lysates of WT (n = 6) or Tet2+/− (n = 7) mice, 1 year after TAM induction. (I) Correlation between BM IL-1α/IL-1β levels and the percentage of BM Tet2+/− ZsG+ cells (n = 11). Pearson correlation coefficient (r) and P values are indicated. Dark red dots indicate mice from Figure 1B; light red dots indicate additional mice with low Tet2+/− ZsG+ fractions. (J) Experimental design. (K) Fraction of T cells, B cells, or myeloid cells in WT (ZsG; n = 3) or Tet2+/− (ZsG+; n = 3) BM CD45+ cells. L. IL-1α (left) and IL-1β (right) protein levels in the conditioned media (CM) of sorted WT and Tet2+/− T cells, B cells, and myeloid cells without or with LPS exposure (n = 3). Data are a pool of at least 2 independent experiments for all graphs, except J through L. ∗P < .05, ∗∗P < .01, ∗∗∗P < .001, and ∗∗∗∗P < .0001 by unpaired t-test (B, E–H, and K) or by 1-way analysis of variance with Tukey correction (L). Error bars represent standard error of the mean. GAPDH, glyceraldehyde-3-phosphate dehydrogenase; ns, not significant.
Figure 2.
Figure 2.
Hematopoietic Tet2+/− clonal expansion rate increases in aged mice and associates with increased IL-1 BM levels. (A) Experimental design. (B) Longitudinal quantification of the percentage of PB CD45+ WT ZsG+ (n = 6; purple line) and CD45+Tet2+/− ZsG+ (n = 7; red line) cells over 1 year after TAM induction. (C) Representative fluorescence-activated cell sorting plot of ZsG expression on PB CD45+ cells in 12-month-old WT and Tet2+/− mice. (D) Percentage of WT (n = 6) or Tet2+/− (n = 7) ZsG+ cells in PB T cells, B cells, myeloid cells, erythrocytes, and platelets. (E) Percentage of WT ZsG+ (n = 6) and Tet2+/− ZsG+ (n = 7) on indicated BM populations. (F) Monthly expansion rates of PB CD45+ WT ZsG+ (n = 6) and CD45+Tet2+/− ZsG+ (n = 7) populations at indicated time intervals. (G) Gene expression levels of indicated genes in WT ZsG+ (n = 3) and Tet2+/− ZsG+ (n = 3) in total BM white blood cells, 1 year after TAM induction. (H) IL-1α and IL-1β protein levels in BM lysates of WT (n = 6) or Tet2+/− (n = 7) mice, 1 year after TAM induction. (I) Correlation between BM IL-1α/IL-1β levels and the percentage of BM Tet2+/− ZsG+ cells (n = 11). Pearson correlation coefficient (r) and P values are indicated. Dark red dots indicate mice from Figure 1B; light red dots indicate additional mice with low Tet2+/− ZsG+ fractions. (J) Experimental design. (K) Fraction of T cells, B cells, or myeloid cells in WT (ZsG; n = 3) or Tet2+/− (ZsG+; n = 3) BM CD45+ cells. L. IL-1α (left) and IL-1β (right) protein levels in the conditioned media (CM) of sorted WT and Tet2+/− T cells, B cells, and myeloid cells without or with LPS exposure (n = 3). Data are a pool of at least 2 independent experiments for all graphs, except J through L. ∗P < .05, ∗∗P < .01, ∗∗∗P < .001, and ∗∗∗∗P < .0001 by unpaired t-test (B, E–H, and K) or by 1-way analysis of variance with Tukey correction (L). Error bars represent standard error of the mean. GAPDH, glyceraldehyde-3-phosphate dehydrogenase; ns, not significant.
Figure 3.
Figure 3.
IL-1α–IL-1R1 axis directly drives Tet2+/− clonal expansion via increased multilineage differentiation. (A) Experimental design. (B) Longitudinal quantification of the percentage of CD45+ WT ZsG+ and CD45+Tet2+/− ZsG+ in PB of mice exposed to PBS or IL-1α (n = 2-5). (C) Longitudinal assessment of the percentage of WT or Tet2+/− ZsG+ cells in PB T cells, B cells, and myeloid cells of mice exposed to PBS or IL-1α (n = 4-6). Blue boxes on x-axis indicate IL-1α exposure period. (D) Terminal assessment of the percentage of WT or Tet2+/− ZsG+ cells in indicated BM populations of mice exposed to PBS or IL-1α (n = 4-6). (E) Experimental design. (F) Longitudinal quantification of the percentage of CD45.2+ WT and CD45.2+Tet2+/− in PB of mice exposed to PBS or IL-1α (n = 5-6). Blue boxes on x-axis indicate IL-1α exposure period. (G) Percentage of WT or Tet2+/− CD45.2+ cells in PB T cells, B cells, and myeloid cells of mice exposed to PBS or IL-1α (n = 5-6). (H) Percentage of WT or Tet2+/− CD45.2+ cells in indicated BM populations of mice exposed to PBS or IL-1α (n = 5-6). (I) Experimental design. (J) Longitudinal quantification of the percentage of CD45.2+ WT; Ilr1–/– and CD45.2+Tet2+/−; Ilr1–/– cells in PB of mice exposed to PBS or IL-1α (n = 5-6). Blue boxes on x-axis indicate IL-1α exposure period. (K) Percentage of CD45.2+ WT; Ilr1–/– and CD45.2+Tet2+/−; Ilr1–/– cells in PB T cells, B cells, and myeloid cells of mice exposed to PBS or IL-1α (n = 5-6). (L) Percentage of CD45.2+ WT; Ilr1–/– and CD45.2+Tet2+/−; Ilr1–/– cells in indicated BM populations of mice exposed to PBS or IL-1α (n = 5-6). ∗P < .05, ∗∗P < .01, ∗∗∗P < .001, and ∗∗∗∗P < .0001 by unpaired t-test (between PBS and IL-1α conditions, within the same genotype for C, D, G, H, K, and L) or by a 1-way analysis of variance with Tukey correction (for last time point in B, F, and J). Error bars represent standard error of the mean. WBM, whole bone marrow.
Figure 3.
Figure 3.
IL-1α–IL-1R1 axis directly drives Tet2+/− clonal expansion via increased multilineage differentiation. (A) Experimental design. (B) Longitudinal quantification of the percentage of CD45+ WT ZsG+ and CD45+Tet2+/− ZsG+ in PB of mice exposed to PBS or IL-1α (n = 2-5). (C) Longitudinal assessment of the percentage of WT or Tet2+/− ZsG+ cells in PB T cells, B cells, and myeloid cells of mice exposed to PBS or IL-1α (n = 4-6). Blue boxes on x-axis indicate IL-1α exposure period. (D) Terminal assessment of the percentage of WT or Tet2+/− ZsG+ cells in indicated BM populations of mice exposed to PBS or IL-1α (n = 4-6). (E) Experimental design. (F) Longitudinal quantification of the percentage of CD45.2+ WT and CD45.2+Tet2+/− in PB of mice exposed to PBS or IL-1α (n = 5-6). Blue boxes on x-axis indicate IL-1α exposure period. (G) Percentage of WT or Tet2+/− CD45.2+ cells in PB T cells, B cells, and myeloid cells of mice exposed to PBS or IL-1α (n = 5-6). (H) Percentage of WT or Tet2+/− CD45.2+ cells in indicated BM populations of mice exposed to PBS or IL-1α (n = 5-6). (I) Experimental design. (J) Longitudinal quantification of the percentage of CD45.2+ WT; Ilr1–/– and CD45.2+Tet2+/−; Ilr1–/– cells in PB of mice exposed to PBS or IL-1α (n = 5-6). Blue boxes on x-axis indicate IL-1α exposure period. (K) Percentage of CD45.2+ WT; Ilr1–/– and CD45.2+Tet2+/−; Ilr1–/– cells in PB T cells, B cells, and myeloid cells of mice exposed to PBS or IL-1α (n = 5-6). (L) Percentage of CD45.2+ WT; Ilr1–/– and CD45.2+Tet2+/−; Ilr1–/– cells in indicated BM populations of mice exposed to PBS or IL-1α (n = 5-6). ∗P < .05, ∗∗P < .01, ∗∗∗P < .001, and ∗∗∗∗P < .0001 by unpaired t-test (between PBS and IL-1α conditions, within the same genotype for C, D, G, H, K, and L) or by a 1-way analysis of variance with Tukey correction (for last time point in B, F, and J). Error bars represent standard error of the mean. WBM, whole bone marrow.
Figure 4.
Figure 4.
Tet2+/− HSPCs maintain higher proliferative and repopulation capacity than WT in response to long-term IL-1α. (A) Experimental design. (B) Number of total white blood cells in BM (2 femurs and 2 tibias) of WT and Tet2+/− mice exposed to PBS or IL-1α (n = 4-5). (C) Percentage of indicated BM populations in WT and Tet2+/− mice exposed to PBS or IL-1α (n = 4-5). (D) Representative fluorescence-activated cell sorting plot of cell cycle analysis of indicated populations; percentage per quadrant is indicated. Percentage of indicated BM populations in G0, G1, or S-G2-M phases of cell cycle from WT and Tet2+/− mice exposed to PBS or IL-1α (n = 4-5). Statistical analysis performed for G0 stage. (E) Experimental design. (F) Quantification of total colony numbers after plating (P)/replating (R) of WT and Tet2+/− LSK/total cells in methylcellulose after initial exposure to PBS or IL-1α (n = 3). (G) Experimental design. (H) Longitudinal quantification of percentage of donor-derived PB CD45.2+ WT and CD45.2+Tet2+/− from mice exposed to PBS or IL-1α in a 50:50 BM competition in vivo setting with untreated CD45.1 WT BM cells (n = 6-7). (I) Percentage of CD45.2+ cells in indicated PB and BM (J) populations from in WT and Tet2+/− mice exposed to PBS or IL-1α (n = 6-7). (J) Depicted in the graphs are the fold variation values between indicated means. Data are a pool of at least 2 independent experiments. ∗P < .05, ∗∗P < .01, ∗∗∗P < .001, and ∗∗∗∗P < .0001 by a 1-way analysis of variation with Tukey correction. Error bars represent standard error of the mean. ns, not significant; WBM, whole bone marrow.
Figure 4.
Figure 4.
Tet2+/− HSPCs maintain higher proliferative and repopulation capacity than WT in response to long-term IL-1α. (A) Experimental design. (B) Number of total white blood cells in BM (2 femurs and 2 tibias) of WT and Tet2+/− mice exposed to PBS or IL-1α (n = 4-5). (C) Percentage of indicated BM populations in WT and Tet2+/− mice exposed to PBS or IL-1α (n = 4-5). (D) Representative fluorescence-activated cell sorting plot of cell cycle analysis of indicated populations; percentage per quadrant is indicated. Percentage of indicated BM populations in G0, G1, or S-G2-M phases of cell cycle from WT and Tet2+/− mice exposed to PBS or IL-1α (n = 4-5). Statistical analysis performed for G0 stage. (E) Experimental design. (F) Quantification of total colony numbers after plating (P)/replating (R) of WT and Tet2+/− LSK/total cells in methylcellulose after initial exposure to PBS or IL-1α (n = 3). (G) Experimental design. (H) Longitudinal quantification of percentage of donor-derived PB CD45.2+ WT and CD45.2+Tet2+/− from mice exposed to PBS or IL-1α in a 50:50 BM competition in vivo setting with untreated CD45.1 WT BM cells (n = 6-7). (I) Percentage of CD45.2+ cells in indicated PB and BM (J) populations from in WT and Tet2+/− mice exposed to PBS or IL-1α (n = 6-7). (J) Depicted in the graphs are the fold variation values between indicated means. Data are a pool of at least 2 independent experiments. ∗P < .05, ∗∗P < .01, ∗∗∗P < .001, and ∗∗∗∗P < .0001 by a 1-way analysis of variation with Tukey correction. Error bars represent standard error of the mean. ns, not significant; WBM, whole bone marrow.
Figure 5.
Figure 5.
IL-1α–exposed Tet2+/−HSCs upregulate proliferation and maintain self-renewal transcriptomic signatures. (A) Experimental design. (B) Principal component analysis (PCA) plot of WT HSCs treated with PBS (n = 5) or IL-1 (n = 4) and Tet2+/− HSCs treated with PBS (n = 3) or IL-1α (n = 3) based on regularized log gene-level counts. (C) Venn diagram depicting differentially expressed genes (DEGs; −1 > log2[fold change {FC}] > 1; false discovery rate [FDR] < 0.05) in HSCs exposed to IL-1α or PBS, which are unique to WT, unique to Tet2+/−, or shared between the 2 groups. (D) Overrepresented GO BP terms (maximum of 10 terms) for upregulated DEGs, shared between WT and Tet2+/− HSCs exposed to IL-1α. GO BPs are displayed in ascending order, according to –logFDR value. (E) Upregulated shared DEGs (maximum of 20 genes) present in indicated overrepresented GO BPs. (F) Co-occurring transcription factors (TFs; maximum of 10) with shared UP DEGs. TFs are displayed in ascending order, according to –logFDR value. Boxplot Spi1 gene expression values (fragments per kilobase million [FPKMs]) in indicated groups (right). (G) Overrepresented GO BP terms (maximum of 10 terms) for upregulated DEGs unique to Tet2+/− HSCs exposed to IL-1α. GO BPs are displayed in ascending order, according to –logFDR value. (H) Upregulated DEGs (maximum of 20 genes) unique to Tet2+/− IL-1α group present in indicated overrepresented GO BPs. (I) Co-occurring TFs (maximum of 10) with upregulated DEGs unique to Tet2+/− IL-1α group. TFs are displayed in ascending order, according to –logFDR value. Boxplot of E2f1 gene expression values (FPKMs) in indicated groups (right). (J) Heat map showing expression of genes implicated in HSC self-renewal. Column Z-scores are normalized. All genes displayed are significantly downregulated between PBS and IL-1α conditions, independently of HSC genotype (first gene set); PBS and IL-1α condition in WT HSCs (second gene set); and PBS and IL-1α condition in Tet2+/− HSCs (third gene set). ∗P < .05, ∗∗P < .01, ∗∗∗P < .001, and ∗∗∗∗P < .0001 by a 1-way analysis of variance with Tukey correction. RNA-seq, RNA sequencing.
Figure 5.
Figure 5.
IL-1α–exposed Tet2+/−HSCs upregulate proliferation and maintain self-renewal transcriptomic signatures. (A) Experimental design. (B) Principal component analysis (PCA) plot of WT HSCs treated with PBS (n = 5) or IL-1 (n = 4) and Tet2+/− HSCs treated with PBS (n = 3) or IL-1α (n = 3) based on regularized log gene-level counts. (C) Venn diagram depicting differentially expressed genes (DEGs; −1 > log2[fold change {FC}] > 1; false discovery rate [FDR] < 0.05) in HSCs exposed to IL-1α or PBS, which are unique to WT, unique to Tet2+/−, or shared between the 2 groups. (D) Overrepresented GO BP terms (maximum of 10 terms) for upregulated DEGs, shared between WT and Tet2+/− HSCs exposed to IL-1α. GO BPs are displayed in ascending order, according to –logFDR value. (E) Upregulated shared DEGs (maximum of 20 genes) present in indicated overrepresented GO BPs. (F) Co-occurring transcription factors (TFs; maximum of 10) with shared UP DEGs. TFs are displayed in ascending order, according to –logFDR value. Boxplot Spi1 gene expression values (fragments per kilobase million [FPKMs]) in indicated groups (right). (G) Overrepresented GO BP terms (maximum of 10 terms) for upregulated DEGs unique to Tet2+/− HSCs exposed to IL-1α. GO BPs are displayed in ascending order, according to –logFDR value. (H) Upregulated DEGs (maximum of 20 genes) unique to Tet2+/− IL-1α group present in indicated overrepresented GO BPs. (I) Co-occurring TFs (maximum of 10) with upregulated DEGs unique to Tet2+/− IL-1α group. TFs are displayed in ascending order, according to –logFDR value. Boxplot of E2f1 gene expression values (FPKMs) in indicated groups (right). (J) Heat map showing expression of genes implicated in HSC self-renewal. Column Z-scores are normalized. All genes displayed are significantly downregulated between PBS and IL-1α conditions, independently of HSC genotype (first gene set); PBS and IL-1α condition in WT HSCs (second gene set); and PBS and IL-1α condition in Tet2+/− HSCs (third gene set). ∗P < .05, ∗∗P < .01, ∗∗∗P < .001, and ∗∗∗∗P < .0001 by a 1-way analysis of variance with Tukey correction. RNA-seq, RNA sequencing.
Figure 6.
Figure 6.
Genetic and pharmacologic blockage of IL-1–IL-1R1 signaling reduces Tet2+/−clonal expansion during aging. (A) Experimental design. (B) Longitudinal quantification of the percentage of donor-derived peripheral blood (PB) CD45.2+ cells from indicated genotypes: WT; WT, WT; Ilr1–/–, Tet2+/−; WT and Tet2+/−; Ilr1–/–, over 9 months after transplantation (n = 4-6). (C) Fold variation (within 7- to 9-month period) in the percentage of donor-derived PB CD45.2+ cells from indicated genotypes. (D) Terminal assessment of the percentage of donor-derived BM populations from indicated genotypes. (E) Experimental design. (F) Longitudinal quantification of the percentage of CD45+ WT ZsG+ and CD45+Tet2+/− ZsG+ in PB of mice exposed to PBS or anakinra treatment (hIL1ra) (n = 3-5). (G) Fold variation (within 11-13 months) in the percentage of CD45+ WT ZsG+ and CD45+Tet2+/− ZsG+ cells in PB of mice exposed to PBS or hIL1ra (n = 3-5). (H) Percentage of WT ZsG+ and Tet2+/− ZsG+ on indicated BM populations after PBS or anakinra treatment (n = 3-5). ∗P < .05, ∗∗P < .01, ∗∗∗P < .001, and ∗∗∗∗P < .0001 by unpaired t-test (within the same genotype; D and H) or by a 1-way analysis of variance with Tukey correction (last time point on B, C, F, and G). Error bars represent standard error of the mean. ns, not significant; WBM, whole bone marrow.
Figure 7.
Figure 7.
Model of IL-1–mediated inflammaging as a driver of Tet2+/−clonal hematopoiesis. Working model on positive feedback loop driving development of aberrant Tet2+/− hematopoiesis induced by inflammaging-derived IL-1. Increased IL-1 levels derived from aged Tet2+/− mature myeloid cells act directly on HSPCs favoring Tet2+/− HSPC expansion (circular arrows), repopulation capacity, and multilineage differentiation (linear arrows) over WT HSPCs. IL-1–mediated Tet2+/− clonal expansion can be modulated by the administration of IL-1R1 antagonist (anakinra). See Discussion for detailed explanation.

Comment in

References

    1. Genovese G, Kähler AK, Handsaker RE, et al. Clonal hematopoiesis and blood-cancer risk inferred from blood DNA sequence. N Engl J Med. 2014;371(26):2477–2487. - PMC - PubMed
    1. Jaiswal S, Fontanillas P, Flannick J, et al. Age-related clonal hematopoiesis associated with adverse outcomes. N Engl J Med. 2014;371(26):2488–2498. - PMC - PubMed
    1. Xie M, Lu C, Wang J, et al. Age-related mutations associated with clonal hematopoietic expansion and malignancies. Nat Med. 2014;20(12):1472–1478. - PMC - PubMed
    1. Jaiswal S, Libby P. Clonal haematopoiesis: connecting ageing and inflammation in cardiovascular disease. Nat Rev Cardiol. 2019;17(3):137–144. - PMC - PubMed
    1. Abelson S, Collord G, Ng SWK, et al. Prediction of acute myeloid leukaemia risk in healthy individuals. Nature. 2018;559(7714):400–404. - PMC - PubMed

Publication types