. 2022 Nov 14;40(11):1358-1373.e8.
doi: 10.1016/j.ccell.2022.10.017.

Immune biomarkers of response to immunotherapy in patients with high-risk smoldering myeloma

Affiliations

Immune biomarkers of response to immunotherapy in patients with high-risk smoldering myeloma

Romanos Sklavenitis-Pistofidis et al. Cancer Cell. .

Abstract

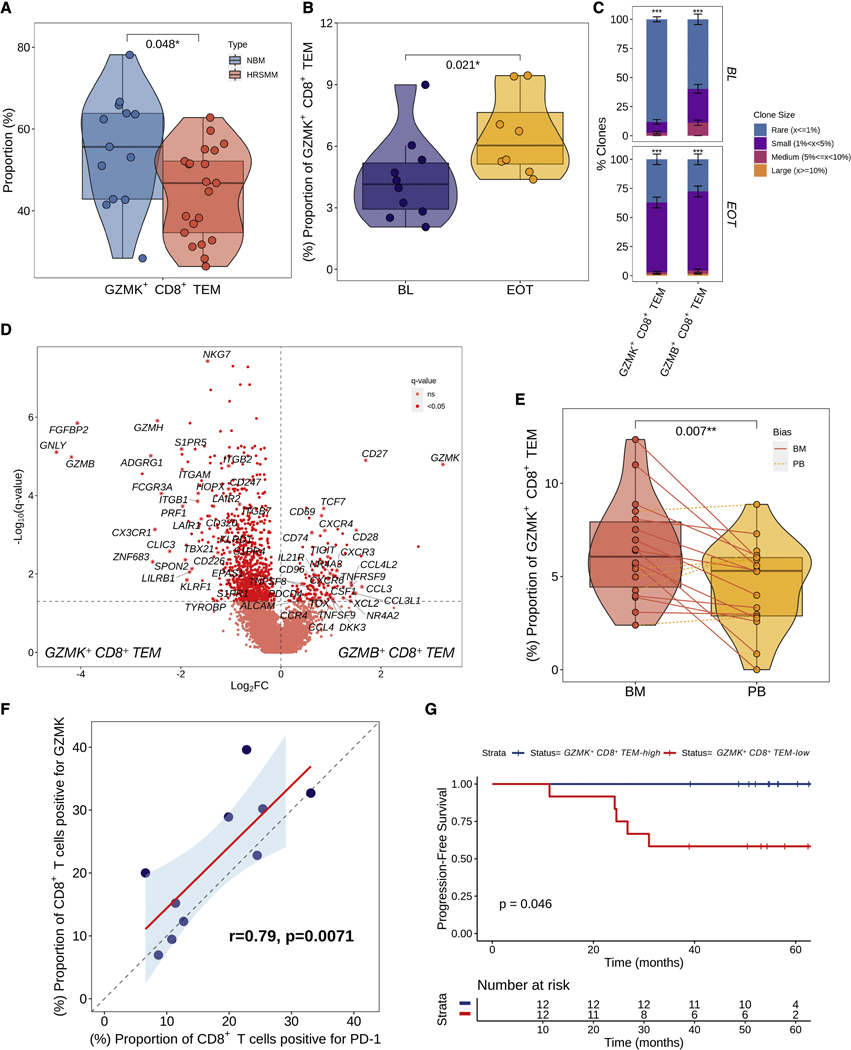
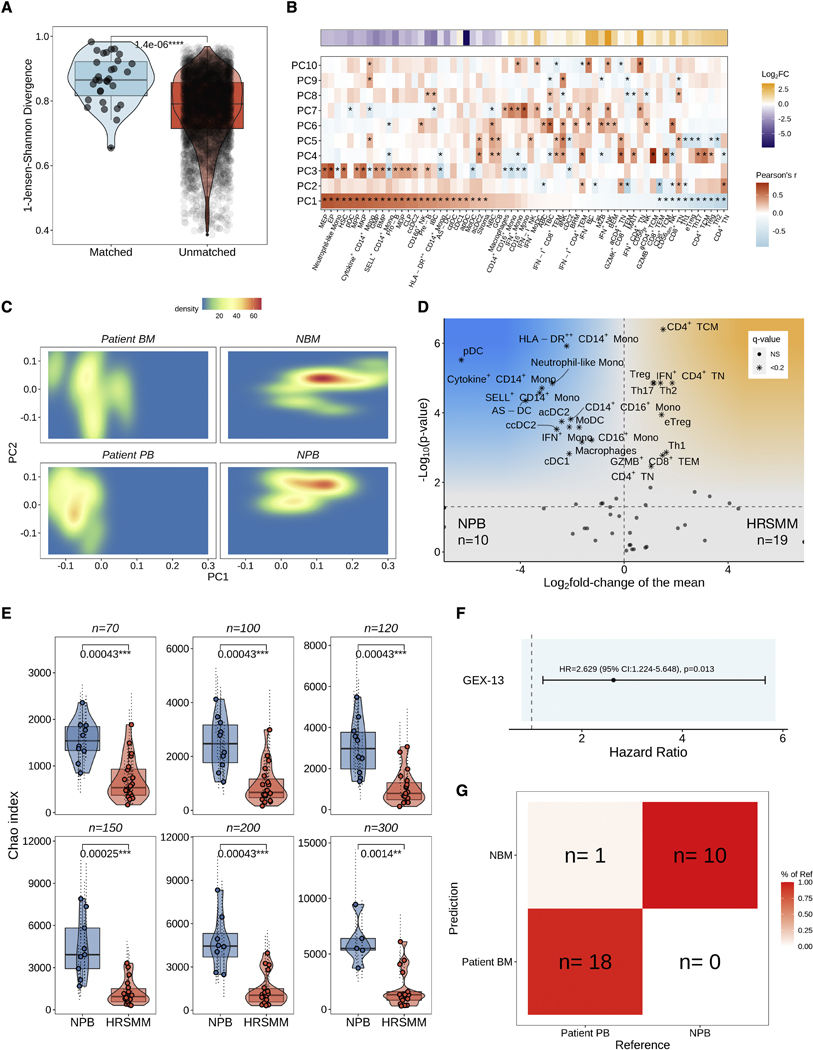
Patients with smoldering multiple myeloma (SMM) are observed until progression, but early treatment may improve outcomes. We conducted a phase II trial of elotuzumab, lenalidomide, and dexamethasone (EloLenDex) in patients with high-risk SMM and performed single-cell RNA and T cell receptor (TCR) sequencing on 149 bone marrow (BM) and peripheral blood (PB) samples from patients and healthy donors (HDs). We find that early treatment with EloLenDex is safe and effective and provide a comprehensive characterization of alterations in immune cell composition and TCR repertoire diversity in patients. We show that the similarity of a patient's immune cell composition to that of HDs may have prognostic relevance at diagnosis and after treatment and that the abundance of granzyme K (GZMK)+ CD8+ effector memory T (TEM) cells may be associated with treatment response. Last, we uncover similarities between immune alterations observed in the BM and PB, suggesting that PB-based immune profiling may have diagnostic and prognostic utility.

Keywords: bone marrow; granzyme K; immune biomarkers; immune profiling; immunotherapy; peripheral blood; single-cell RNA sequencing; single-cell TCR sequencing; smoldering multiple myeloma.


Conflict of interest statement

Declaration of interests N.J.H. is a consultant for Constellation Pharmaceuticals. F.A. is an employee of Illumina Inc. O.Z. is an employee of Ikena Oncology and a stockholder in Ikena Oncology and Morphosys AG. G.G. receives research funds from IBM and Pharmacyclics and is an inventor on patent applications filed by the Broad Institute related to MSMuTect, MSMutSig, POLYSOLVER, SignatureAnalyzer-GPU, and MSIDetect. He is also a founder and consultant of and holds privately held equity in Scorpion Therapeutics. I.M.G. has a consulting or advisory role with AbbVie, Adaptive, Amgen, Aptitude Health, Bristol Myers Squibb, GlaxoSmithKline, Huron Consulting, Janssen, Menarini Silicon Biosystems, Oncopeptides, Pfizer, Sanofi, Sognef, Takeda, The Binding Site, and Window Therapeutics and has received speaker fees from Vor Biopharma and Veeva Systems, Inc., and her spouse is the CMO and equity holder of Disc Medicine. S.M. has a consulting role with Abbvie, Adaptive Biotechnology, Amgen, Celgene/BMS, GlaxoSmithKline, Janssen, Novartis, Oncopeptides, Regeneron, Roche, and Takeda and has received research funding from Abbvie, Adaptive Biotechnology, Amgen, Celgene/BMS, GlaxoSmithKline, Janssen, Novartis, Oncopeptides, Regeneron, Roche, and Takeda. A.J.Y. has a consulting role with Adaptive Biotechnologies, Amgen, BMS, Celgene, GSK, Janssen, Karyopharm, Oncopeptides, Sanofi, and Takeda and has received research funding from Amgen, Janssen, and Takeda. M.B. is a consultant for Sanofi, Genzyme, and Janssen and has received research funding from MedImmune, Janssen, Legend Biotech, Amgen, Celularity, Bristol Myers Squibb, Celgene, Bluebird bio, Millennium, Takeda, Cerecor (currently Avalo Therapeutics), and C4 Therapeutics. M.B has an advisory role and received honoraria from Bristol Myers Squibb, Takeda, Janssen, and Menarini. T.H.M. received advisory board fees from Legend Biotech. R.S.-P., G.G., and I.M.G. are co-inventors on a patent application related to this work (PCT/US22/74839).

Figures

Figure 1.
Figure 1.
Genomic dissection of response to early treatment with EloLenDex. A) Kaplan-Meier (KM) curve of Progression-Free Survival (PFS) in the E-PRISM cohort (n=46). B, C) Scatter plot of cancer cell fractions (CCF) at BL and EOT for progressor patients #1 and #2 (in red: mutational drivers and CNVs associated with risk of progression). All CNVs and mutational drivers are visualized. D) Comutation plot visualizing the genomic landscape of the E-PRISM cohort at BL (n=34). E) Univariate Cox regression forest plot of genomic variables present in at least 3 individuals. Hazard ratio, 95% confidence interval, and p-values were computed using Cox proportional hazards regression. F) KM curve of PFS in the E-PRISM cohort, stratified based on the presence of del17p (n=33). See also Figures S1, S2, and Table S1.
Figure 2.
Figure 2.
BM and PB immune cell populations in the E-PRISM cohort. UMAP embeddings and heatmaps of gene expression markers (Mean Z-score of normalized expression) in T cells (A, B), NK cells (C, D), B cells (E, F), Monocytes (G, H), Dendritic cells (I, J), and Progenitor cells (K, L).
Figure 3.
Figure 3.
Comprehensive profiling of changes in BM immune cell composition and TCR repertoire in patients with HRSMM. A) Volcano plot of proportion changes in the BM of patients with HRSMM (n=32) compared to HD (NBM, n=19) with at least 100 cells overall. P-values were computed with Wilcoxon’s rank-sum test and corrected using the Benjamini-Hochberg approach. Cell types with a q-value of <0.2 were marked with stars. B) Boxplots, violin plots, and scatter plots comparing BM TCR repertoire diversity, as assessed by the Chao index, between patients with HRSMM (n=14) and healthy individuals (NBM, n=11) given different numbers of downsampled cells. Each data point represents the average diversity estimate across 100 random samples of the given size for a single sample; the range of diversity estimates across all iterations for each sample is visualized in error bars (dotted line). Violin outline width represents density. P-values were computed with Wilcoxon’s rank-sum tests. (Box: 1st quartile, median, 3rd quartile; whiskers: +/− 1.5*IQR). C) Barplots showing the proportion of T cells in a given BL patient sample (P, n=14) or sample from a HD (n=11) that were determined to belong to one of four clone size categories (Rare: ≤1%; Small: >1% and <5%; Medium: ≥5% and <10%; Large: ≥10%) through iterative (n=100) downsampling of 100 cells. The average proportion per clone size category was visualized and the standard deviation across iterations was depicted in solid-line error bars. D) UMAP embedding of HD BM (NBM) and patient BM T cells at BL with matched TCR data. T cells belonging to rare clonotypes (with a frequency of ≤1%) were colored in blue, while T cells belonging to expanded clonotypes (with a frequency of >1%) were colored in red. E) Barplots showing the proportion of clonotypes in a given T cell subtype across all patients (n=14) or HD (n=11) that belonged to one of the four clone size categories. For each T cell subtype, 100 cells were randomly sampled 100 times from all patients or HD, and the proportion of expanded (1-Rare) clonotypes was compared between patients and HD using bootstrapping with 10,000 iterations. The average proportion per clone size category was visualized and the standard deviation across iterations was depicted in solid-line error bars. F) Volcano plot highlighting genes that are highly expressed in expanded GZMB+ CD8+ TEM cells from patients (n=743, in red) compared to expanded GZMB+ CD8+ TEM cells from HD (n=1,074, in blue). See also Figures S3 and S4.
Figure 4.
Figure 4.
Immune reactivity at BL and post-therapy immune normalization are associated with significantly longer PFS in patients with HRSMM under treatment. A) Barplot visualizing the signed importance of each cell type towards the classification. B) Kaplan-Meier (KM) curve of PFS in the E-PRISM cohort, stratified based on the median normalization score (Reactivity+: > median) (n=24). C, D) Barplots visualizing the frequency of 20–2-20 risk stages (C) and del17p (D) by reactivity status (LR: low-risk, IR: intermediate-risk, HR: high-risk). The p-value was computed with a Fisher’s exact test. E) UMAP embedding of lymphocytes and myeloid cells colored by the log-scaled activity of signature GEX-6. F, G) Volcano plots visualizing genes that are differentially expressed in GZMK+ CD8+ TEM (F) and GZMB+ CD8+ TEM (G) cells of reactive patients (n=12) compared to non-reactive (n=12). H) Barplot visualizing the proportion of clonotypes belonging to each of four clone size categories per cytotoxic T cell subtype in BM samples from reactive (n=7) or non-reactive patients (n=7). For each T cell subtype, 100 cells were randomly sampled 100 times from patients with or without reactivity, and the proportion of expanded (1-Rare) clonotypes was compared between the two using bootstrapping with 10,000 iterations. The average proportion per clone size category was visualized and the standard deviation across iterations was depicted in solid-line error bars. I) Boxplots, violin plots, and scatter plots visualizing normalization scores in patient BM samples drawn at BL (n=28) or EOT (n=16), and in HD BM samples (NBM, n=22). Violin outline width represents density. P-values were computed using a paired t-test for paired patient samples or Wilcoxon’s rank-sum test for comparisons between patients and HD. (Box: 1st quartile, median, 3rd quartile; whiskers: +/− 1.5*IQR). J) Boxplots, violin plots, and scatter plots visualizing paired normalization scores at BL and EOT from patients with HRSMM (n=12). Violin outline width represents density. Solid lines connect samples from patients classified as PIN+; dashed lined connect samples from patients classified as PIN. (Box: 1st quartile, median, 3rd quartile; whiskers: +/− 1.5*IQR). K) Histogram of the distribution of change in normalization scores between paired BL and EOT BM patient samples (n=12). The dashed line corresponds to the threshold used to determine the presence of PIN. L) KM curve of PFS in the E-PRISM cohort, stratified based on PIN status (n=12). See also Figure S5.
Figure 5.
Figure 5.
A higher abundance of Granzyme K-expressing CD8+ T cells is associated with longer PFS in patients with HRSMM treated with EloLenDex. A) Boxplots, violin plots, and scatter plots visualizing the relative abundance of GZMK+ CD8+ TEM and GZMB+ CD8+ TEM out of all cytotoxic T cells in patient BM (n=33) at BL compared to samples from HD (NBM, n=22). Violin outline width represents density. P-values were computed with Wilcoxon’s rank-sum test. (Box: 1st quartile, median, 3rd quartile; whiskers: +/− 1.5*IQR). B) Boxplots, violin plots, and scatter plots visualizing the abundance of GZMK+ CD8+ TEM cells by CyTOF in patient BM samples drawn at BL (n=10) and EOT (n=7). Violin outline width represents density. The p-value was computed with Wilcoxon’s rank-sum test, as these samples were not paired. (Box: 1st quartile, median, 3rd quartile; whiskers: +/− 1.5*IQR). C) Barplot visualizing the proportion of clonotypes belonging to each of four clone size categories per cytotoxic T cell subtype in patient PB samples drawn at BL (n=22) or EOT (n=17). For each T cell subtype, 100 cells were randomly sampled 100 times from patients at BL and EOT, and the proportion of expanded (1-Rare) clonotypes was compared between the two using bootstrapping with 10,000 iterations. The average proportion per clone size category was visualized and the standard deviation across iterations was depicted in solid-line error bars. D) Volcano plot visualizing genes that are differentially expressed between GZMK+ CD8+ TEM and GZMB+ CD8+ TEM cells from patient BM samples drawn at BL (n=28). E) Boxplots, violin plots, and scatter plots comparing the abundance of GZMK+ CD8+ TEM cells between paired BM and PB samples drawn at BL from patients with HRSMM (n=22). Violin outline width represents density. Solid red lines connect samples that are enriched in the BM, while dashed orange lines connect samples that are enriched in the PB. The p-value was computed using a paired t-test. (Box: 1st quartile, median, 3rd quartile; whiskers: +/− 1.5*IQR). F) Scatter plot visualizing the correlation between the BL proportion of CD8+ T cells expressing PD-1 and those expressing GZMK by CyTOF (n=10). A regression line was fitted (in red) and the correlation coefficient and p-value were computed using Pearson’s approach. G) Kaplan-Meier curve of PFS in the E-PRISM cohort, stratified based on the median abundance of GZMK+ CD8+ TEM cells in patient BM samples at BL (n=26). See also Figure S6.
Figure 6.
Figure 6.
PB-based immune profiling accurately detects alterations in immune cell composition and TCR repertoire diversity observed in the BM. A) Boxplots, violin plots, and scatter plots showing the Jensen-Shannon divergence between matched BM and PB samples (n=22), compared to unmatched samples. Violin outline width represents density. The p-value was computed using Wilcoxon’s rank-sum test. (Box: 1st quartile, median, 3rd quartile; whiskers: +/− 1.5*IQR). B) Heatmap of Pearson’s correlation coefficient (r) between BM immune cell abundance and the first 10 principal components. The x-axis was sorted by decreasing PC1 value. The top panel shows the log2 fold-change in abundance between BM samples from patients with HRSMM (n=32) and those from HD (n=19). P-values were corrected using the Benjamini-Hochberg approach and stars correspond to pairs with significant (q<0.05) correlation. C) Two-dimensional density plot of BM and PB samples from patients (BM: n=26, PB: n=29) or HD (BM: n=22, PB: 10) according to PC1 and PC2. D) Volcano plot of proportion changes in the PB of patients with HRSMM (n=19) compared to HD (NPB, n=10) with at least 100 cells overall. P-values were computed with Wilcoxon’s rank-sum test and corrected using the Benjamini-Hochberg approach. Cell types with a q-value of <0.2 were marked with stars. E) Boxplots, violin plots, and scatter plots comparing PB TCR repertoire diversity, as assessed by the Chao index, between patients with HRSMM (n=22) and healthy individuals (NPB, n=10) given different numbers of downsampled cells. Each data point represents the average diversity estimate across 100 random samples of the given size for a single sample; the range of diversity estimates across all iterations for each sample is visualized in error bars (dotted line). Violin outline width represents density. P-values were computed with Wilcoxon’s rank-sum tests. (Box: 1st quartile, median, 3rd quartile; whiskers: +/− 1.5*IQR). F) Forest plot showing the effect of mean BL GEX-13 activity in the PB on PFS. Hazard ratio, 95% confidence interval, and p-value were computed using Cox proportional hazards regression. G) Confusion matrix visualizing the accuracy of a Naïve Bayes classifier trained on BM samples from patients and HD (training set, n=41) and tested in PB samples (n=29). See also Figure S7.

Comment in

References

    1. Weiss BM, Abadie J, Verma P, Howard RS, and Kuehl WM (2009). A monoclonal gammopathy precedes multiple myeloma in most patients. Blood 113, 5418–5422. 10.1182/blood-2008-12-195008. - DOI - PMC - PubMed
    1. Kyle RA, Remstein ED, Therneau TM, Dispenzieri A, Kurtin PJ, Hodnefield JM, Larson DR, Plevak MF, Jelinek DF, Fonseca R, et al. (2007). Clinical course and prognosis of smoldering (asymptomatic) multiple myeloma. N Engl J Med 356, 2582–2590. 10.1056/NEJMoa070389. - DOI - PubMed
    1. Mateos MV, Kumar S, Dimopoulos MA, Gonzalez-Calle V, Kastritis E, Hajek R, De Larrea CF, Morgan GJ, Merlini G, Goldschmidt H, et al. (2020). International Myeloma Working Group risk stratification model for smoldering multiple myeloma (SMM). Blood Cancer J 10, 102. 10.1038/s41408-020-00366-3. - DOI - PMC - PubMed
    1. Visram A., Cook J., and Warsame R. (2021). Smoldering multiple myeloma: evolving diagnostic criteria and treatment strategies. Hematology Am Soc Hematol Educ Program 2021, 673–681. 10.1182/hematology.2021000304. - DOI - PMC - PubMed
    1. Mateos MV, Hernandez MT, Giraldo P, de la Rubia J, de Arriba F, Lopez Corral L, Rosinol L, Paiva B, Palomera L, Bargay J, et al. (2013). Lenalidomide plus dexamethasone for high-risk smoldering multiple myeloma. N Engl J Med 369, 438–447. 10.1056/NEJMoa1300439. - DOI - PubMed

Publication types