. 2022 Dec 13;55(12):2318-2335.e7.
doi: 10.1016/j.immuni.2022.10.018. Epub 2022 Nov 14.

Neuronal signal-regulatory protein alpha drives microglial phagocytosis by limiting microglial interaction with CD47 in the retina

Affiliations

Neuronal signal-regulatory protein alpha drives microglial phagocytosis by limiting microglial interaction with CD47 in the retina

Danye Jiang et al. Immunity. .

Abstract

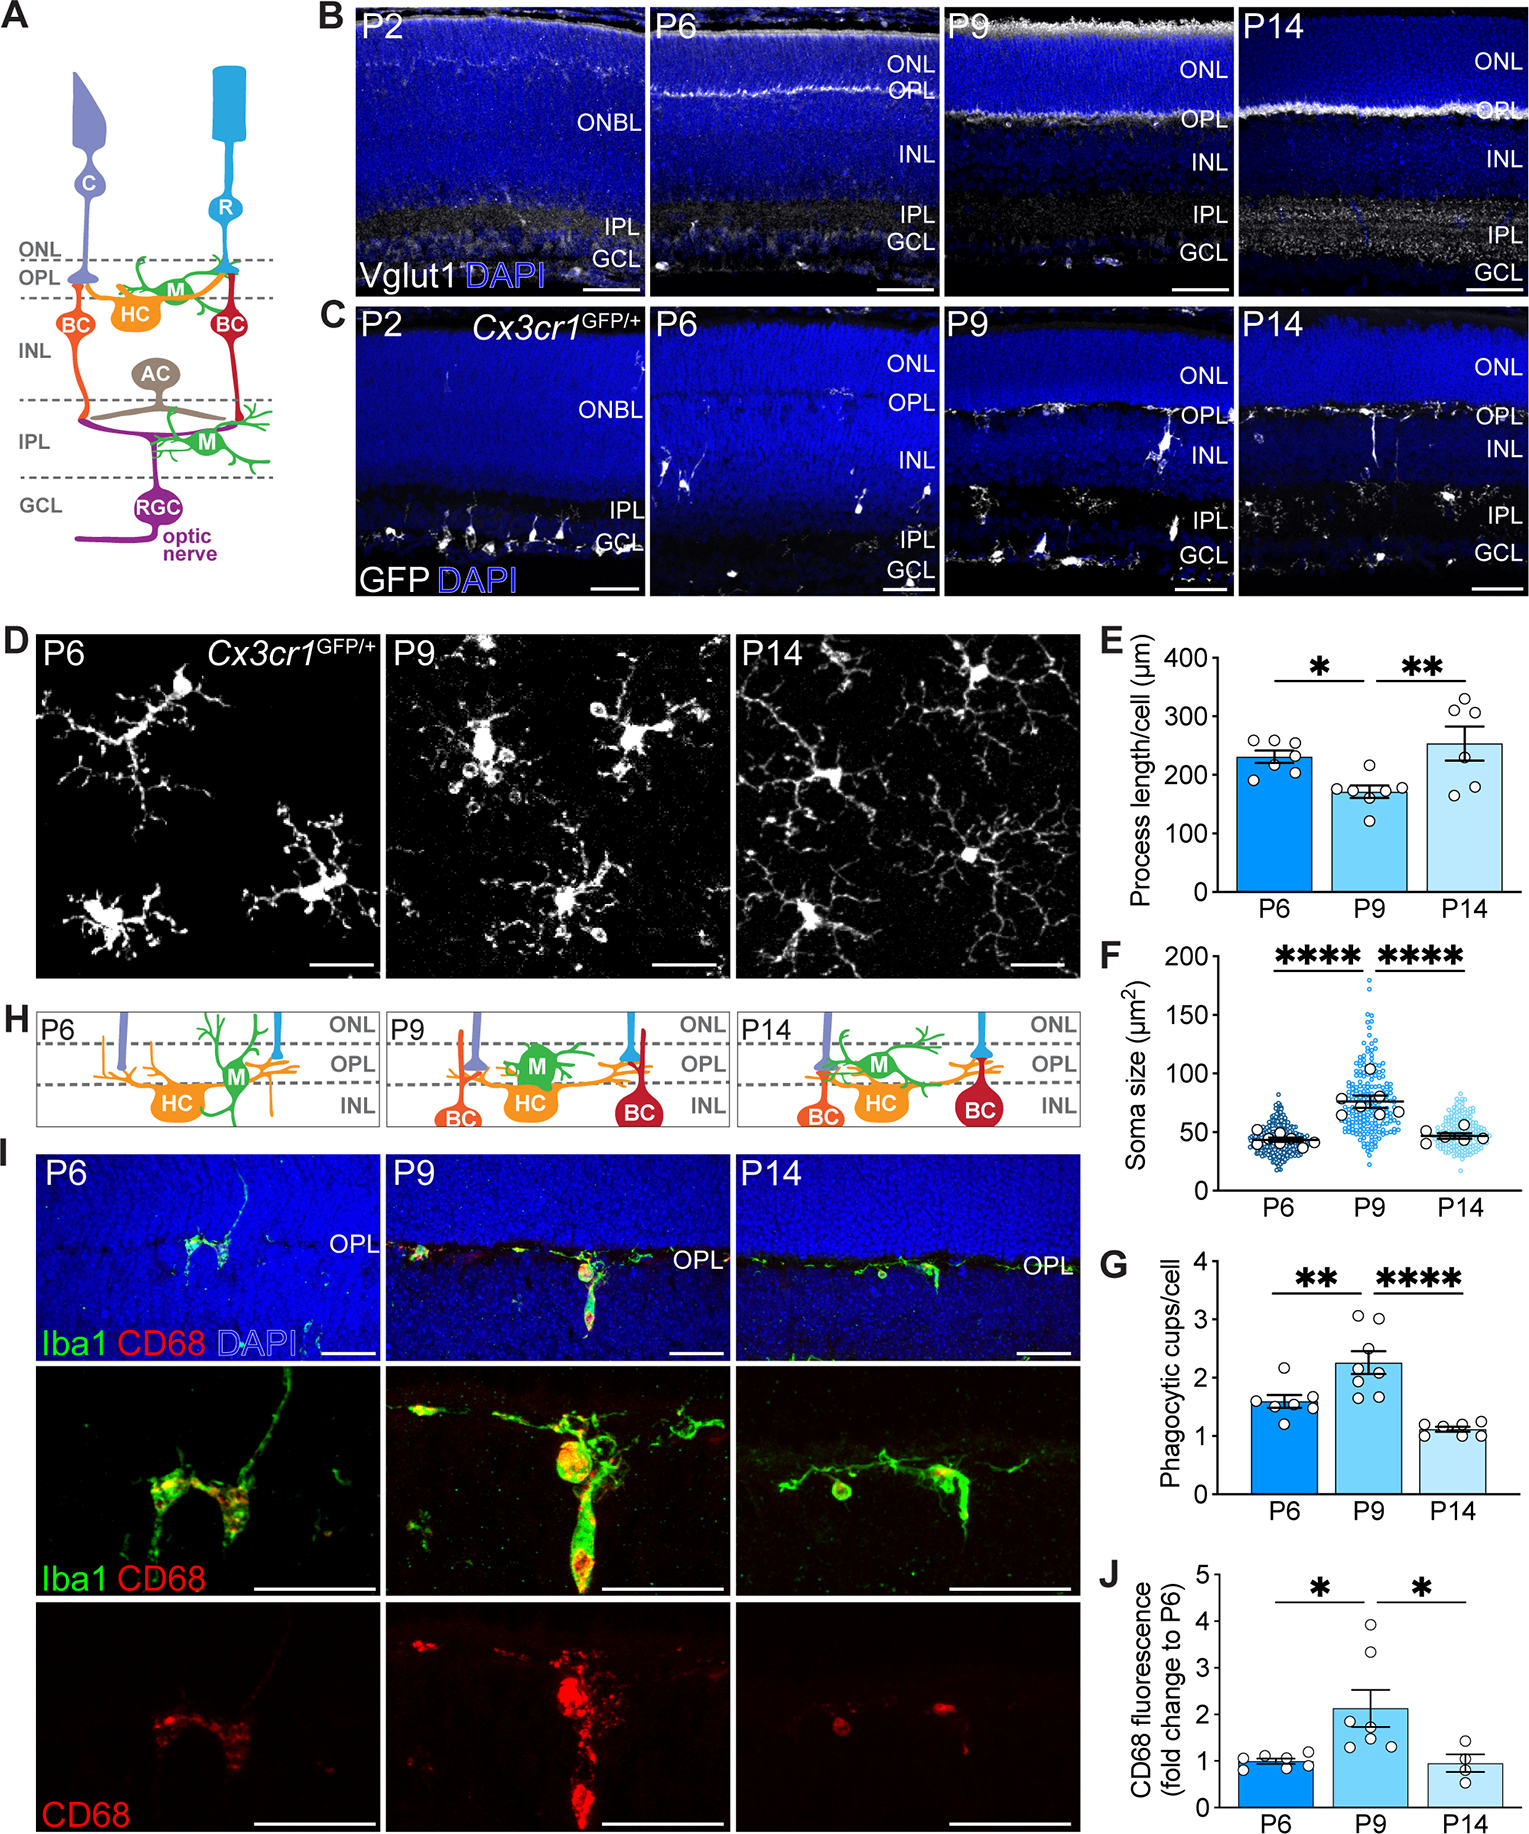
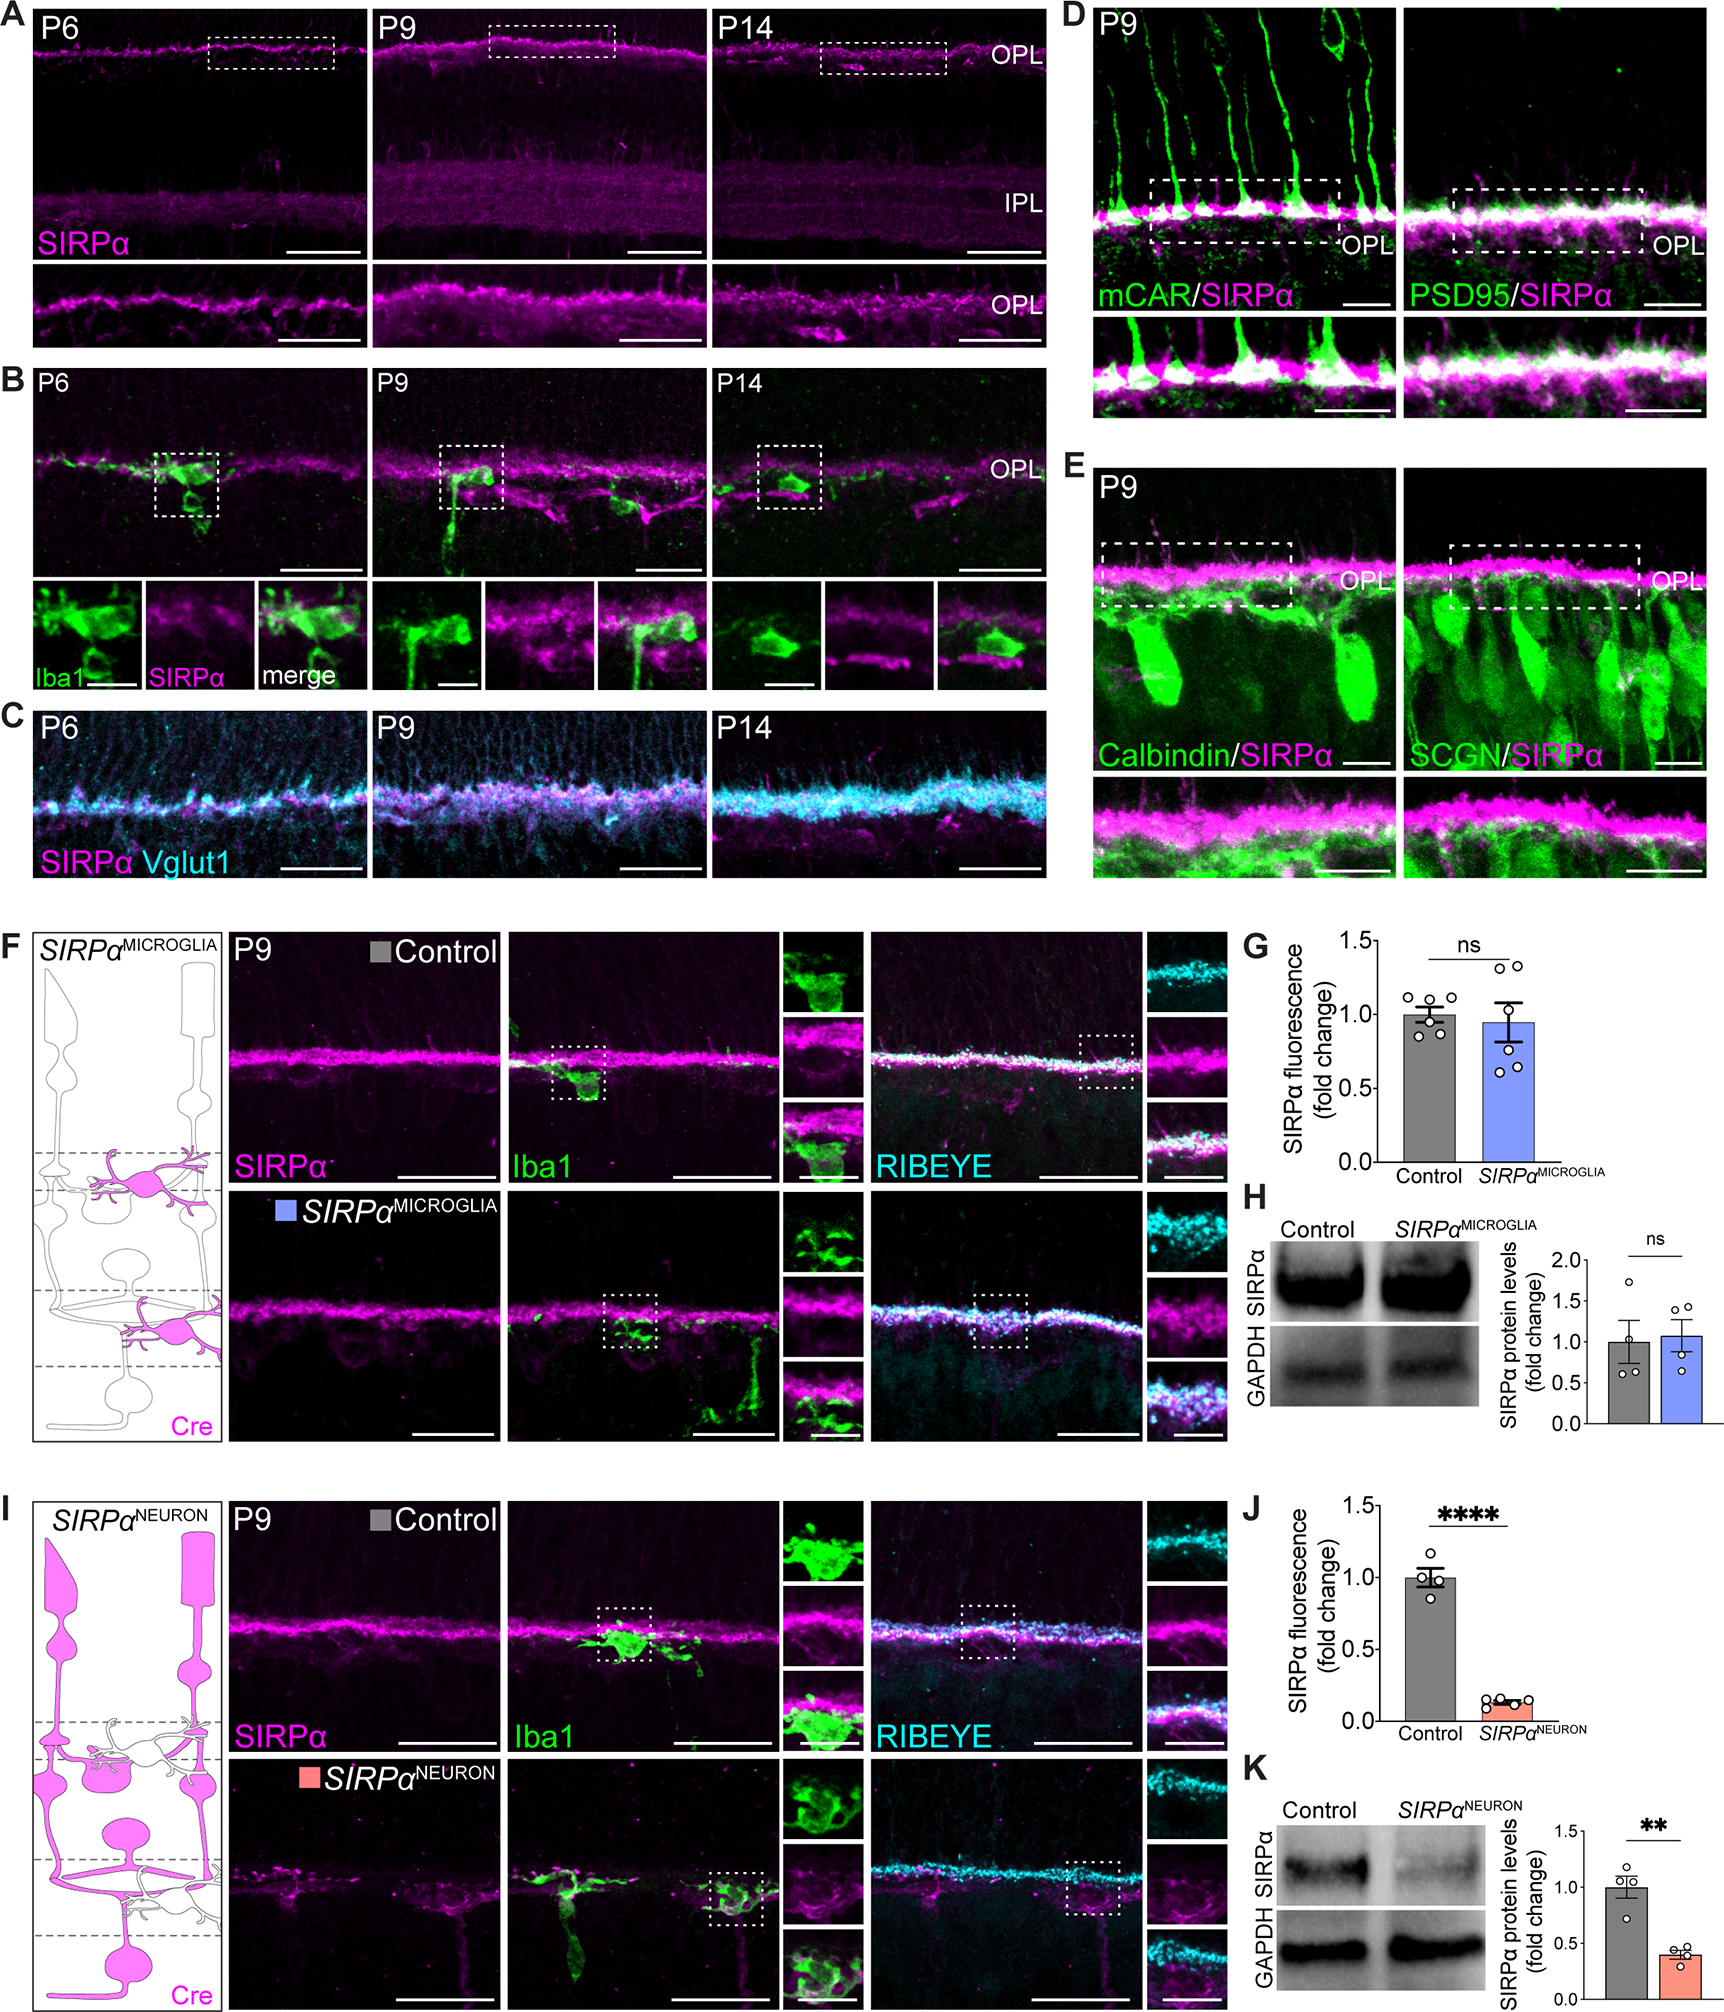
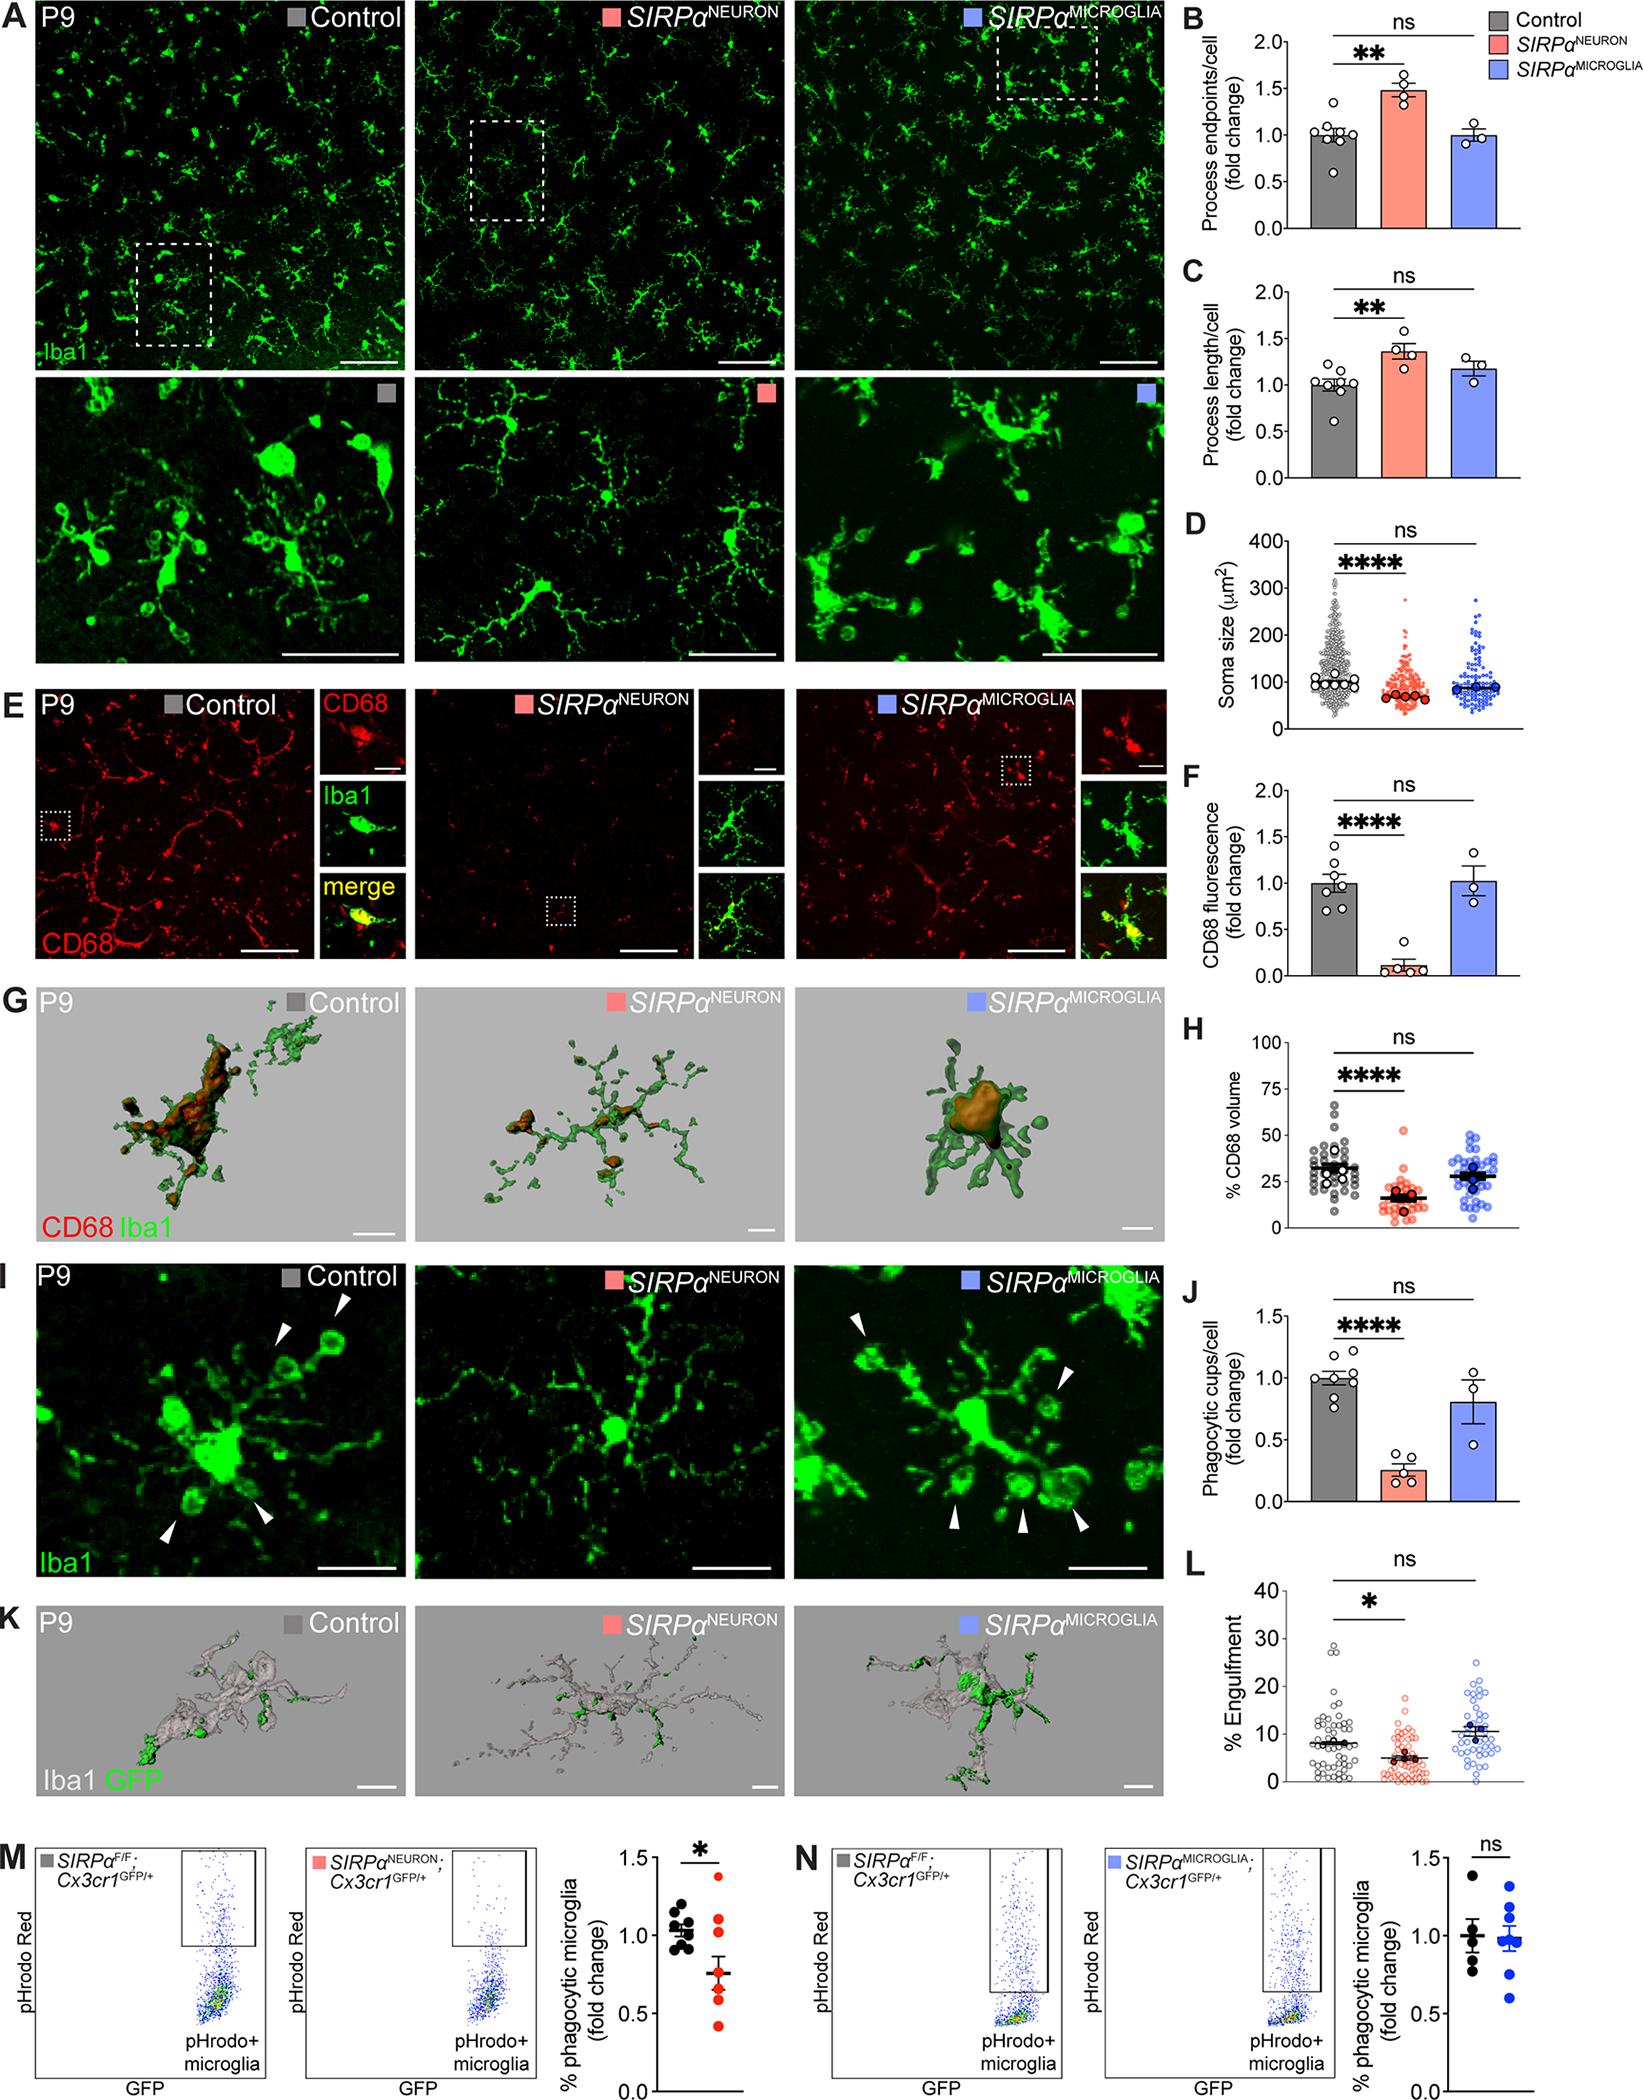
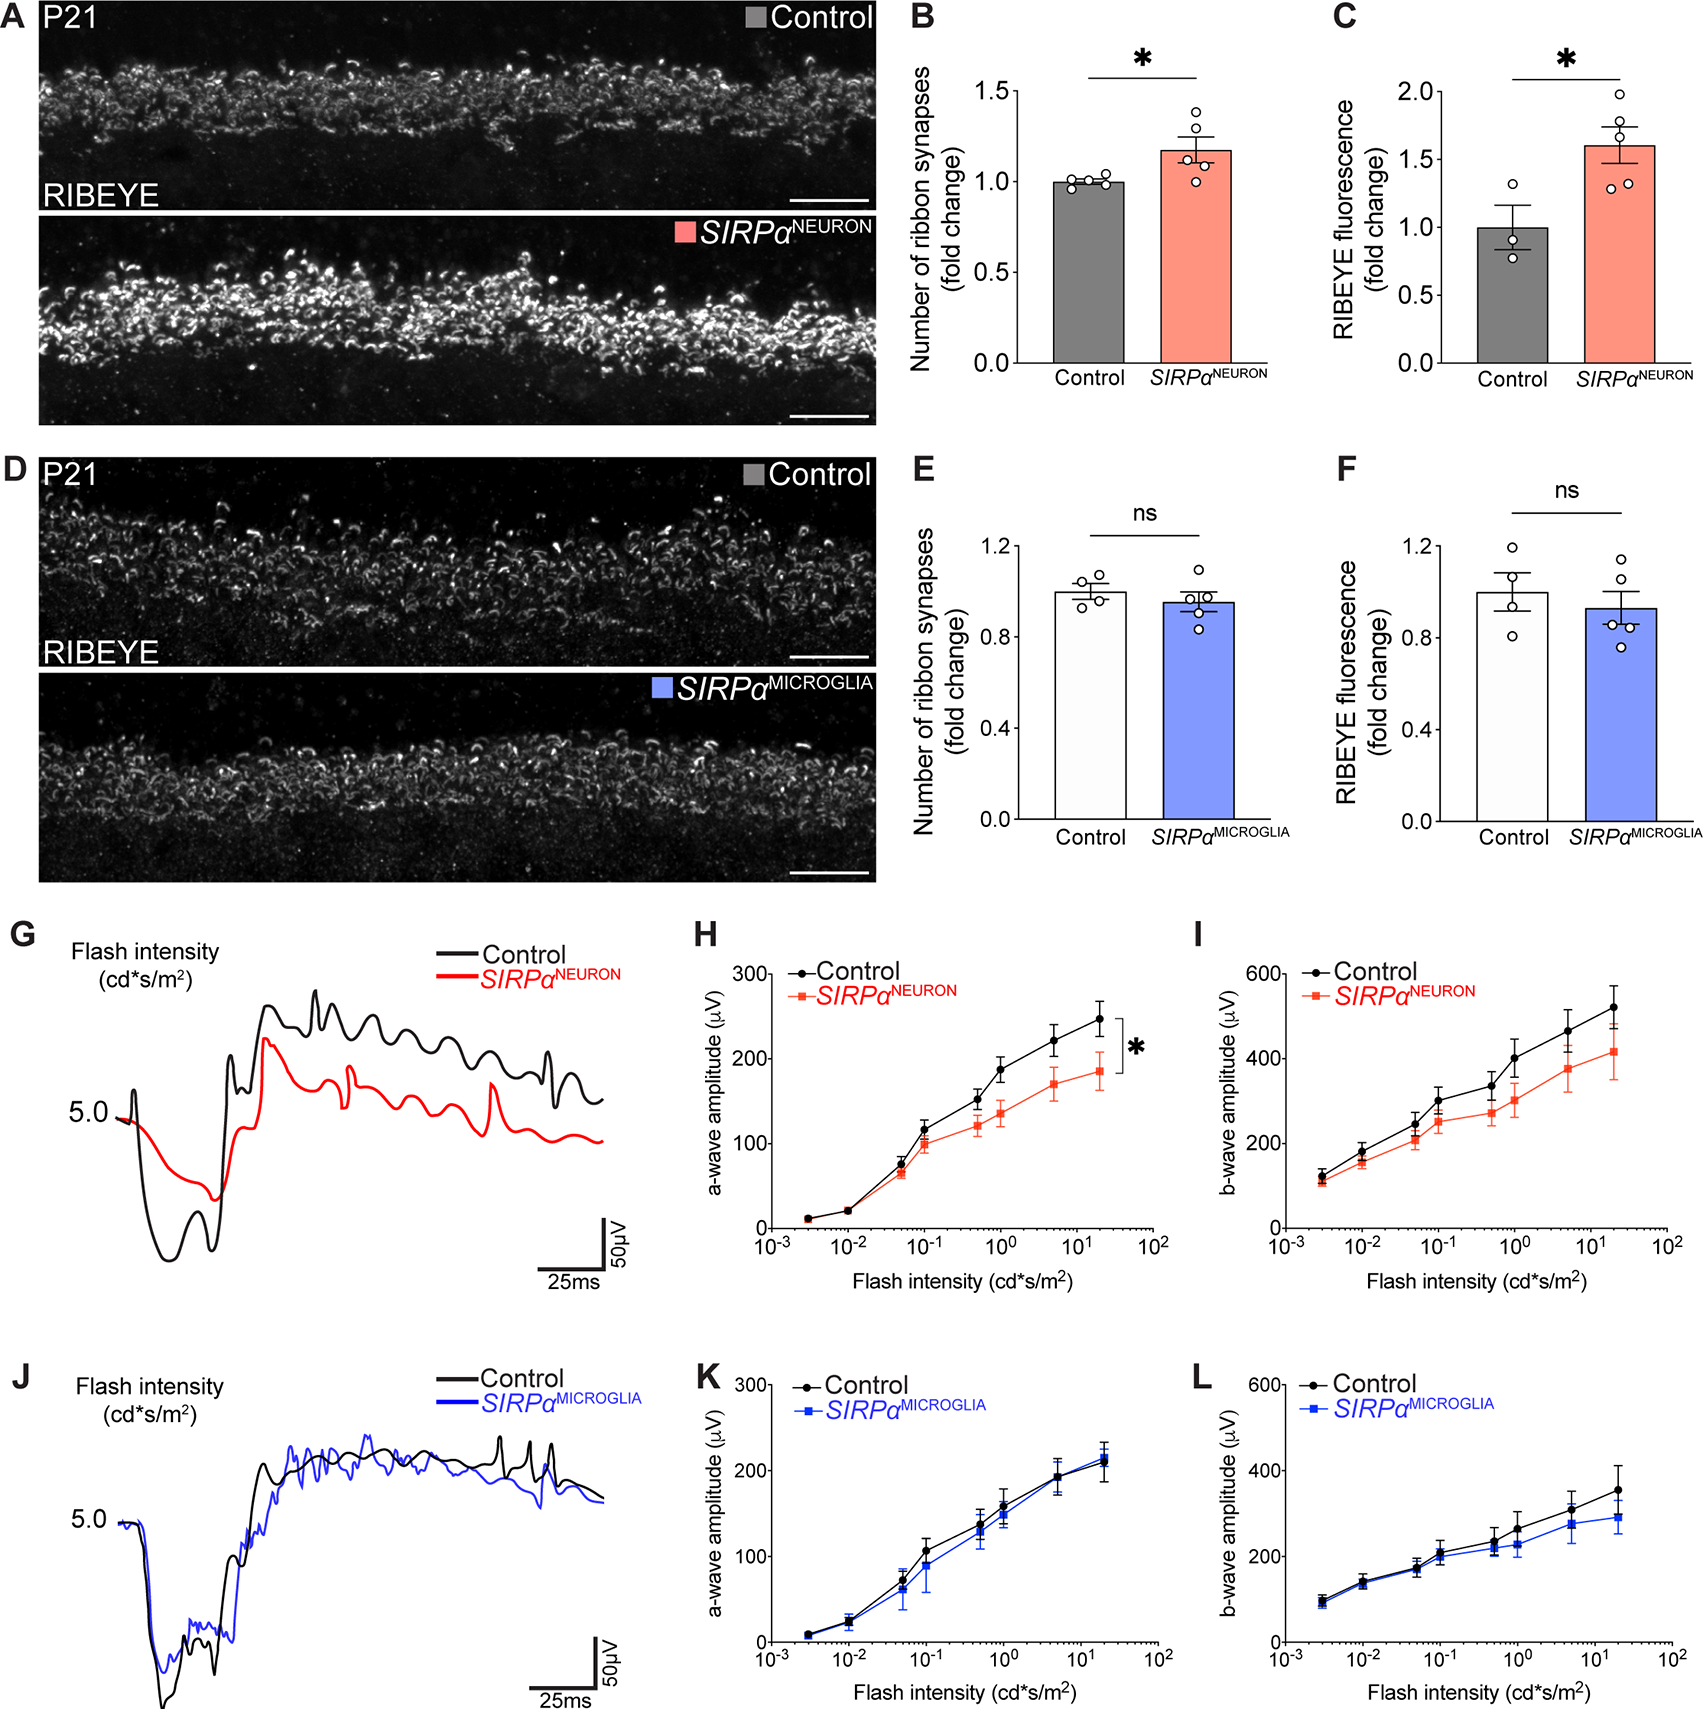
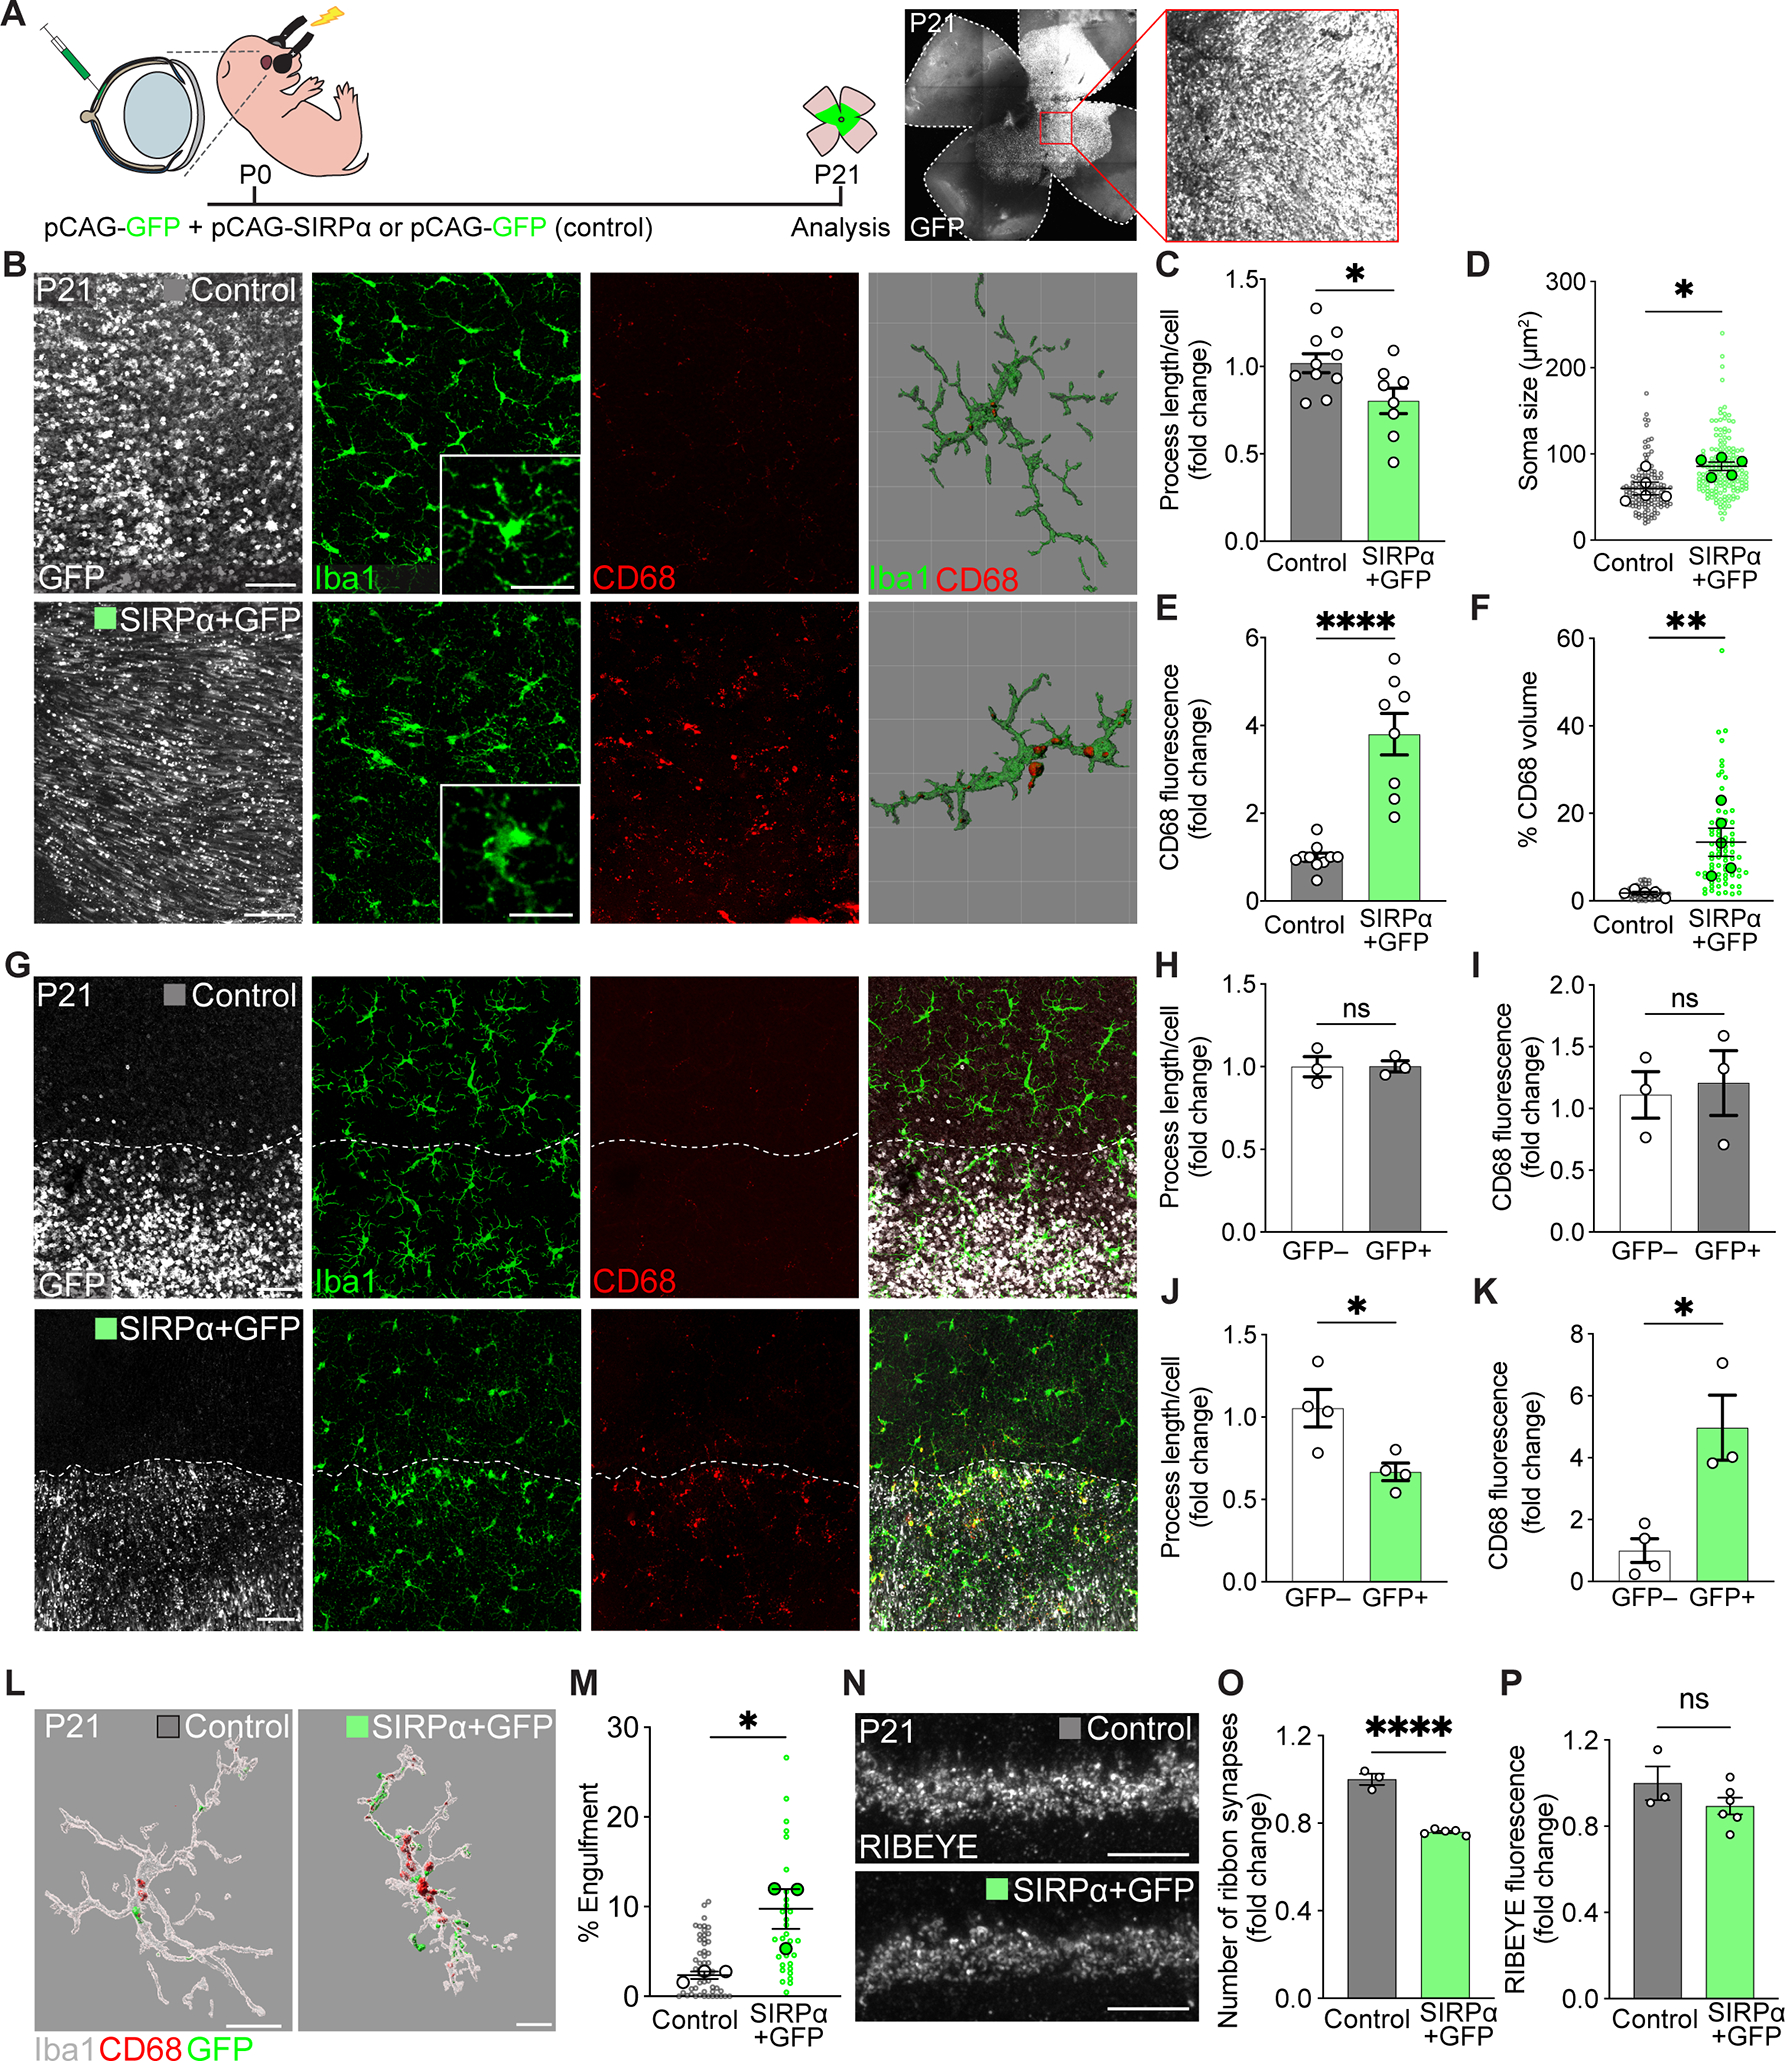
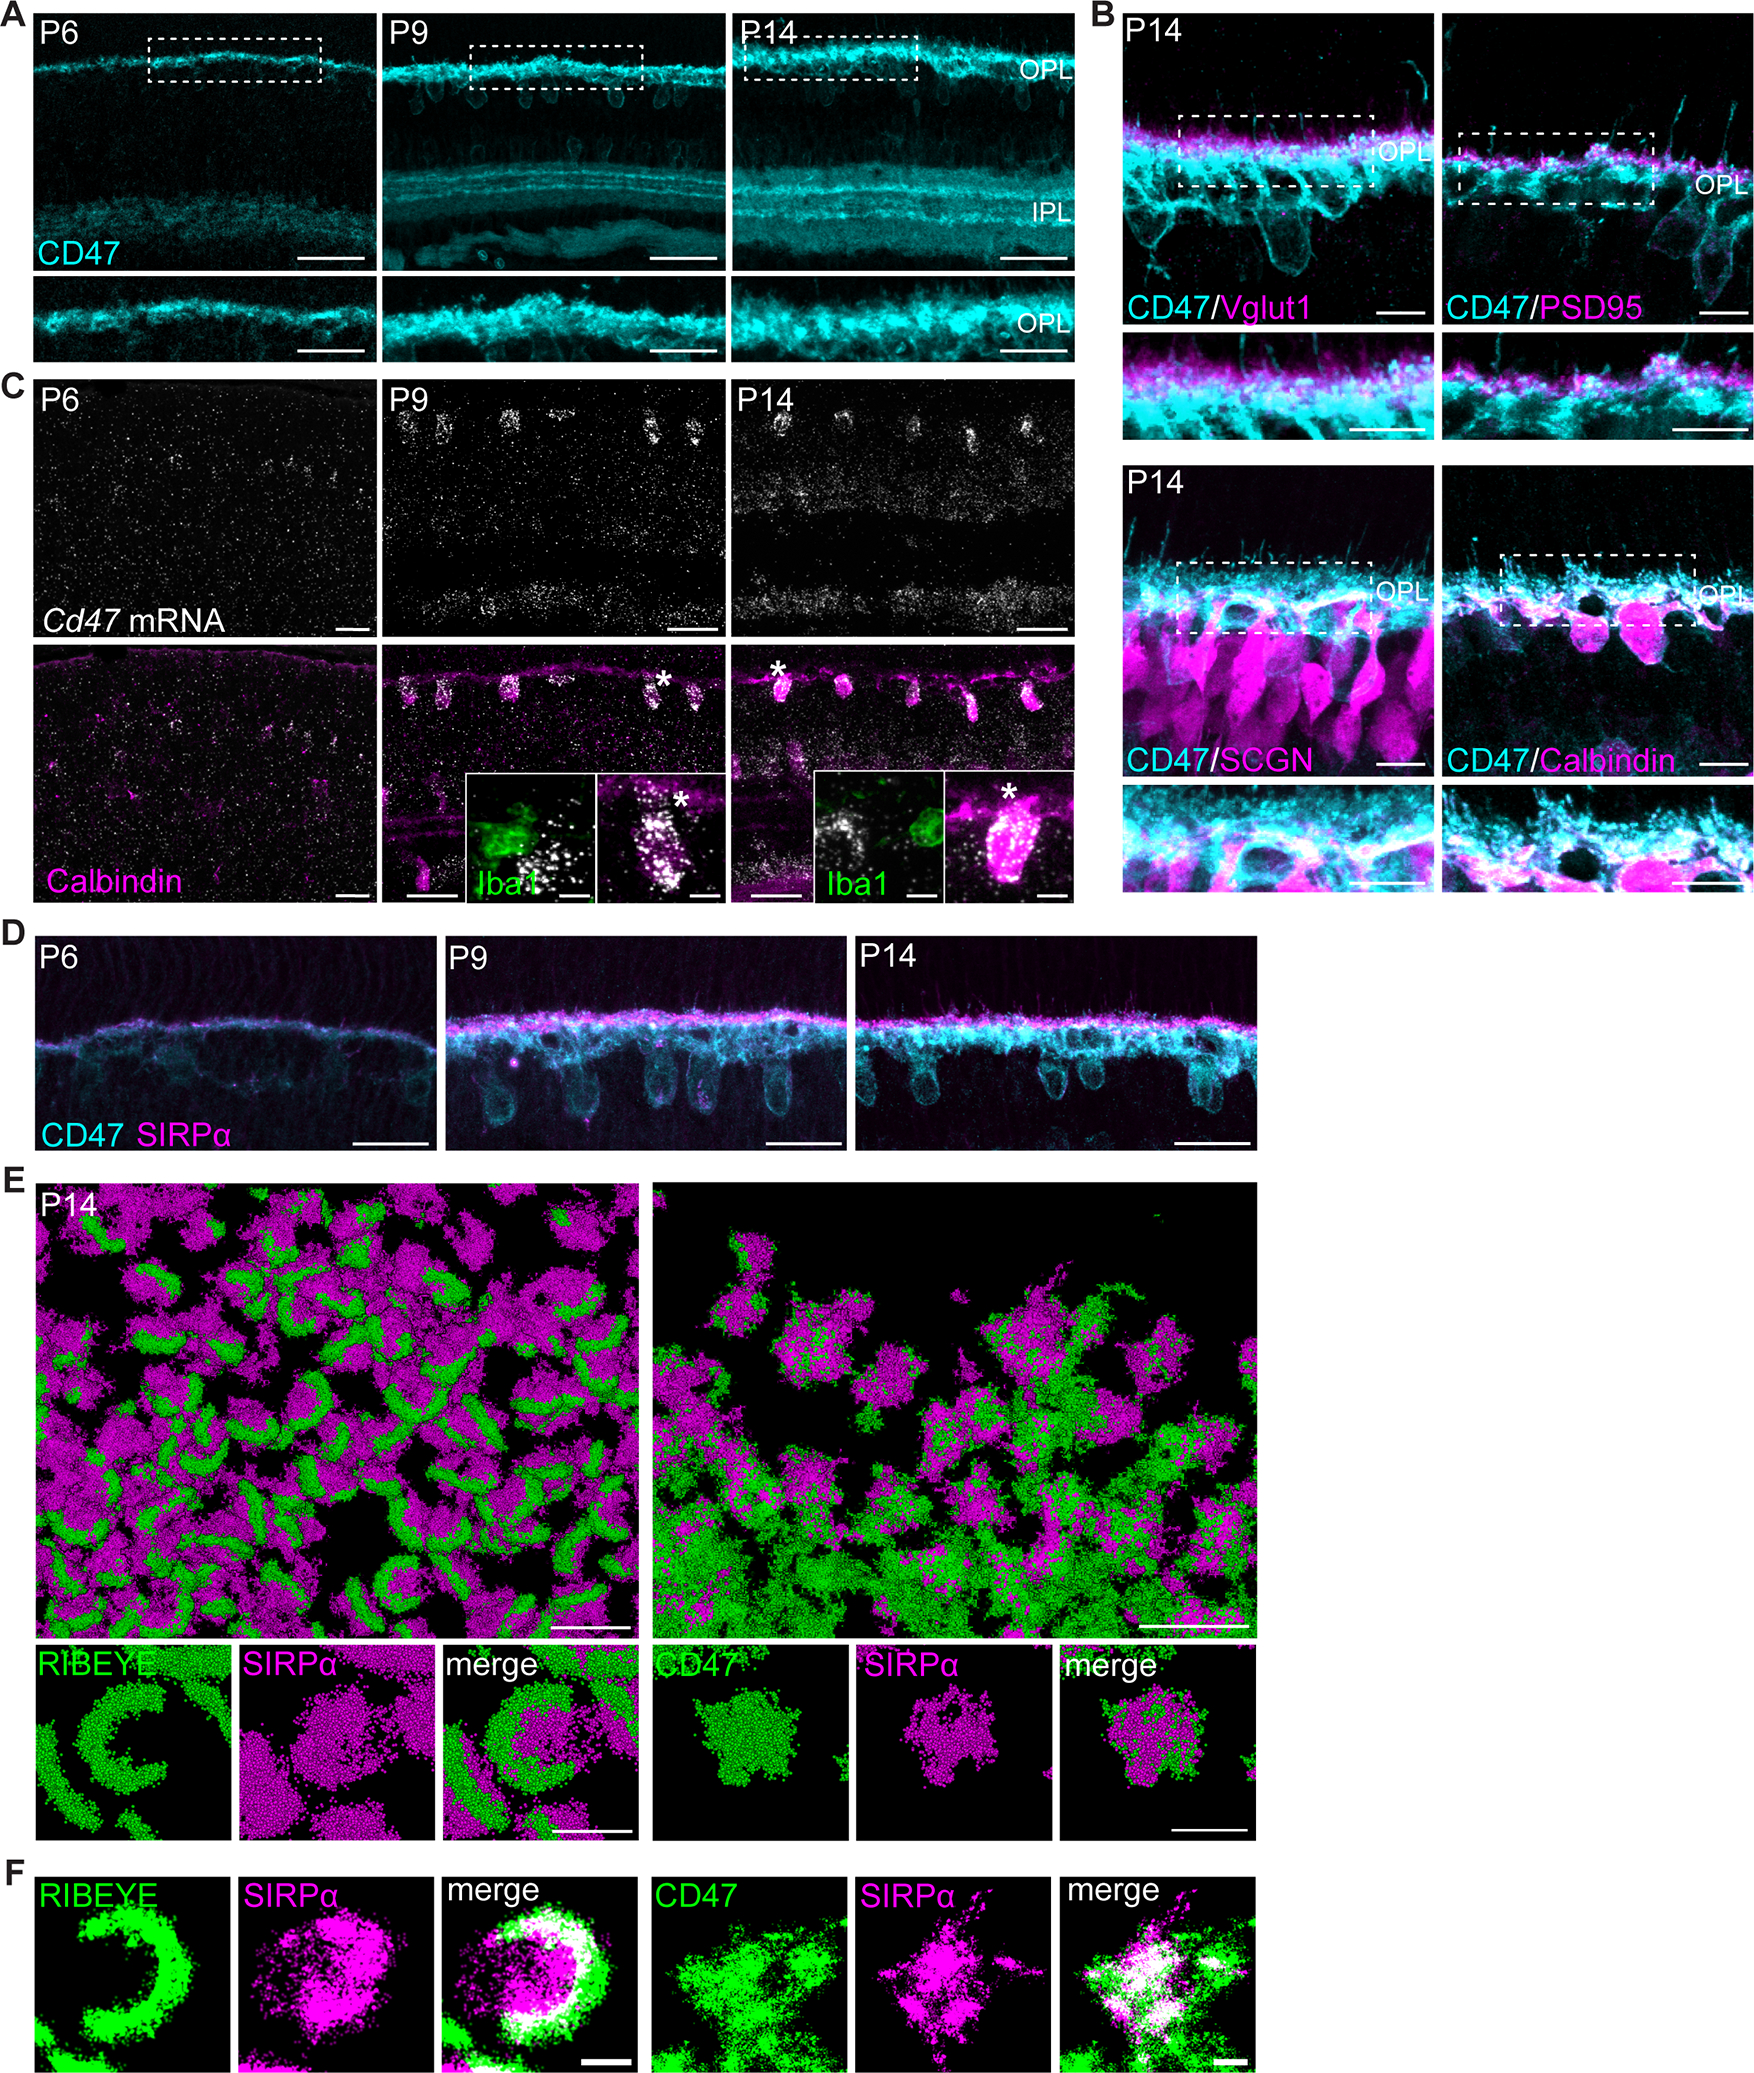
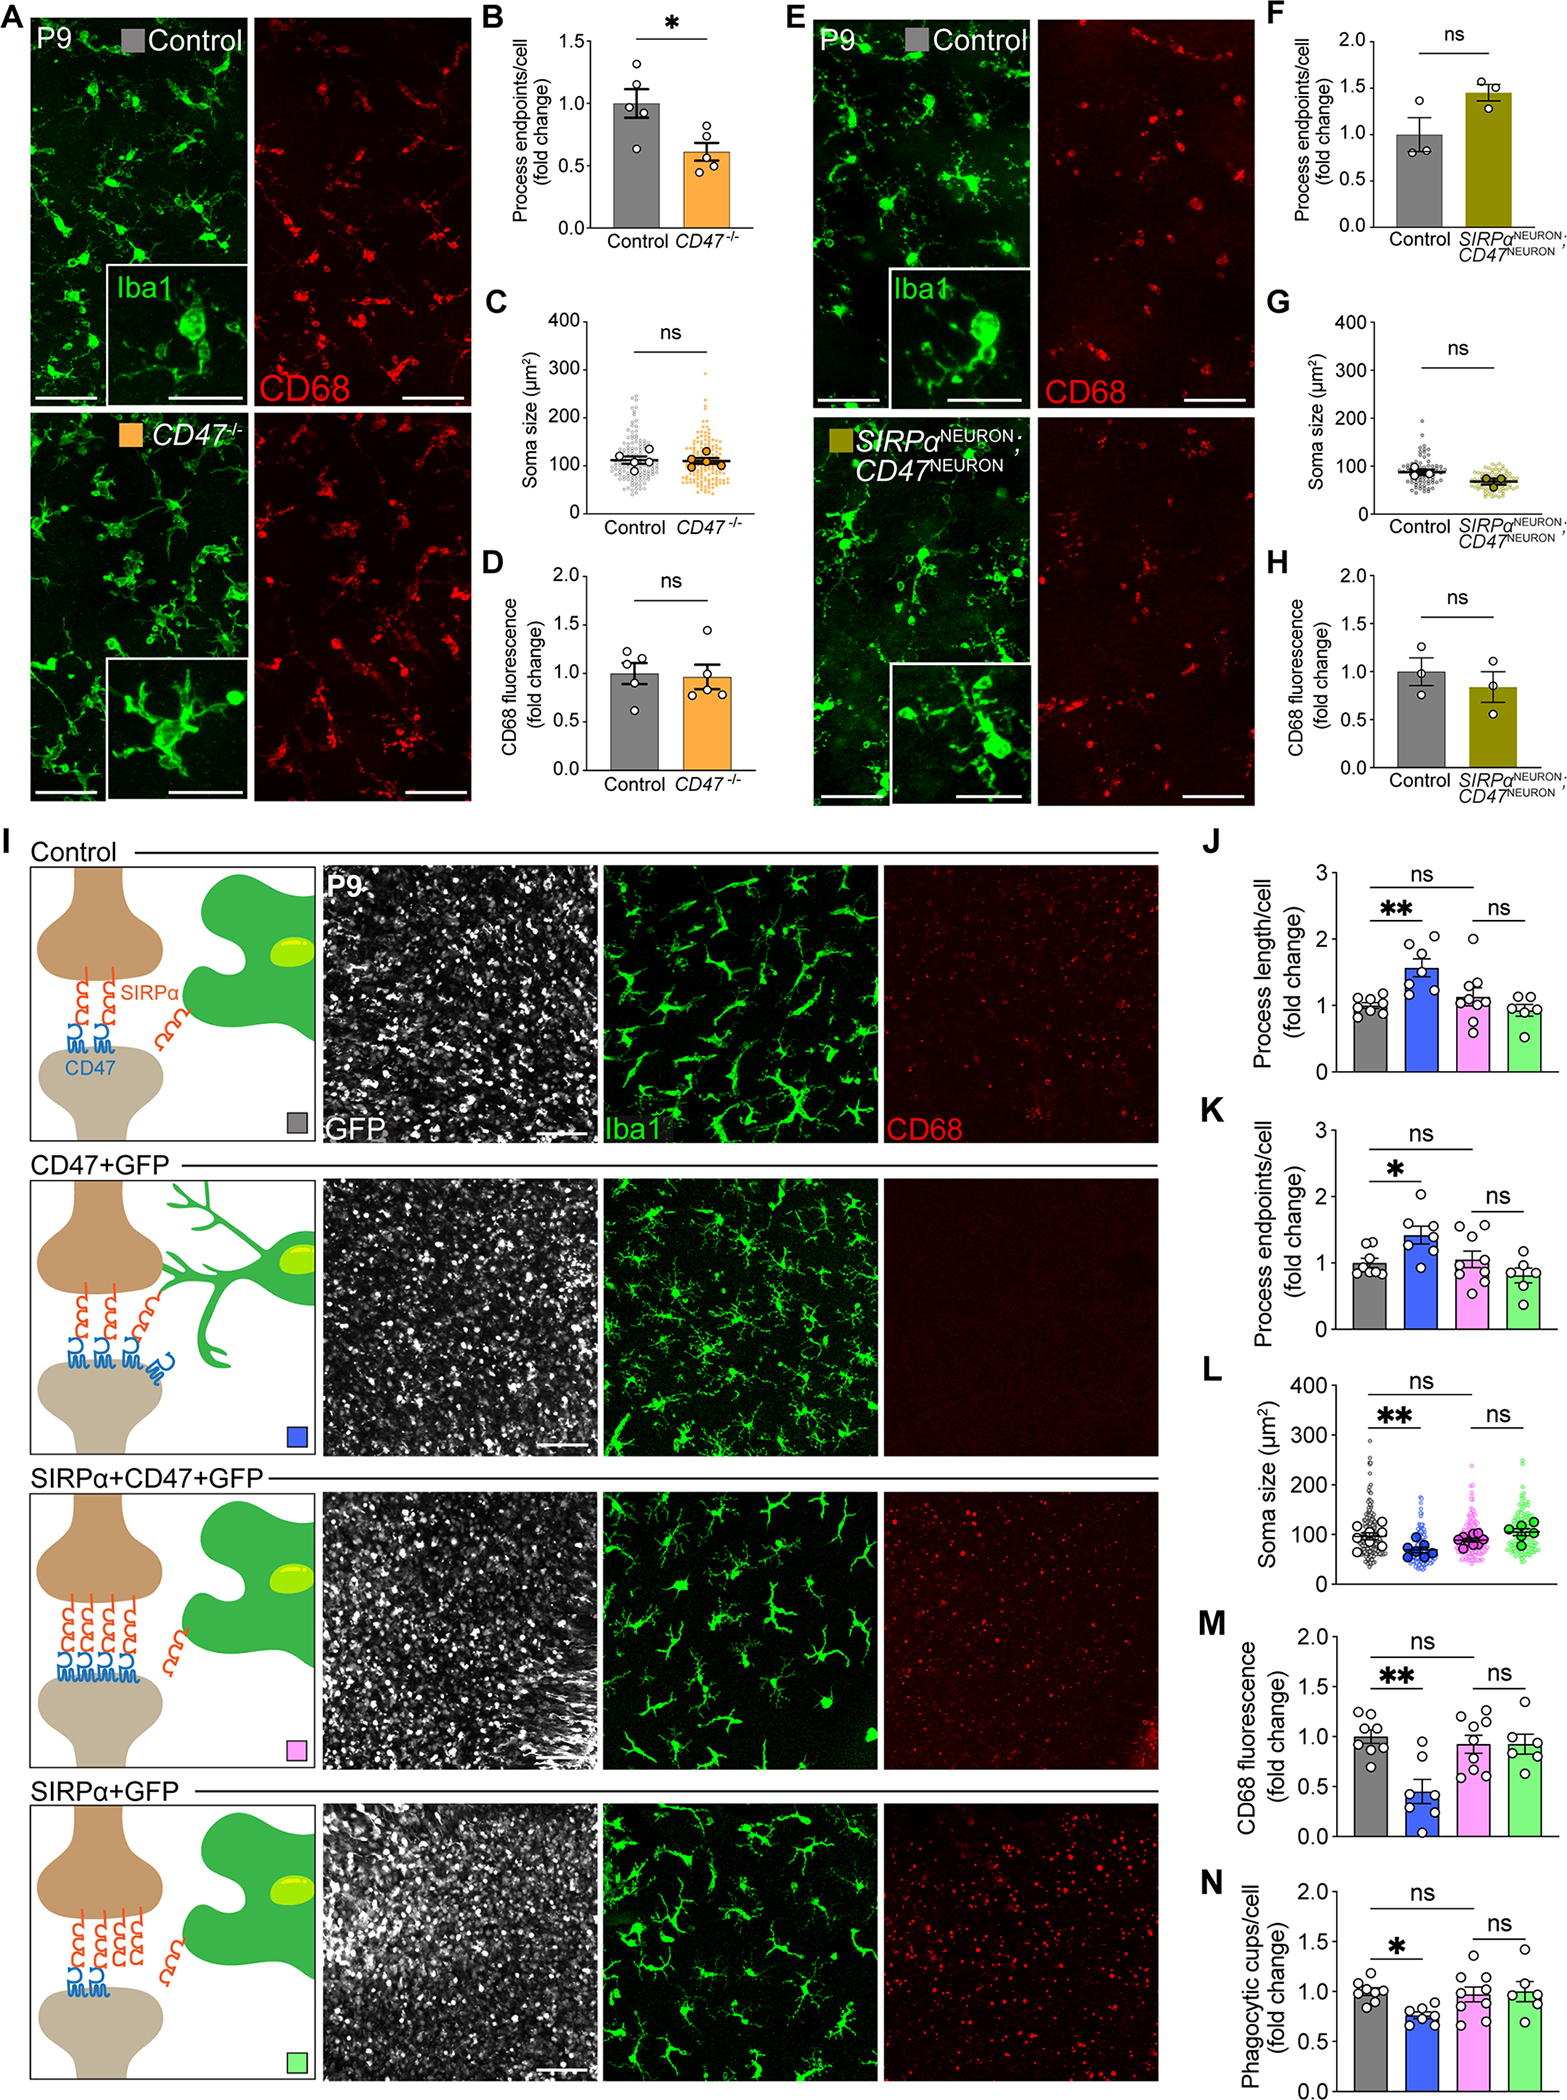
Microglia utilize their phagocytic activity to prune redundant synapses and refine neural circuits during precise developmental periods. However, the neuronal signals that control this phagocytic clockwork remain largely undefined. Here, we show that neuronal signal-regulatory protein alpha (SIRPα) is a permissive cue for microglial phagocytosis in the developing murine retina. Removal of neuronal, but not microglial, SIRPα reduced microglial phagocytosis, increased synpase numbers, and impaired circuit function. Conversely, prolonging neuronal SIRPα expression extended developmental microglial phagocytosis. These outcomes depended on the interaction of presynaptic SIRPα with postsynaptic CD47. Global CD47 deficiency modestly increased microglial phagocytosis, while CD47 overexpression reduced it. This effect was rescued by coexpression of neuronal SIRPα or codeletion of neuronal SIRPα and CD47. These data indicate that neuronal SIRPα regulates microglial phagocytosis by limiting microglial SIRPα access to neuronal CD47. This discovery may aid our understanding of synapse loss in neurological diseases.

Keywords: SIRPα; microglia; retina; synapse refinement.


Conflict of interest statement

Declaration of interests The authors declare no competing interests.

Figures

Figure 1.
Figure 1.. Retinal neuron refinement coincided with heightened microglia phagocytosis.
(A) Schematic of adult retina. Rods (R) and cones (C) in the outer nuclear layer (ONL) synapse onto bipolar cells (BC) and horizontal cells (HC) in the inner nuclear layer (INL), forming a thin synaptic band called outer plexiform layer (OPL). Bipolar cells and amacrine cells (AC) relay signals to retinal ganglion cells (RGC) in the inner plexiform layer (IPL). RGCs reside in the ganglion cell layer (GCL), and their axons form the optic nerve which projects to the brain. Microglia (M) occupy the synaptic layers. (B) Generation of retinal synaptic layers. Vglut1-labeled inner retina synapses (white) were present at P2. At P5-P6, Vglut1+ photoreceptor terminals were visible in the OPL. At P9, both layers continued to be refined. Synaptogenesis largely completed by P14. Scale bars, 50 μm. (C) Microglia (white) migration to the synaptic layers. Scale bars, 50 μm. (D) Representative wholemount images of P6, P9, and P14 OPL microglia in Cx3cr1GFP/+ mice. Scale bars, 25 μm. (E-G) Developmental time course of wildtype (WT) microglial morphology. Quantifications of process length (E), process endpoints (F), and number of phagocytic cups per microglia (G). n=7 for P6, n=7 for P9, n=6 for P14. Data were compared using one-way ANOVA with posthoc Bonferroni correction. (H) Schematic of OPL synaptogenesis. (I) Representative retinal cross-sections showing WT P6, P9, and P14 Iba1+ OPL microglia (green), CD68+ lysosomes (red), and merge (yellow). Scale bars, 25 μm. (J) Quantification depicting the percentages of P6, P9, and P14 WT CD68+ microglia. n=7 for P6, n=7 for P9, and n=4 for P14. Data were compared using one-way ANOVA with posthoc Bonferroni correction. Data from (E) to (J) were pooled from two independent experiments. All data are shown as the mean ± SEM. *p<0.05, **p<0.01, ****p<0.0001. See also Figure S1.
Figure 2.
Figure 2.. Neuronal SIRPα was enriched during periods of peak microglia phagocytosis.
(A) Representative images showing P6, P9, and P14 WT SIRPα staining (magenta) in the synaptic layers. Scale bars, 50 μm (top) and 25 μm (bottom). See also Figure S2A–B. (B) Representative images showing little SIRPα signal in Iba1+ microglia (green). Scale bars, 25 μm and 10 μm (insets). See also Figure S2C. (C) Representative images showing colocalization of SIRPα (magenta) and Vglut1+ photoreceptor terminals (cyan) in the OPL. Scale bars, 25 μm. See also Figure S2C. (D) Representative images showing colocalization of SIRPα (magenta) with cone (mCAR) and rod (PSD95) terminals (green). Scale bars, 10 μm. See also Figure S2D. (E) Representative images showing SIRPα (magenta) with horizontal cell (Calbindin) and cone bipolar cell (SCGN) terminals (green). Scale bars, 10 μm. See also Figure S2D. (F) Schematic of microglial SIRPα deficiency model (SIRPαMICROGLIA). Example images showing staining of SIRPα (magenta), microglia (Iba1, green), and OPL synapses (RIBEYE, cyan) in this model at P9. Scale bars, 25 μm and 10 μm (insets). See also Figure S2F. (G) Levels of SIRPα fluorescence in OPL in SIRPαMICROGLIA relative to controls, n=6 per group. Data were compared using an unpaired t-test. (H) Representative immunoblot image and quantification of SIRPα in whole retina from P9 WT and SIRPαMICROGLIA mice. n=3 per group. Data were compared using an unpaired t-test. (I) Schematic of neuronal SIRPα deficiency model (SIRPαNEURON). Example images showing staining of SIRPα (magenta), microglia (Iba1, green), and OPL synapses (RIBEYE, cyan) in this model at P9. Scale bars, 25 μm and 10 μm (insets). See Figure S2F. (J) Levels of SIRPα fluorescence in OPL in SIRPαNEURON mice relative to controls, n=4 control and 5 SIRPαNEURON. Data were compared using an unpaired t-test. (K) Representative immunoblot image and quantification of SIRPα in whole retina from P9 WT and SIRPαNEURON. n=3 per group. Data were compared using an unpaired t-test. Data from (H) and (K) were obtained from one experiment. (G) and (J) were pooled from two independent experiments. All data are presented as the mean ± SEM. **p<0.01, ****p<0.0001, ns, not significant. See also Figures S2–3.
Figure 3.
Figure 3.. Microglia phagocytosis was impaired in neuronal SIRPα-deficient mice.
(A) Representative images of control, SIRPαNEURON, and SIRPαMICROGLIA OPL microglia at P9. Scale bars, 100 μm (top) and 50 μm (below). (B-D) Quantifications of microglia process endpoints (B), process length (C), and soma size (D) in P9 control, SIRPαNEURON, and SIRPαMICROGLIA mice. n=8 control, 4 SIRPαNEURON, and 3 SIRPαMICROGLIA mice, one-way ANOVA with posthoc Bonferroni correction. (E-F) Representative images showing the lysosomal marker CD68 in microglia in P9 control, SIRPαNEURON, and SIRPαMICROGLIA mice. Scale bars, 100 μm and 20 μm (insets). (F) Bar graphs depicting the levels of CD68 staining in control, SIRPαNEURON, and SIRPαMICROGLIA animals. n=8 control, 4 SIRPαNEURON, and 3 SIRPαMICROGLIA, one-way ANOVA with posthoc Bonferroni correction. (G-H) Representative 3D reconstructions of control, SIRPαNEURON, and SIRPαMICROGLIA microglia (green) with internalized CD68+ lysosomes (red). Scale bars, 10 μm. (H) Graph showing percent volume of CD68+ lysosome in microglia from P9 SIRPαNEURON and SIRPαMICROGLIA mice relative to control. n=8 control, 4 SIRPαNEURON, 3 SIRPαMICROGLIA mice, one-way ANOVA with posthoc Bonferroni correction. (I-J) Representative images of phagocytic cups (arrowheads) in control, SIRPαNEURON, and SIRPαMICROGLIA microglia (green). Scale bars, 20 μm. The graphs depict the number of phagocytic cups per microglia (I). Data were compared using two-way ANOVA with posthoc Bonferroni correction. See also Figure S3B. (K-L) Representative 3D reconstructions of control, SIRPαNEURON, and SIRPαMICROGLIA microglia (gray) with internalized GFP+ neuronal material (green). Scale bars, 10 μm. (L) Graph showing percent volume of GFP-labeled neuronal material in microglia from P9 SIRPαNEURON, and SIRPαMICROGLIA mice relative to control. n=3 control, 4 SIRPαNEURON, 3 SIRPαMICROGLIA mice. Data were compared using one-way ANOVA with posthoc Bonferroni correction. (M-N) Flow cytometry gating and quantification of microglial phagocytosis of pHrodo-red-conjugated yeast particles in (M) SIRPαNEURON; Cx3cr1GFP/+ (n=20) and SIRPαF/F; Cx3cr1GFP/+ (n=16) retinas as well as (N) SIRPαMICROGLIA; Cx3cr1GFP/+ (n=16) and SIRPαF/F; Cx3cr1GFP/+ (n-12) retinas at P9. *p<0.05, unpaired t-test. See also Figure S3D–E. Data from (B) to (J) were obtained from one experiment. Data in (L) to (N) were pooled from three independent experiments. All data are presented as the mean ± SEM. *p<0.05, **p<0.01, ****p<0.0001, ns, not significant. See also Figure S3.
Figure 4.
Figure 4.. Neuronal SIRPα was required for synapse refinement and circuit function in the retina.
(A) Representative images of RIBEYE+ OPL ribbon synapses in control and SIRPαNEURON retinas. Scale bars, 10 μm. (B-C) Graphs depicting the number of OPL ribbon synapses (B) and RIBEYE intensity (C) in P9 SIRPαNEURON mice relative to controls. n=5 per group, unpaired t-test. (D) Representative images of RIBEYE-labeled OPL ribbon synapses in control and SIRPαMICROGLIA retinas. Scale bars, 10 μm. (E-F) Graphs depicting the number of OPL ribbon synapses (E) and RIBEYE intensity (F) at P9 in SIRPαMICROGLIA mice relative to controls. n>4 per group, unpaired t-test. (G) Representative traces of scotopic recording from control and SIRPαNEURON mice. (H and I) Quantifications of the amplitudes of the scotopic a-wave and b-wave in control and SIRPαNEURON mice. n=7 per group, paired t-test. (J) Representative traces of scotopic recording from control and SIRPαMICROGLIA mice. (K and L) Quantifications of the amplitudes of the scotopic a-wave and b-wave in control and SIRPαMICROGLIA mice. n=7 per group, paired t-test. Data were obtained from two to three independent experiments. All data are presented as the mean ± SEM. *p<0.05, ns, not significant.
Figure 5.
Figure 5.. Prolonging neuronal SIRPα expression extended microglia phagocytosis.
(A) Schematic illustration of in vivo electroporation. See also Figure S4A. (B) Representative confocal and 3D reconstructed images of GFP-expressing cells (white), Iba1+ microglia (green), and CD68+ lysosomes (red) in control (GFP only) and SIRPα+GFP retinas at P21, viewed in wholemount. Scale bars, 50 μm and 25 μm (insets). See also Figure S4B. (C-D) Quantifications of microglial morphology, including process length (C) and soma size (D), in control and SIRPα+GFP groups. n=10 control, 8 SIRPα+GFP mice, unpaired t-test. (E-F) Quantification of the levels of CD68 staining (E) and internalized CD68+ lysosome volume (F) in SIRPα+GFP versus control groups. n=10 control, 8 SIRPα+GFP mice, unpaired t-test. (G) Representative confocal images showing borders of the electroporated retinal patch (GFP, white, border indicated by the dotted line), microglia (Iba1, green) morphology, and the levels of CD68 staining (red) in control and SIRPα+GFP regions. Scale bars, 50 μm. (H-I) Quantifications of microglia process length (H) and CD68 staining levels (I) inside and outside GFP control transfected regions. n=3 per group, unpaired t-test. (J-K) Quantifications of microglia process length (J) and CD68 staining levels (K) inside and outside SIRPα+GFP transfected regions. n=4 per group, unpaired t-test. (L-M) Representative 3D-reconstructed images of P21 Iba1+ microglia (gray), internalized GFP-labeled neuronal material (green), and CD68+ lysosomes (red) in control and SIRPα+GFP regions (L), and graph showing percent volume of GFP+ material in microglia from these groups (M). Scale bars, 20 μm. n=3 per group, unpaired t-test. (N) Representative images of RIBEYE-labeled OPL ribbon synapses in control and SIRPα+GFP groups. Scale bars, 10 μm. (O-P) Graphs depicting the number of OPL ribbon synapses (O) and RIBEYE intensity (P) in P21 control and SIRPα+GFP groups. n=3 control and 5 SIRPα+GFP mice, unpaired t-test. Data were pooled from at least three independent experiments. All data are presented as the mean ± SEM. *p<0.05, **p<0.01, ****p<0.0001, ns, not significant. See also Figure S4.
Figure 6.
Figure 6.. Neuronal SIRPα was juxtaposed with CD47 at synapses during development.
(A) Representative images showing P6, P9, and P14 WT CD47 staining (cyan) in retinal synaptic layers. Scale bars, 50 μm (top) and 25 μm (bottom). See also Figure S5A. (B) Representative images showing the juxtaposition of CD47 (cyan) with photoreceptor terminals (Vglut1 and PSD95, magenta) as well as colocalization with cone bipolar cell (SCGN) and horizontal cell (Calbindin) terminals (magenta). Scale bars, 10 μm. See also Figure S5B. (C) Representative images of smFISH for Cd47 mRNA(white) combined with IHC for horizontal cell marker Calbindin (magenta) and microglia marker Iba1 (green). Scale bars, 25 μm and 5 μm (insets). See also Figure S5C. (D) Representative images showing CD47 colocalization with SIRPα at P6, P9, and P14 in WT retinas. Scale bars, 25 μm. (E-F) Images showing examples of CD47 colocalization with SIRPα (right) and RIBEYE colocalization with SIRPα (left) in P14 retina using Stochastic Optical Reconstruction Microscopy (STORM). In (F), co-localization between SIRPα and CD47 is depicted in white. Scale bars, 2 μm (top) and 500 nm (bottom). See also Figure S5.
Figure 7.
Figure 7.. Neuronal SIRPα and CD47 functioned together to limit microglial phagocytosis.
(A) Representative images of Iba1+ microglia (green) and CD68+ lysosomes (red) in control and CD47 knockout mice. Scale bars, 50 μm and 25 μm (insets). (B-D) Quantifications of microglial morphology and levels of activation, including process endpoints (B), soma size (C), and levels of CD68 staining (D). n=5 per group, unpaired t-test. See also Figure S6A. (E) Representative images of Iba1+ microglia (green) and CD68+ lysosomes (red) in control and SIRPα/CD47 neuron-specific double knockout mice (SIRPαNEURON; CD47NEURON). Scale bars, 50 μm and 25 μm (insets). (F-H) Quantifications of microglial morphology and levels of activation, including process endpoints (F), soma size (G), and levels of CD68 staining (H). n=3 per group, unpaired t-test. See also Figure S6B. (I) Representative confocal images of GFP-expressing cells (white), Iba1-labeled microglia (green), and CD68+ lysosomes (red) in control (GFP only), CD47+GFP, SIRPα+CD47+GFP, and SIRPα+GFP retinas, viewed in wholemount. Scale bars, 50 μm. (J-N) Quantifications of microglial morphology and CD68 levels, including process length (J), process endpoints (K), soma size (L), levels of CD68 staining (M), and phagocytic cups per cell (N). n=8 control, 9 SIRPα+CD47+GFP, 7 CD47+GFP, and 6 SIRPα+GFP mice, one-way ANOVA with posthoc Bonferroni correction. Data from (F) to (H) were obtained from one experiment. All other data were pooled from two to three independent experiments. All data are presented as the mean ± SEM. *p<0.05, **p<0.01, ns, not significant. See also Figure S6.

References

    1. Adams S, van der Laan LJ, Vernon-Wilson E, Renardel de Lavalette C, Dopp EA, Dijkstra CD, Simmons DL, and van den Berg TK (1998). Signal-regulatory protein is selectively expressed by myeloid and neuronal cells. J Immunol 161, 1853–1859. - PubMed
    1. Albrecht NE, Jiang D, Akhanov V, Hobson R, Speer CM, Robichaux MA, and Samuel MA (2022). Rapid 3D-STORM imaging of diverse molecular targets in tissue. Cell Rep Methods 2, 100253. 10.1016/j.crmeth.2022.100253. - DOI - PMC - PubMed
    1. Altmann C, and Schmidt MHH (2018). The Role of Microglia in Diabetic Retinopathy: Inflammation, Microvasculature Defects and Neurodegeneration. Int J Mol Sci 19. 10.3390/ijms19010110. - DOI - PMC - PubMed
    1. Anderson SR, Roberts JM, Zhang J, Steele MR, Romero CO, Bosco A, and Vetter ML (2019). Developmental Apoptosis Promotes a Disease-Related Gene Signature and Independence from CSF1R Signaling in Retinal Microglia. Cell Rep 27, 2002–2013 e2005. 10.1016/j.celrep.2019.04.062. - DOI - PMC - PubMed
    1. Azcutia V, Bassil R, Herter JM, Engelbertsen D, Newton G, Autio A, Mayadas T, Lichtman AH, Khoury SJ, Parkos CA, et al. (2017). Defects in CD4+ T cell LFA-1 integrin-dependent adhesion and proliferation protect Cd47−/− mice from EAE. J Leukoc Biol 101, 493–505. 10.1189/jlb.3A1215-546RR. - DOI - PMC - PubMed

Publication types