. 2023 Jan 18;111(2):220-235.e9.
doi: 10.1016/j.neuron.2022.10.031. Epub 2022 Nov 14.

The miR-124-AMPAR pathway connects polygenic risks with behavioral changes shared between schizophrenia and bipolar disorder

Affiliations

The miR-124-AMPAR pathway connects polygenic risks with behavioral changes shared between schizophrenia and bipolar disorder

Ho Namkung et al. Neuron. .

Abstract

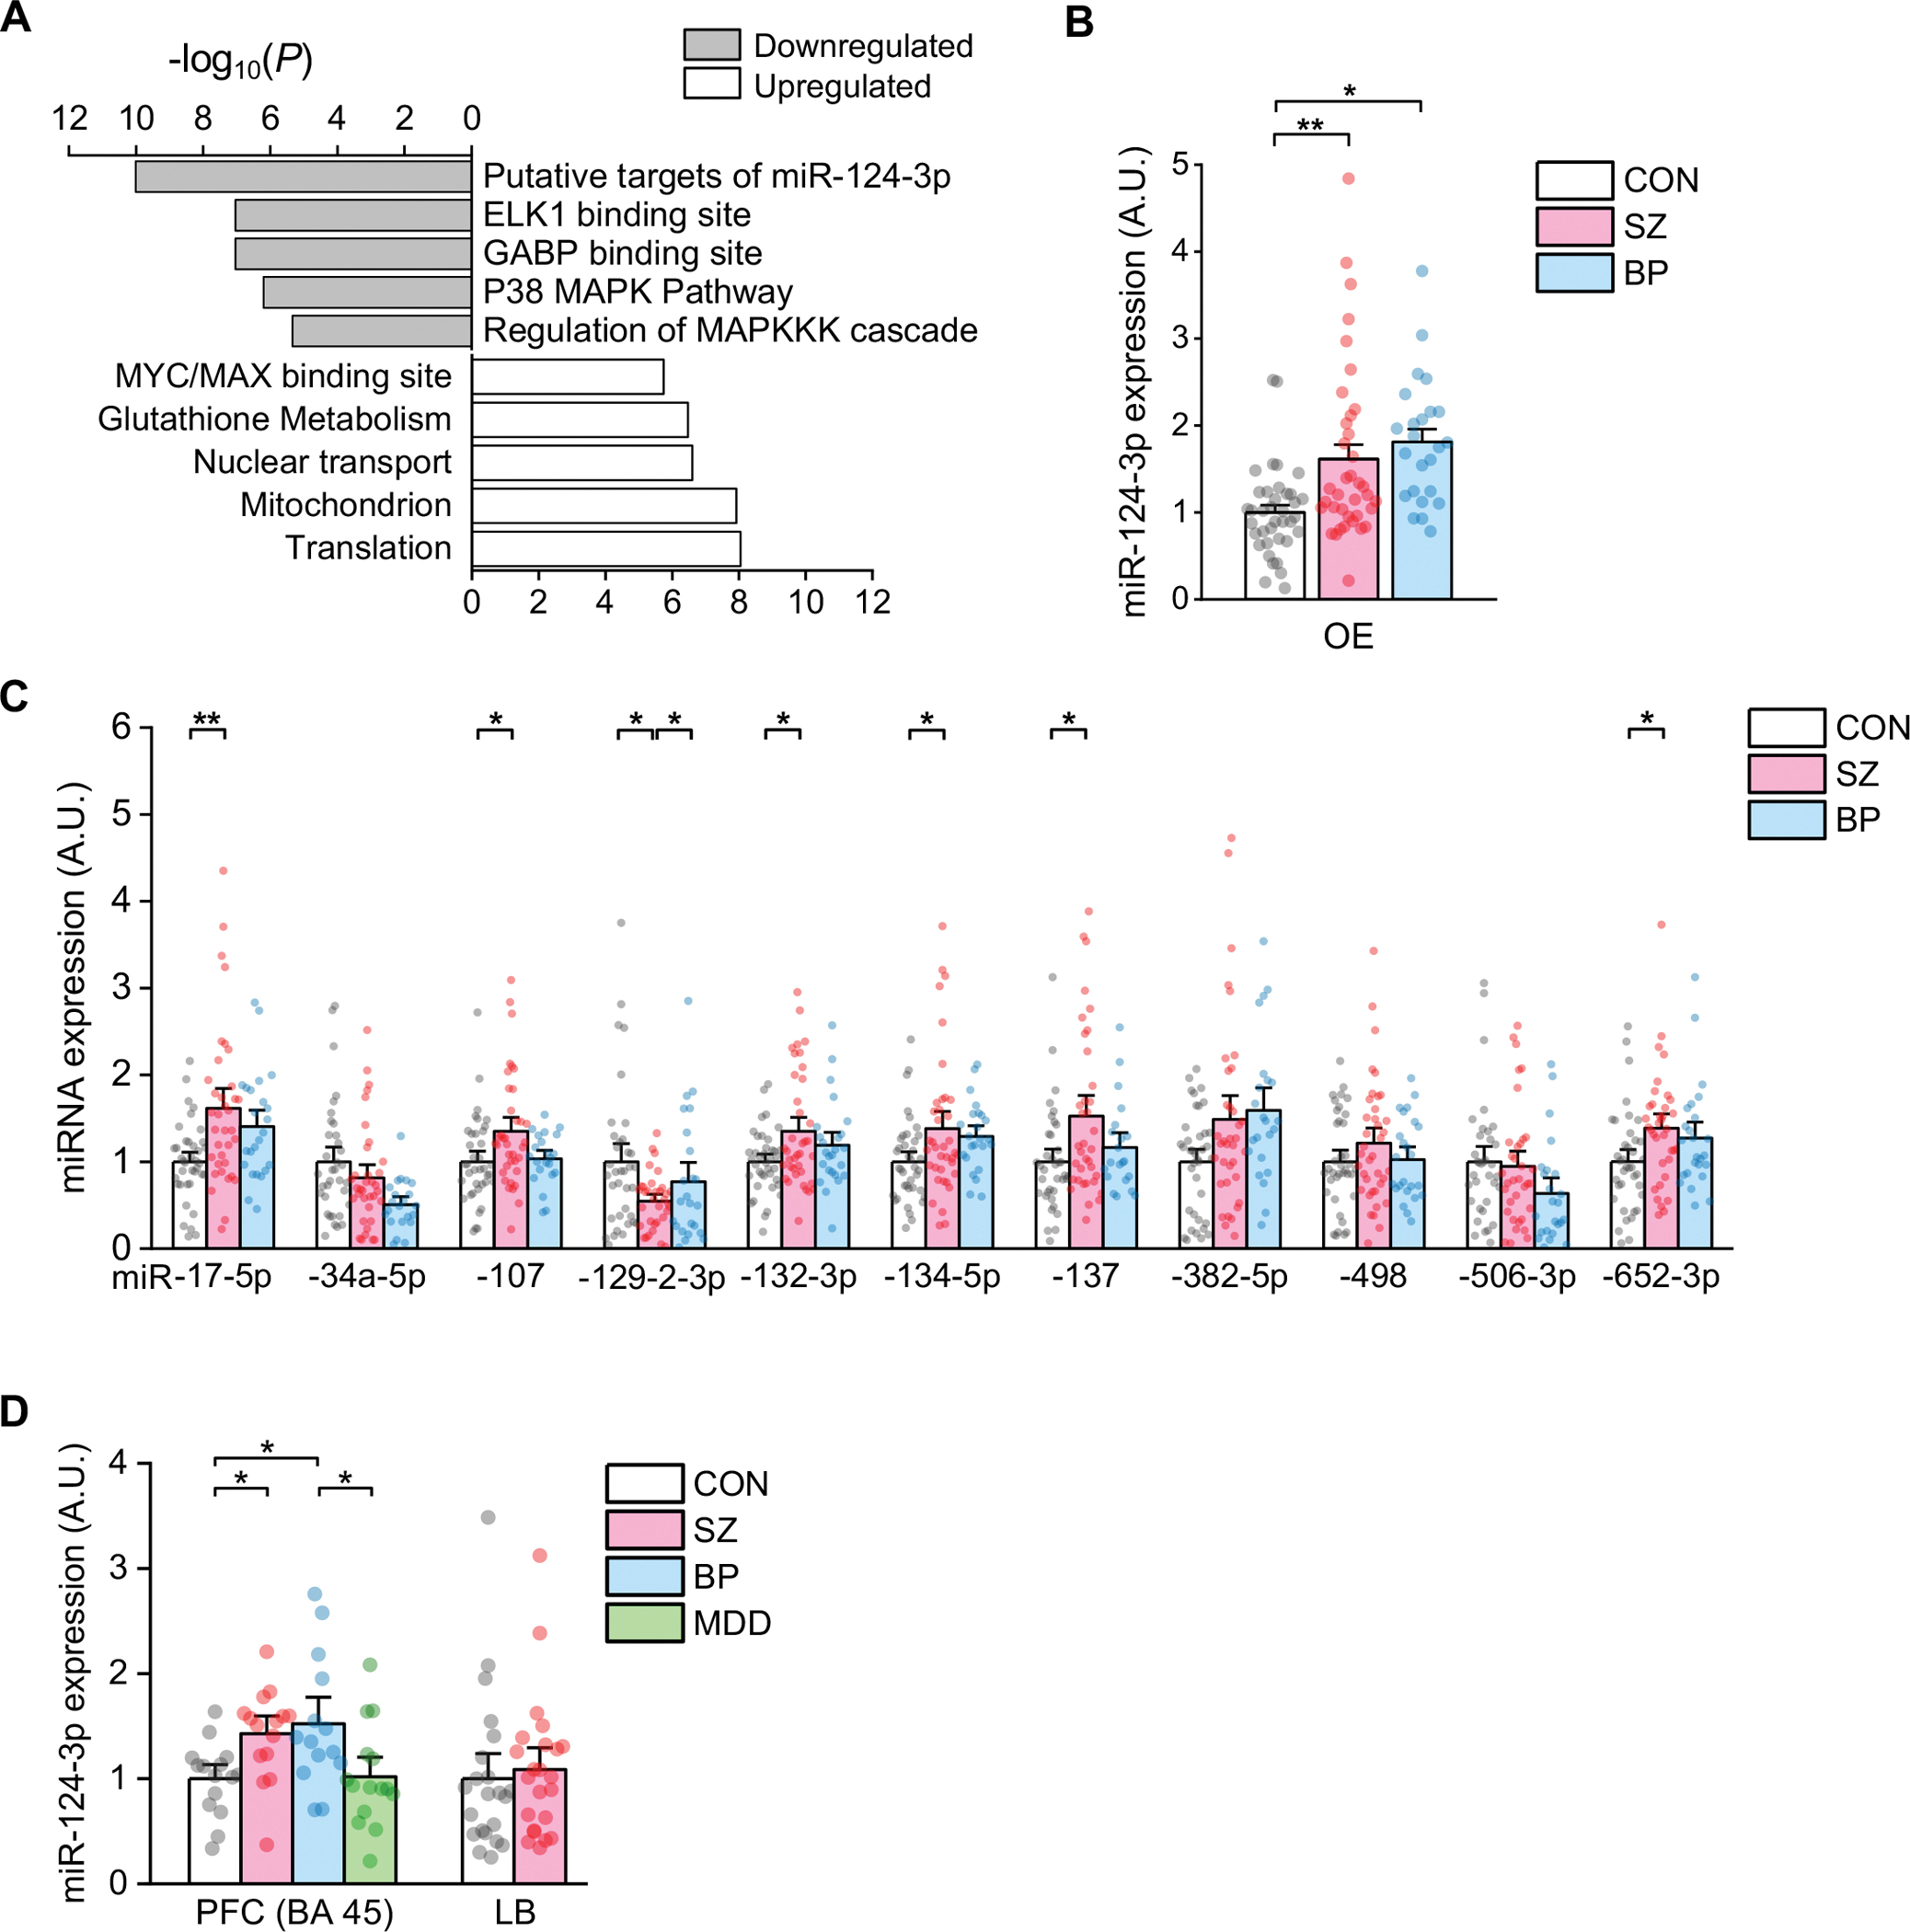
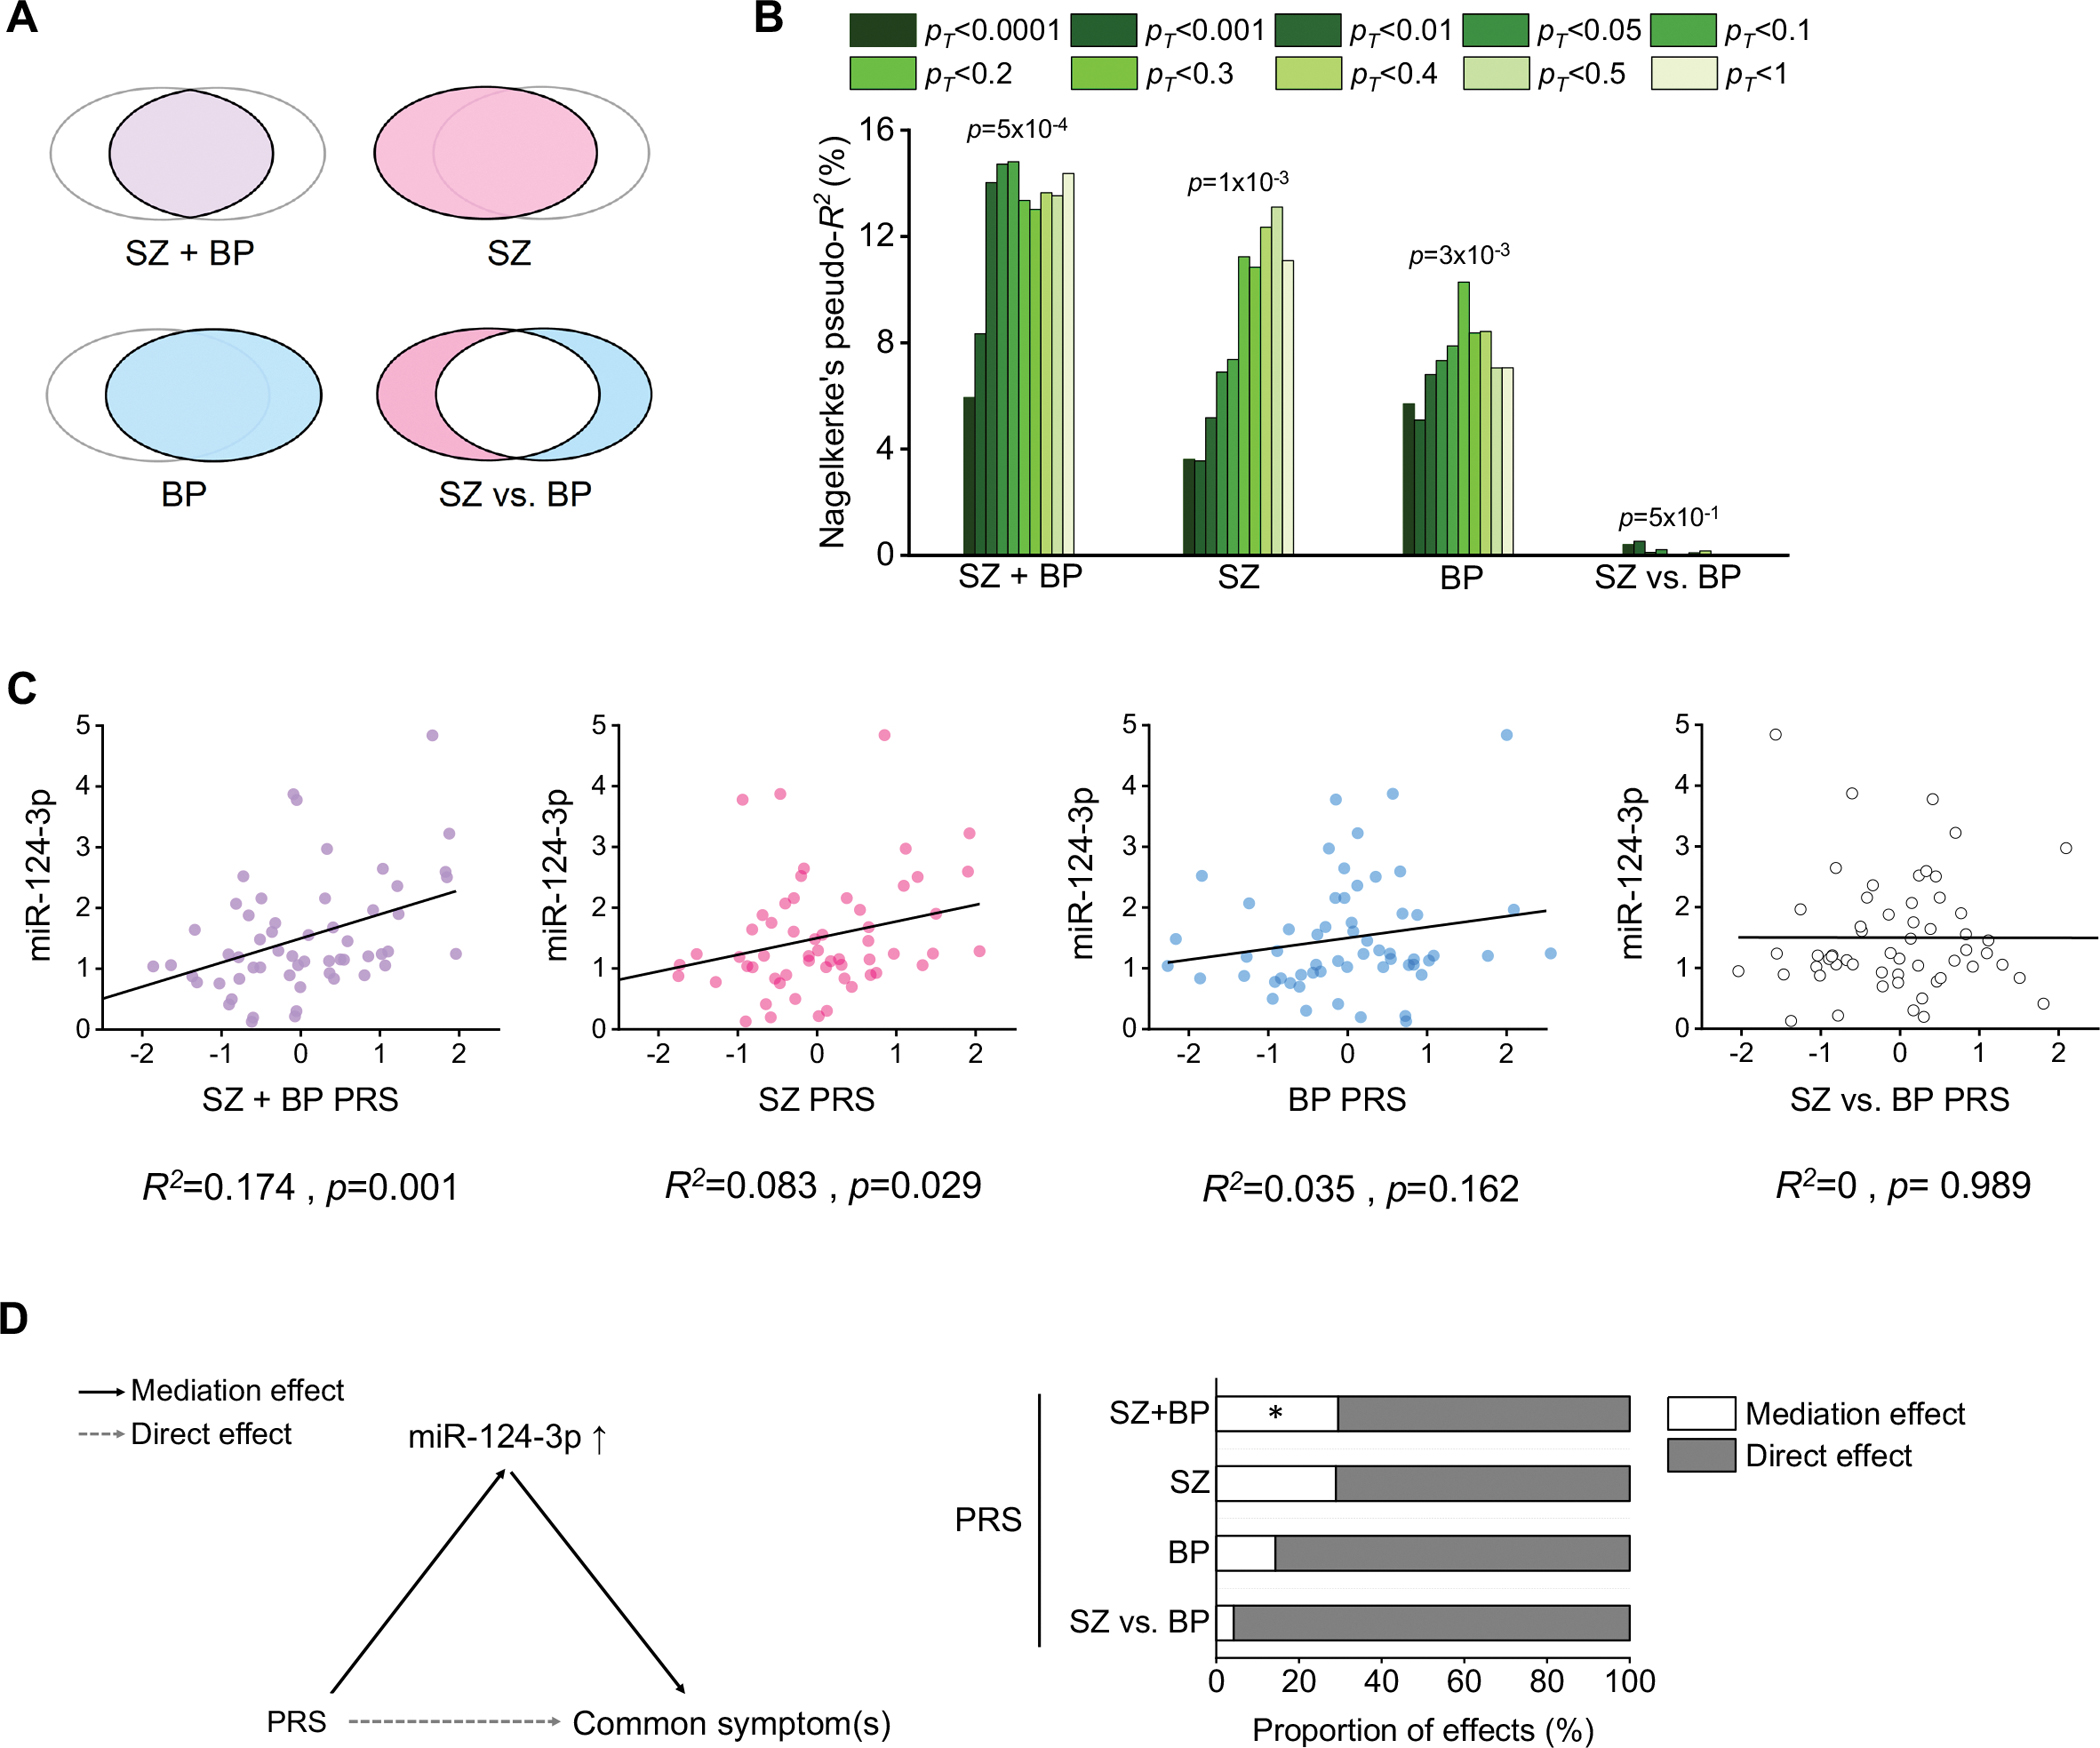
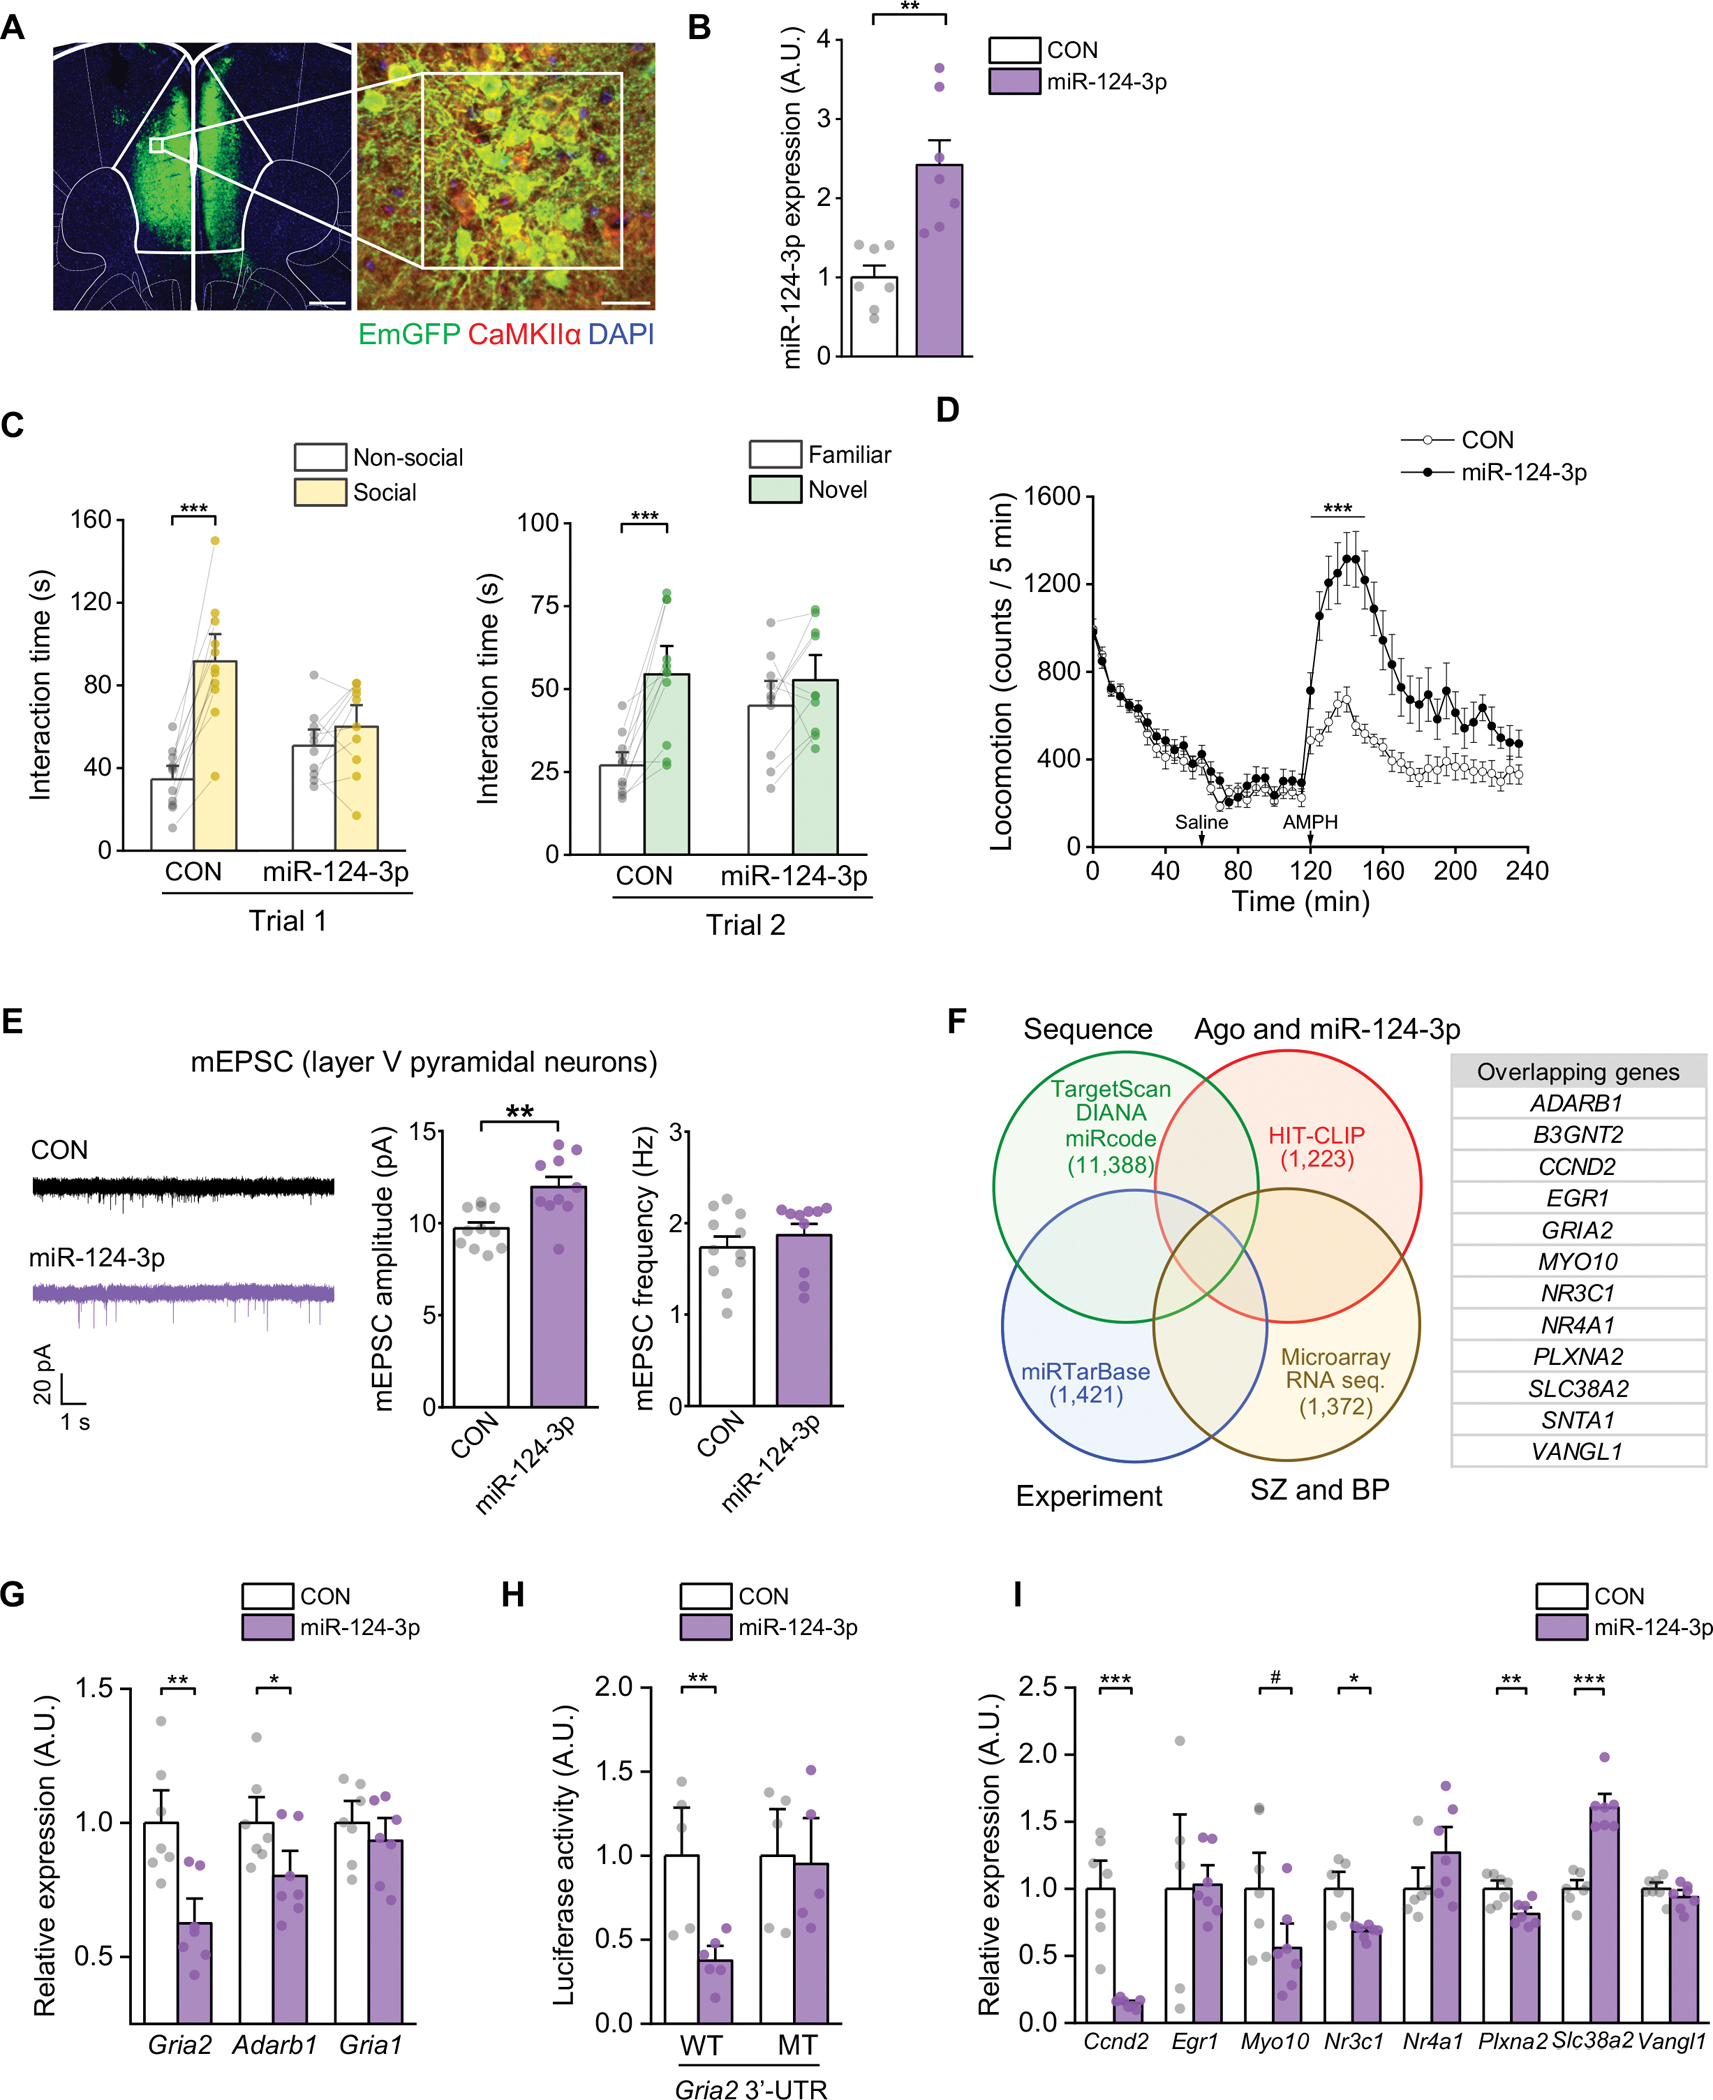
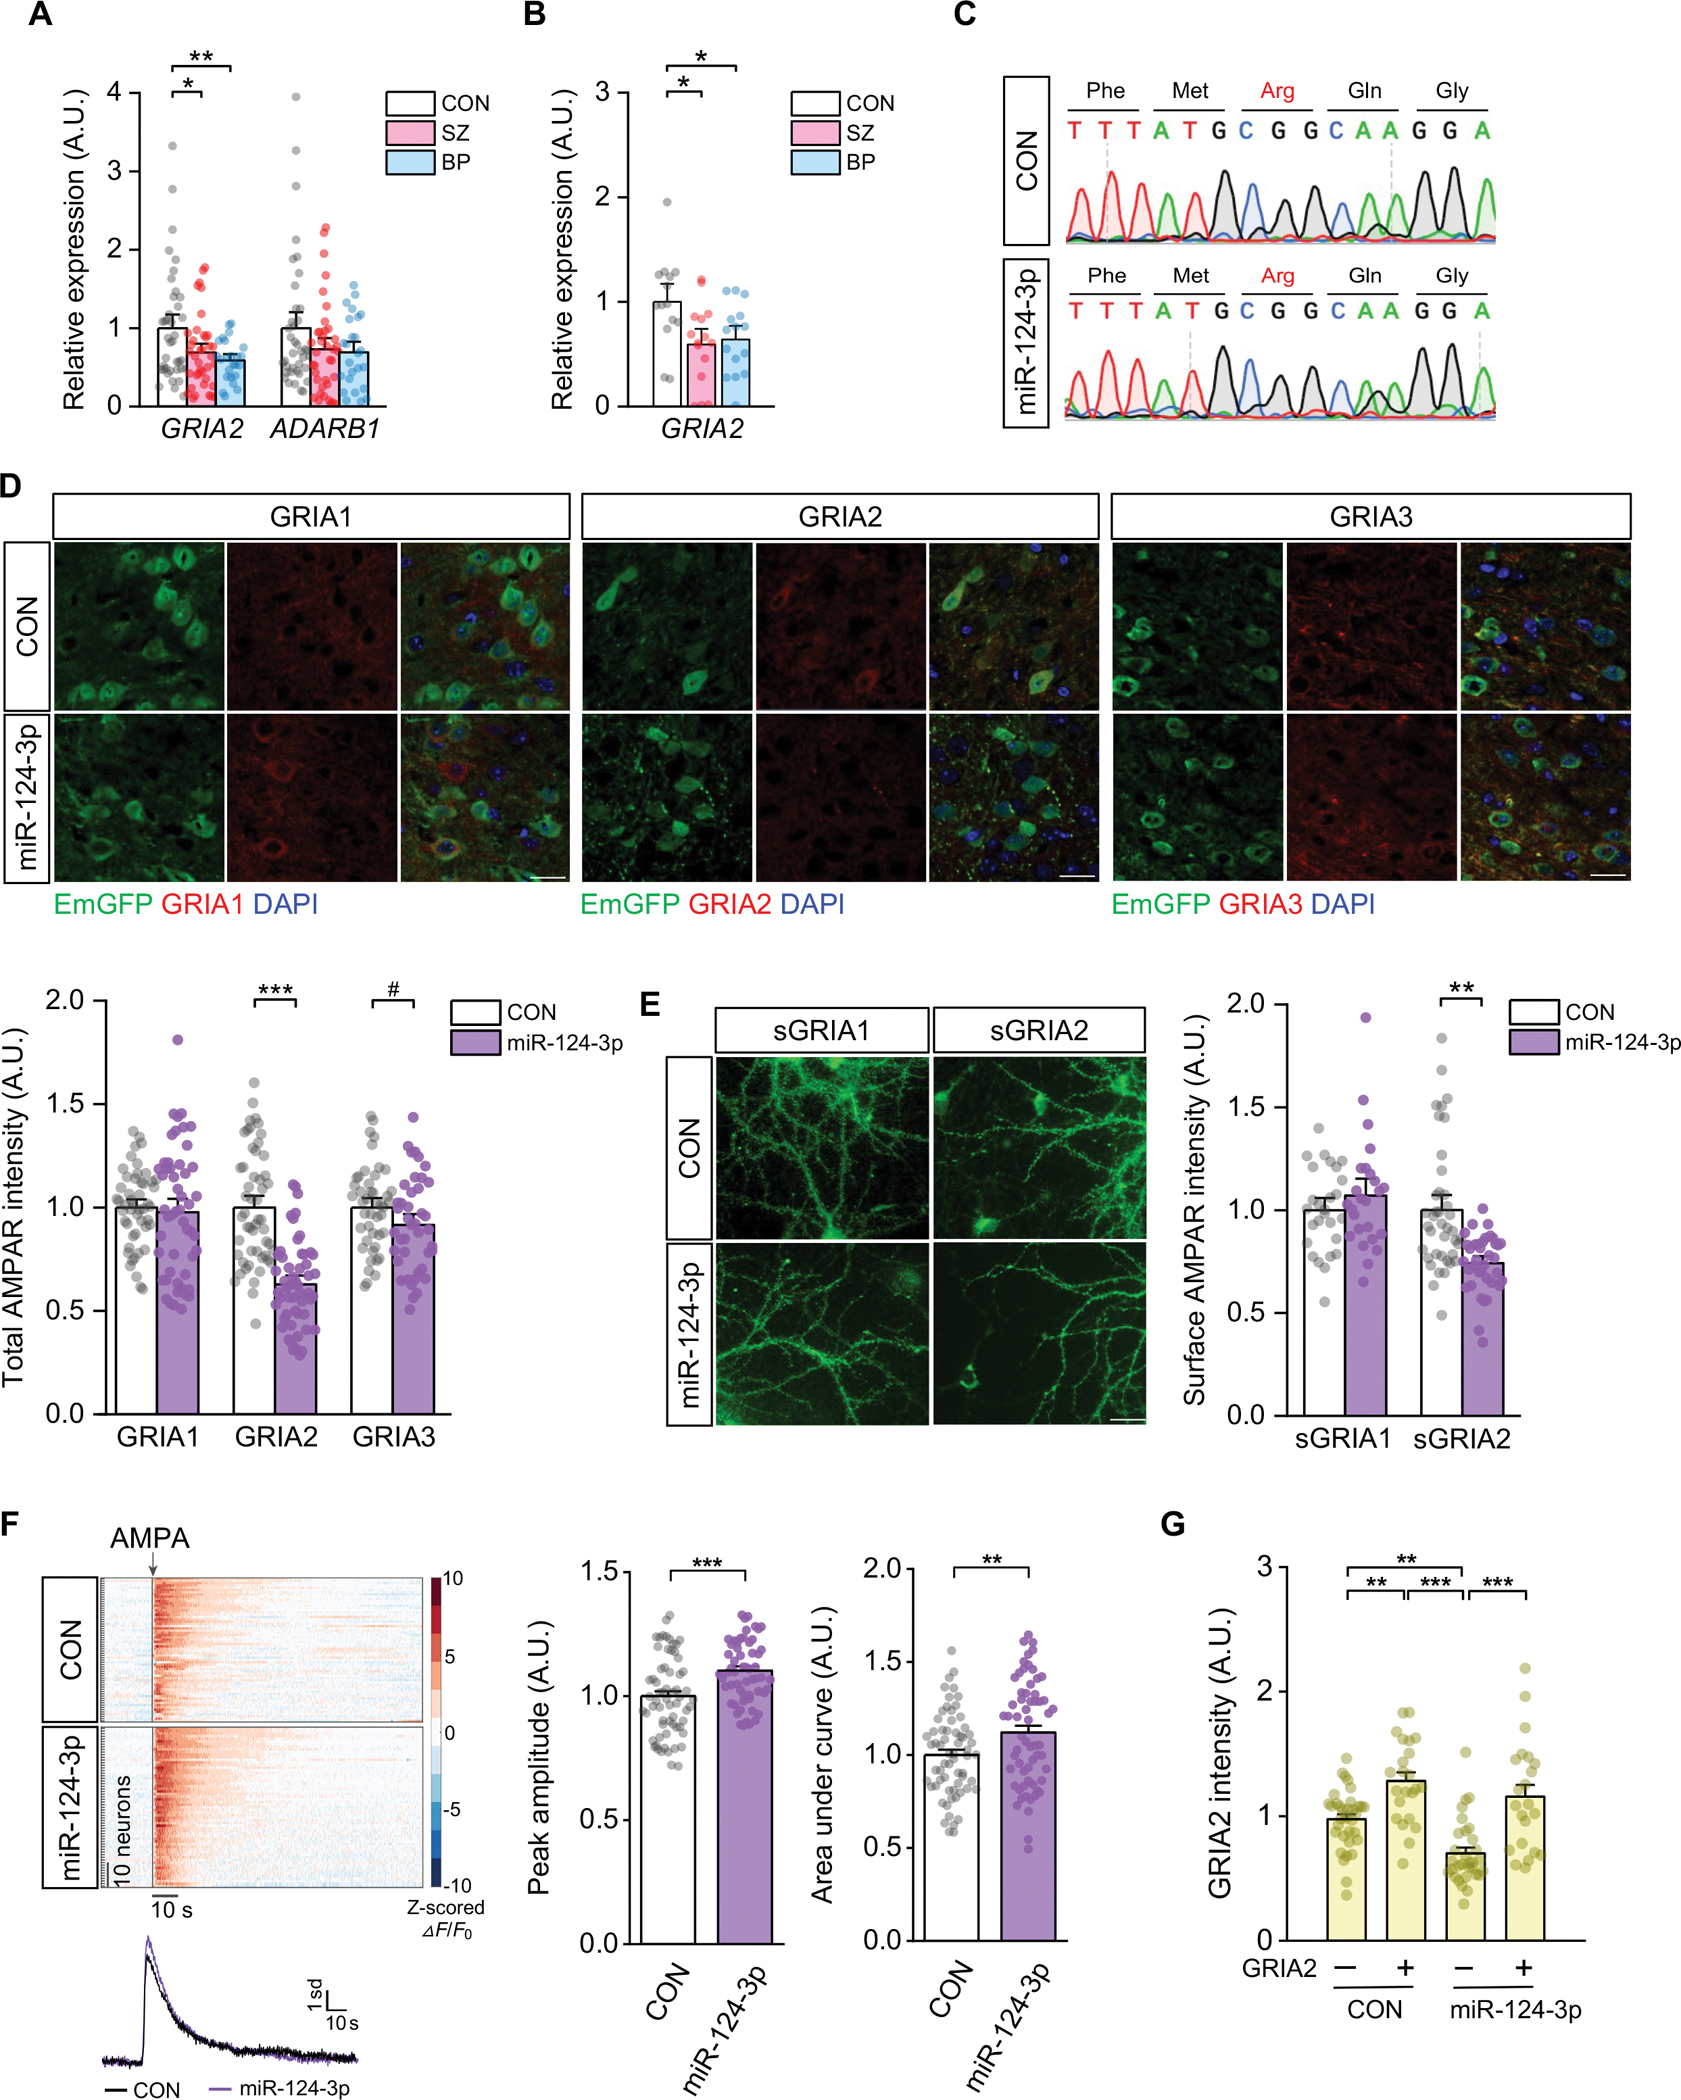
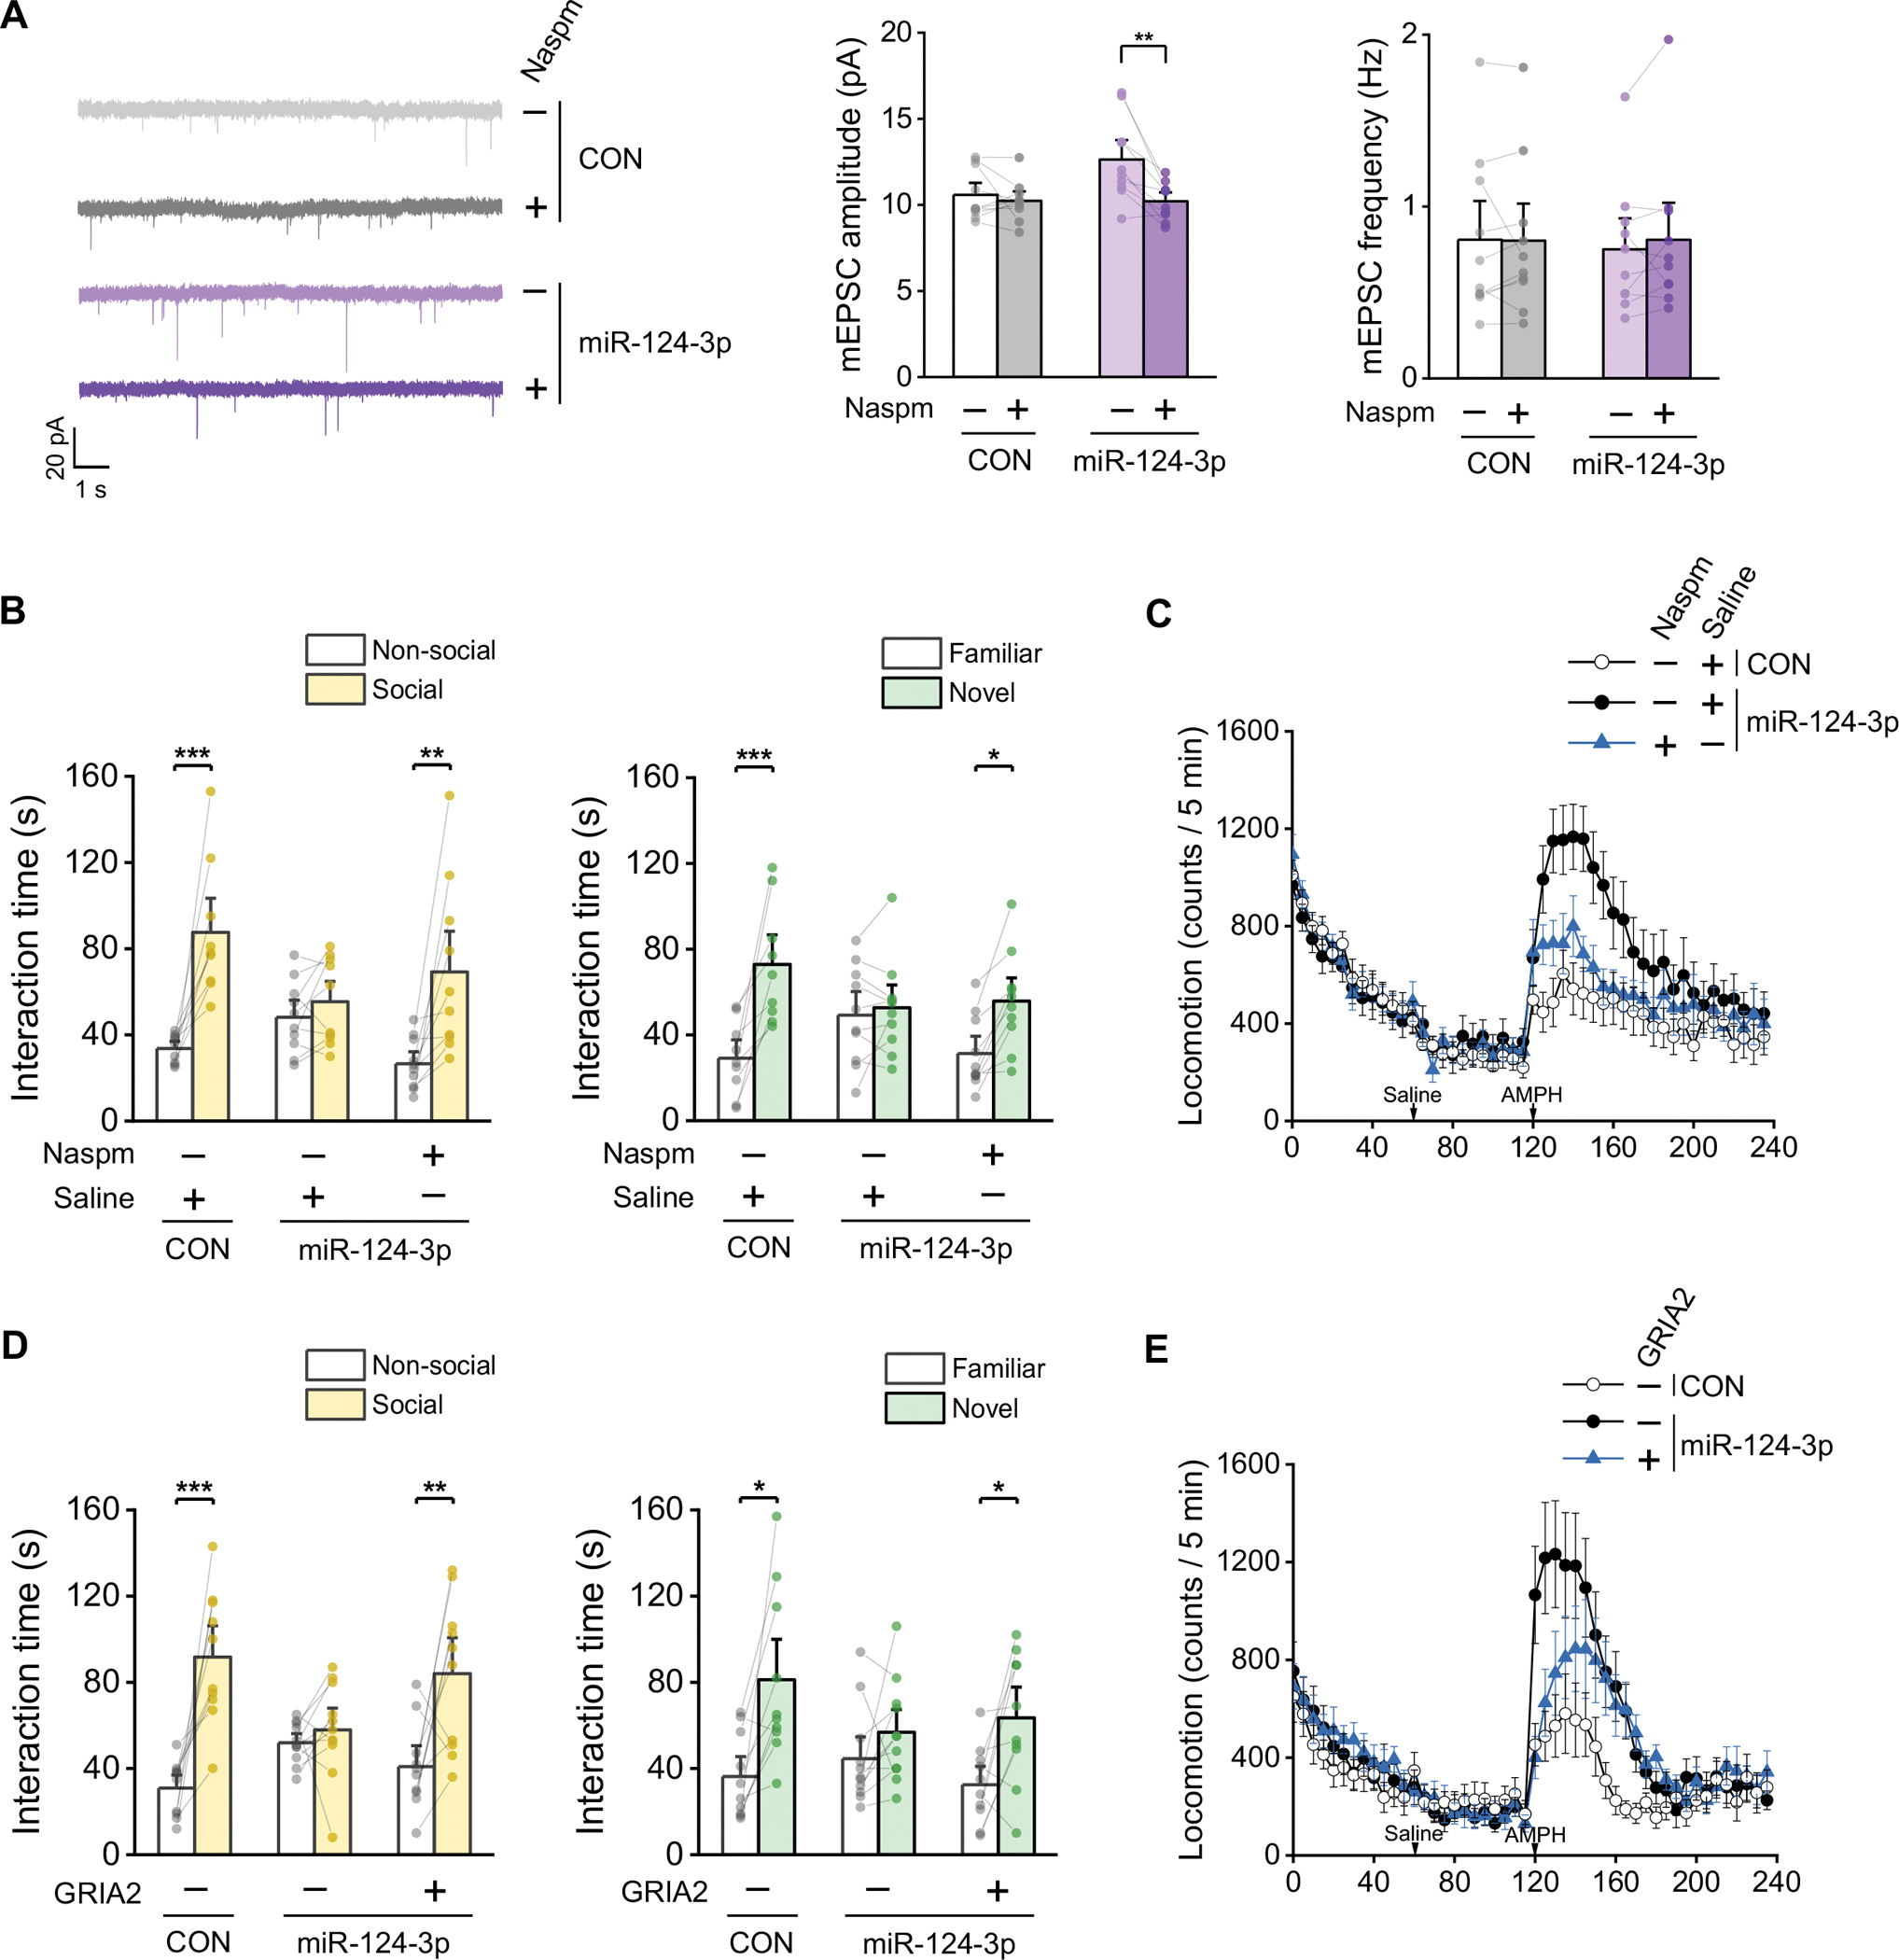
Schizophrenia (SZ) and bipolar disorder (BP) are highly heritable major psychiatric disorders that share a substantial portion of genetic risk as well as their clinical manifestations. This raises a fundamental question of whether, and how, common neurobiological pathways translate their shared polygenic risks into shared clinical manifestations. This study shows the miR-124-3p-AMPAR pathway as a key common neurobiological mediator that connects polygenic risks with behavioral changes shared between these two psychotic disorders. We discovered the upregulation of miR-124-3p in neuronal cells and the postmortem prefrontal cortex from both SZ and BP patients. Intriguingly, the upregulation is associated with the polygenic risks shared between these two disorders. Seeking mechanistic dissection, we generated a mouse model that upregulates miR-124-3p in the medial prefrontal cortex. We demonstrated that the upregulation of miR-124-3p increases GRIA2-lacking calcium-permeable AMPARs and perturbs AMPAR-mediated excitatory synaptic transmission, leading to deficits in the behavioral dimensions shared between SZ and BP.

Keywords: AMPAR; bipolar disorder; miR-124; polygenic risk; schizophrenia.


Conflict of interest statement

Declaration of interests The authors declare no competing interests. R.L.H. is a member of the journal’s advisory board.

Figures

Figure 1.
Figure 1.. miR-124-3p is significantly upregulated in biopsied neuronal cells and the postmortem prefrontal cortex (PFC) from patients with schizophrenia (SZ) and those with bipolar disorder (BP).
(A) Pathway enrichment analysis found that putative targets of miR-124-3p were significantly downregulated in olfactory epithelium (OE)-derived neuronal cells (olfactory neuronal cells) from patients with SZ, implying upregulation of miR-124-3p. (B) Upregulation of miR-124-3p was validated by quantitative real-time polymerase chain reaction (qRT-PCR) in olfactory neuronal cells from SZ and BP patients, compared to healthy controls (CON) [NCON=38, NSZ=37, NBP=24; General linear model (GLM) to compare miR-124-3p expression levels between diagnostic groups (CON, SZ, BP) with age, sex, race as covariates, 84F2,93=5.976, pDiagnosis=0.004; post hoc Bonferroni test]. (C) Alterations of miR-17-5p, -107, -1292-3p, -132-3p, -134-5p, -137, and -652-3p were detected in olfactory neuronal cells from SZ and/or BP patients. For each miRNA, the GLM was applied to compare its expression levels between diagnostic groups (CON, SZ, BP) with age, sex, race as covariates. miR-17-5p (NCON=38, NSZ=36, NBP=24; GLM, F2,92=6.842, pDiagnosis=0.002; post hoc Bonferroni test). miR-34a-5p (NCON=35, NSZ=35, NBP=22; GLM, F2,86=2.596, pDiagnosis=0.08; post hoc Bonferroni test). miR-107 (NCON=38, NSZ=37, NBP=22; GLM, F2,91=4.975, pDiagnosis=0.009; post hoc Bonferroni test). miR-129-2-3p (NCON=36, NSZ=34, NBP=24; GLM, F2,88=5.227, pDiagnosis=0.007; post hoc Bonferroni test). miR-132-3p (NCON=39, NSZ=38, NBP=25; GLM, F2,96=4.354, pDiagnosis=0.015; post hoc Bonferroni test). miR-134-5p (NCON=39, NSZ=38, NBP=24; GLM, F2,95=3.464, pDiagnosis=0.035; post hoc Bonferroni test). miR-137 (NCON=37, NSZ=36, NBP=21; GLM, F2,88=4.467, p=0.014; post hoc Bonferroni test). miR-382-5p (NCON=38, NSZ=36, NBP=23; GLM, F2,91=3.511, p=0.034; post hoc Bonferroni test). miR-498 (NCON=38, NSZ=38, NBP=24; GLM, F2,94=1.4, p=0.252; post hoc Bonferroni test). miR-506-3p (NCON=35, NSZ=35, NBP=24; GLM, F2,88=0.36, p=0.699; post hoc Bonferroni test). miR-652-3p (NCON=38, NSZ=36, NBP=25; GLM, F2,93=3.852, p=0.025; post hoc Bonferroni test). (D) miR-124-3p was also found to be upregulated in a sub-region (BA 45) of the postmortem PFC from both SZ and BP (but not MDD) patients, compared to that from CON (NCON=15, NSZ=15, NBP=14, NMDD=15; one-way ANOVA, F3,58=4.695, p=0.005; post hoc Tukey’s HSD test). However, no alteration was detected in lymphoblasts (LB) from SZ patients, compared to those from CON (NCON=22, NSZ=23; two-tailed Student’s t-test, t43=−0.415, p=0.754). Bar graph expressed as mean ± SEM. *p < 0.05, **p < 0.01. More detailed statistical information is in Table S3.
Figure 2.
Figure 2.. miR-124-3p serves as a key mediator linking the polygenic risks shared between SZ and BP to common clinical feature(s) that can exist in both SZ and BP.
(A) Genome-wide polygenic risk scores (PRSs) for SZ+BP, SZ, BP, SZ vs. BP were calculated in our independent samples of European ancestry to address shared or disease-specific polygenic contributions to phenotypic feature(s) that can commonly exist in SZ and BP. (B) Case-control status (either SZ or BP vs. CON) is best predicted by SZ+BP PRSs, and also well predicted by SZ PRSs or BP PRSs, which is in contrast to poor prediction by SZ vs. BP PRSs (NCON=45, NSZ+BP=63; logistic regression analysis). (C) Both SZ+BP and SZ PRSs significantly predict miR-124-3p expression, accounting for 17.4% and 8.3% of the variance of miR-124-3p expression, respectively, at the p-value thresholds where the PRSs best account for the diagnosis of either SZ or BP. However, PRSs for BP and SZ vs. BP do not significantly predict miR-124-3p expression, accounting only for 3.5% and 0% of the variance of miR-124-3p expression, respectively (N=57; linear regression analysis). (D) miR-124-3p functions as a significant mediator between the shared polygenic contributions and the diagnosis of either SZ or BP. SZ+BP PRSs (N=57; mediation analysis using a bootstrapping method with 5,000 iterations, proportion mediated (%) = 30.7; Estimatemediation effect= 0.051, 95% CI [0.005, 0.13], p=0.027; Estimatedirect effect=0.115, 95% CI [−0.033, 0.26], p=0.130. *p < 0.05. More detailed statistical information is in Table S3.
Figure 3.
Figure 3.. Overexpression of miR-124-3p in excitatory neurons of the mouse mPFC causes behavioral and synaptic deficits.
(A) Adeno-associated virus (AAV)-mediated expression of miR-124-3p or miR-control in mPFC excitatory neurons was validated by immunostaining of CaMKIIα and co-expressed EmGFP. Scale bars: 500 μm and 20 μm. (B) The mPFC excitatory neurons infected with miR-124-3p or miR-control (CON) AAV were isolated by fluorescence-activated cell sorting (FACS), and the subsequent qRT-PCR detected that miR-124-3p was increased 2.4-fold in miR-124-3p AAV-infected excitatory neurons compared with CON AAV-infected ones (NCON=7, NmiR-124-3p=7; two-tailed Student’s t-test, t12=−4.095, p=0.002). (C) Overexpression of miR-124-3p in mPFC excitatory neurons caused behavioral deficits in both sociability (Trial 1, left) and social novelty recognition (Trial 2, right) in three-chamber social interactions tests. Sociability phase of trial 1 (NCON=11, NmiR-124-3p=10; two-way mixed ANOVA, AAV x Chamber, F1,19=23.801, p=1×10⁻⁴; post hoc within-group comparisons using two-tailed paired Student’s t-test). Social novelty recognition phase of trial 2 (NCON=11, NmiR-124-3p=10; two-way mixed ANOVA, AAV × Chamber, F1,19=6.992, p=0.016; post hoc within-group comparisons using two-tailed paired Student’s t-test). (D) Overexpression of miR-124-3p in mPFC excitatory neurons caused locomotor hypersensitivity to a psychostimulant, amphetamine (AMPH). The between-group contrast was most evident for the first 30 min after the i.p. injection of AMPH (NCON=14, NmiR-124-3p=14; two-way mixed ANOVA with the Greenhouse-Geisser correction, AAV × Time, F2.226,57.866=9.065, p=2.34×10⁻⁴; post hoc two-tailed t-test for each time point). (E) Representative traces of mEPSC recordings in mPFC layer V pyramidal neurons in brain slices from mice infected with miR-124-3p or CON AAV (left). The miR-124-3p-overexpressing layer V pyramidal neurons showed significant increase in the amplitude of mEPSCs (middle; NCON=11, NmiR-124-3p=10; two-tailed student’s t-test, t19=−3.590, p=0.002). However, there was no change in the frequency of mEPSCs (right; NCON=11, NmiR-124-3p=10; two-tailed student’s t-test, t19=−0.787, p=0.441). (F) Downstream targets of miR-124-3p were predicted by identifying the overlapping genes of the following four databases: 1) sequence-matched putative target database merging the datasets from TargetScan, DIANA, and miRcode; 2) Ago-miRNA-mRNA interaction database, for which the HIT-CLIP dataset was used; 3) experimentally-screened target database utilizing the miRTarBase dataset; 4) database consisting of the genes downregulated in the postmortem cerebral cortex from both SZ and BP patients, for which we used recently published microarray and RNA sequence datasets. (G) Gria2 and Adarb1, but not Gria1, were found to be significantly downregulated in FACS-isolated miR-124-3p-overexpressing excitatory neurons. Gria2 (NCON=7, NmiR-124-3p=7; two-tailed student’s t-test, t12=3.678, p=0.003). Adarb1 (NCON=7, NmiR-124-3p=7; two-tailed student’s t-test, t12=2.220, p=0.046). Gria1 (NCON=7, NmiR-124-3p=7; two-tailed student’s t-test, t12=0.85, p=0.412). (H) In human HEK-293 cells, transfected miR-124-3p significantly suppressed the expression of a luciferase reporter gene with the wild-type (WT) miR-124-3p binding site in the 3’-UTR of Gria2, whereas the expression of a reporter gene with the mutated (MT) miR-124-3p binding site was not suppressed. WT (NCON=5, NmiR-124-3p=6; two-tailed Student’s t-test, t9=3.4, p=0.008). MT (NCON=5, NmiR-124-3p=5; two-tailed Student’s t-test, t8=0.189, p=0.855). (I) Ccnd2, Nr3c1, Plxna2 were significantly downregulated by miR-124-3p overexpression, whereas unexpectedly Slc38a2 was significantly upregulated. B3gnt2 and Snta1 were under detection limit. Ccnd2 (NCON=7, NmiR-124-3p=7; two-tailed Welch’s t-test, t6.1=6.604, p=8.58×10⁻⁴). Egr1 (NCON=5, NmiR-124-3p=7; two-tailed Welch’s t-test, t4.559=−0.08, p=0.94). Myo10 (NCON=7, NmiR-124-3p=7; two-tailed student’s t-test, t12=2.04, p=0.064). Nr3c1 (NCON=6, NmiR-124-3p=7; two-tailed Welch’s t-test, t5.51=3.681, p=0.012). Nr4a1 (NCON=6, NmiR-124-3p=7; two-tailed student’s t-test, t11=−1.596, p=0.139). Plxna2 (NCON=7, NmiR-124-3p=7; two-tailed student’s t-test, t12=3.551, p=0.002). Slc38a2 (NCON=7, NmiR-124-3p=7; two-tailed student’s t-test, t12=−7.456, p=8×10⁻⁷). Vangl1 (NCON=7, NmiR-124-3p=7; two-tailed student’s t-test, t12=1.313, p=0.214). Bar graph expressed as mean ± SEM. #p < 0.07, *p < 0.05, **p < 0.01, ***p < 0.001. More detailed statistical information is in Table S3.
Figure 4.
Figure 4.. Overexpression of miR-124-3p increases GRIA2-lacking calcium permeable AMPARs (CP-AMPARs).
(A) Significant downregulation of GRIA2 and decreasing trend of ADARB1 were observed in olfactory neuronal cells from SZ and BP patients. GRIA2 (NCON=39, NSZ=38, NBP=24; Welch’s ANOVA, F2,64.642=5.268, p=0.008; post hoc Games-Howell test). ADARB1 (NCON=39, NSZ=38, NBP=25; one-way ANOVA, F2,99=2.188, p=0.118; post hoc Tukey’s HSD test). (B) Significant downregulation of GRIA2 in the postmortem PFC (BA 45) from SZ and BP patients. GRIA2 (NCON=14, NSZ=15, NBP=15; One-way ANOVA, F2,43=4.763, p=0.014; post hoc Tukey’s HSD test). (C) The sequencing results showed that Gria2 transcripts from both miR-124-3p and CON AAVs-infected excitatory neurons normally encoded an arginine residue at the Q/R site, indicating that the modest downregulation of Adarb1 did not affect Q/R RNA editing efficiency of Gria2. (D) Representative images and quantification of total GRIA1, GRIA2, and GRIA3 in mouse mPFC excitatory neurons infected with CON or miR-124-3p AAV. In miR-124-3p-overexpressing excitatory neurons, GRIA2, but not GRIA1, was significantly decreased, while GRIA3 showed a decreasing trend. GRIA1 (NCON=49, NmiR-124-3p=51; two-tailed Welch’s t-test, t81.988=0.458, p=0.648). GRIA2 (NCON=53, NmiR-124-3p=53; two-tailed Welch’s t-test, t96.433=7.848, p=5.8×10⁻¹²). GRIA3 (NCON=45, NmiR-124-3p=42; two-tailed Student’s t-test, t85=1.822, p=0.072). (E) Representative images and quantification of surface GRIA1 (sGRIA1) and GRIA2 (sGRIA2) in primary cortical neurons infected with CON or miR-124-3p AAV. In primary cortical neurons overexpressing miR-124-3p, sGRIA2, but not sGRIA1, was significantly decreased. sGRIA1 (NCON=27, NmiR-124-3p=25; two-tailed Student’s t-test, t50=−1.066, p=0.291). sGRIA2 (NCON=40, NmiR-124-3p=37; two-tailed Welch’s t-test, t55.262=4.774, p=1.4×10⁻⁵). (F) 50 uM AMPA-evoked calcium transients of mPFC excitatory neurons in brain slices infected with miR-124-3p or CON AAV. Peak amplitude and area under the curve of AMPA-evoked calcium transients were significantly increased in miR-124-3p-overexpressing mPFC excitatory neurons. In conjunction with the histological data, this indicates increased CP-AMPARs. Peak amplitude (NCON=64, NmiR-124-3p=60; two-tailed Student’s t-test, t122=3.867, p=1.78×10⁻⁴). Area under curve (NCON=64, NmiR-124-3p=61; two-tailed Welch’s t-test, t113.364=2.604, p=9.92×10⁻³). (G) AAV-mediated co-expression of miR-124-3p and GRIA2 without 3’-UTR led to a significant increase in GRIA2 in mPFC excitatory neurons in brain slices, compared with those only infected with miR-124-3p AAV, but not compared with those only infected with CON AAV. GRIA2 (NCON=35, NCON+GRIA2=31, NmiR-124-3p=23, NmiR-124-3p+GRIA2=22; One-way ANOVA, F3,110=17.61, p=2.31×10⁻⁹; post hoc two-tailed Student’s t-test). The bar graph expressed as mean ± SEM. #p < 0.08; *p < 0.05; **p < 0.01; ***p < 0.001. More detailed statistical information is in Table S3.
Figure 5.
Figure 5.. Blocking GRIA2-lacking CP-AMPARs with Naspm or restoration of GRIA2 expression ameliorates the previously observed synaptic and behavioral deficits.
(A) The increase of mEPSC amplitude in mPFC excitatory neurons, induced by AAV-mediated miR-124-3p overexpression, was normalized by bath application of Naspm, a selective antagonist of CP-AMPARs. mEPSC amplitude (NCON=10, NmiR-124-3p=10; two-way mixed ANOVA, AAV × Naspm, F1,18=8.454, p=0.009; post hoc within-group comparisons using two-tailed paired Student’s t-test). mEPSC frequency (NCON=10, NmiR-124-3p=10; two-way mixed ANOVA, AAV × Naspm, F1,18=0.593, p=0.451; post hoc within-group comparisons using two-tailed paired Student’s t-test). (B) The behavioral deficits in sociability (left) and social novelty recognition (right), which were induced by miR-124-3p overexpression in mPFC excitatory neurons, were ameliorated by local infusion of Naspm into the mPFC. Sociability phase of trial 1 (NCON AAV + Saline=9, NmiR-124-3p AAV + Saline=10, NmiR-124-3p AAV + Naspm=10; miR-124-3p AAV + Saline vs. miR-124-3p AAV + Naspm, two-way mixed ANOVA, Intervention × Chamber, F1,18=6.725, p=0.018; post hoc within-group comparisons using two-tailed paired Student’s t-test). Social novelty recognition phase of trial 2 (NCON AAV + Saline=9, NmiR-124-3p AAV + Saline=10, NmiR-124-3p AAV + Naspm=10; miR-124-3p AAV + Saline vs. miR-124-3p AAV +Naspm, two-way mixed ANOVA, Intervention × Chamber, F1,18=9.276, p=0.007; post hoc within-group comparisons using two-tailed paired Student’s t-test). (C) The locomotor hypersensitivity to AMPH, induced by miR-124-3p overexpression in mPFC excitatory neurons, was ameliorated by local infusion of Naspm into the mPFC. The ameliorating effect was most evident for the first 15 min after the i.p. injection of AMPH (NCON AAV + Saline=12, NmiR-124-3p AAV + Saline=13, NmiR-124-3p AAV + Naspm=10; miR-124-3p AAV + Saline vs. miR-124-3p AAV + Naspm, two-way mixed ANOVA with the Greenhouse-Geisser correction, Intervention × Time, F1.542,32.391=9.671, p=0.001; post hoc two-tailed Student’s t-test for each time point). (D) The behavioral deficits in sociability (left) were ameliorated by AAV-mediated restoration of GRIA2. The behavioral deficits in social novelty recognition (right) were also ameliorated, albeit but not robustly, by the restoration of GRIA2. Sociability phase of trial 1 (NCON AAV + No-GRIA2 AAV=10, NmiR-124-3p AAV + No-GRIA2 AAV=11, NmiR-124-3p AAV + GRIA2 AAV=10; miR-124-3p AAV + No-GRIA2 AAV vs. miR-124-3p AAV + GRIA2 AAV, two-way mixed ANOVA, Intervention x Chamber, F1,19=5.741, p=0.027; post hoc within-group comparisons using two-tailed paired Student’s t-test). Social novelty recognition phase of trial 2 (NCON AAV + No-GRIA2 AAV=10, NmiR-124-3p AAV + No-GRIA2 AAV=11, NmiR-124-3p AAV + GRIA2 AAV=10; miR-124-3p AAV + No-GRIA2 AAV vs. miR-124-3p AAV + GRIA2 AAV, two-way mixed ANOVA, Intervention x Chamber, F1,19=1.876, p=0.187; post hoc within-group comparisons using two-tailed paired Student’s t-test). (E) The locomotor hypersensitivity to AMPH, induced by miR-124-3p overexpression in mPFC excitatory neurons, was ameliorated by AAV-mediated restoration of GRIA2. The ameliorating effect was most evident for the first 60 min after the i.p. injection of AMPH (NCON AAV + No-GRIA2 AAV=11, NmiR-124-3p AAV + No-GRIA2 AAV=10, NmiR-124-3p AAV + GRIA2 AAV=11; miR-124-3p AAV + No-GRIA2 AAV vs. miR-124-3p AAV + GRIA2 AAV, two-way mixed ANOVA with the Greenhouse-Geisser correction, Intervention × Time, F2.593,49.262=6.301, p=0.002; post hoc two-tailed t-test for each time point). Bar graph expressed as mean ± SEM. *p < 0.05, **p < 0.01, ***p < 0.001. More detailed statistical information is in Table S3.

Comment in

Similar articles

Cited by

References

    1. Geschwind DH, and Flint J (2015). Genetics and genomics of psychiatric disease. Science 349, 1489–1494. 10.1126/science.aaa8954. - DOI - PMC - PubMed
    1. Gandal MJ, Leppa V, Won H, Parikshak NN, and Geschwind DH (2016). The road to precision psychiatry: translating genetics into disease mechanisms. Nat Neurosci 19, 1397–1407. 10.1038/nn.4409. - DOI - PMC - PubMed
    1. O’Donovan MC, and Owen MJ (2016). The implications of the shared genetics of psychiatric disorders. Nat Med 22, 1214–1219. 10.1038/nm.4196. - DOI - PubMed
    1. Consortium T.S.W.G.o.t.P.G., Ripke S, Walters JT, and O’Donovan MC (2020). Mapping genomic loci prioritises genes and implicates synaptic biology in schizophrenia. medRxiv, 2020.2009.2012.20192922. 10.1101/2020.09.12.20192922. - DOI
    1. Mullins N, Forstner AJ, O’Connell KS, Coombes B, Coleman JRI, Qiao Z, Als TD, Bigdeli TB, Børte S, Bryois J, et al. (2021). Genome-wide association study of more than 40,000 bipolar disorder cases provides new insights into the underlying biology. Nat Genet 53, 817–829. 10.1038/s41588-021-00857-4. - DOI - PMC - PubMed

Publication types