. 2022 Dec 5;32(23):5069-5082.e13.
doi: 10.1016/j.cub.2022.10.044. Epub 2022 Nov 14.

Modeling convergent scale-by-scale skin color patterning in multiple species of lizards

Affiliations

Modeling convergent scale-by-scale skin color patterning in multiple species of lizards

Ebrahim Jahanbakhsh et al. Curr Biol. .

Abstract

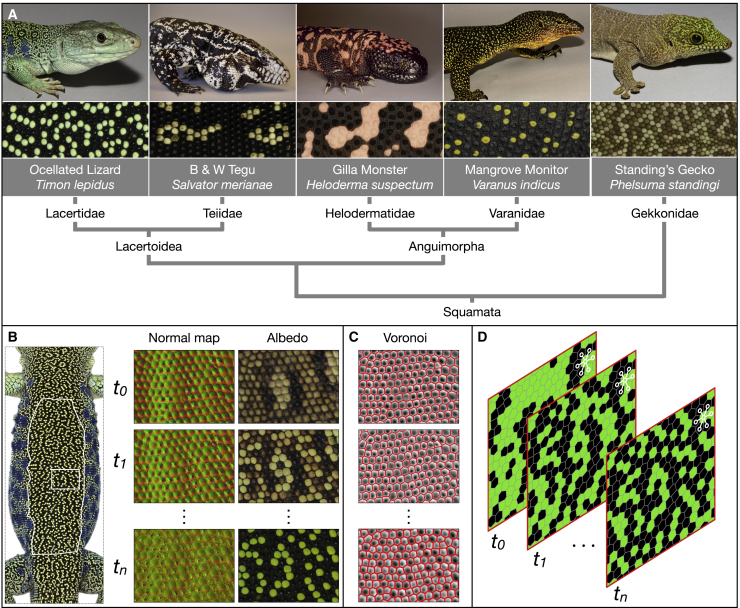
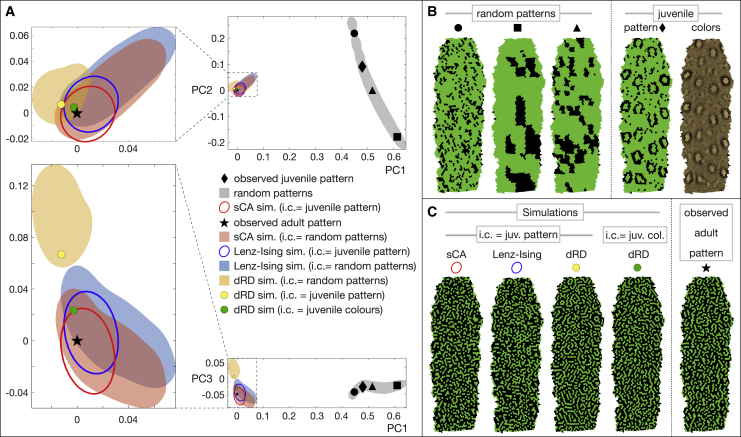
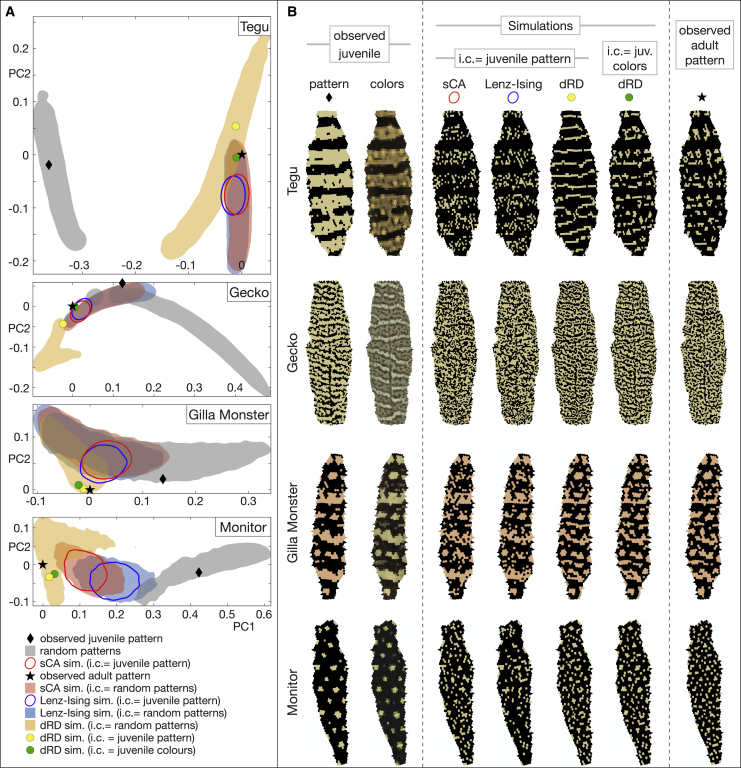
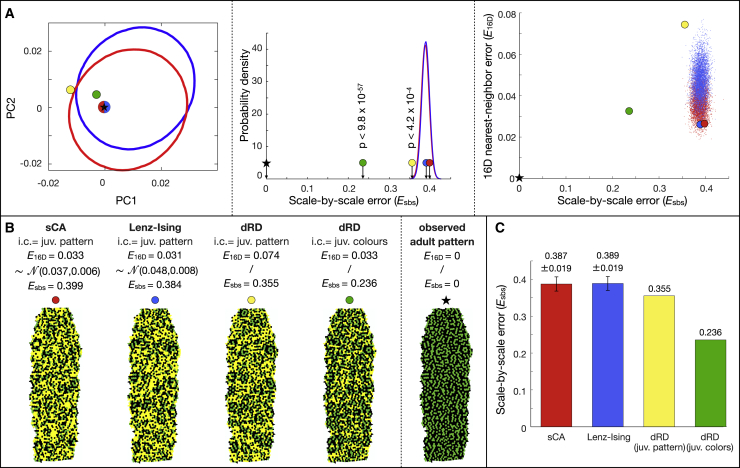
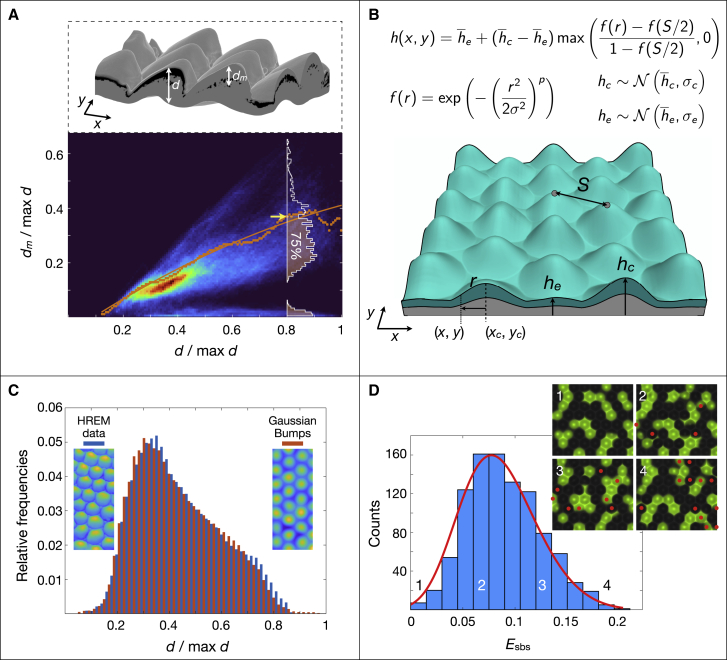
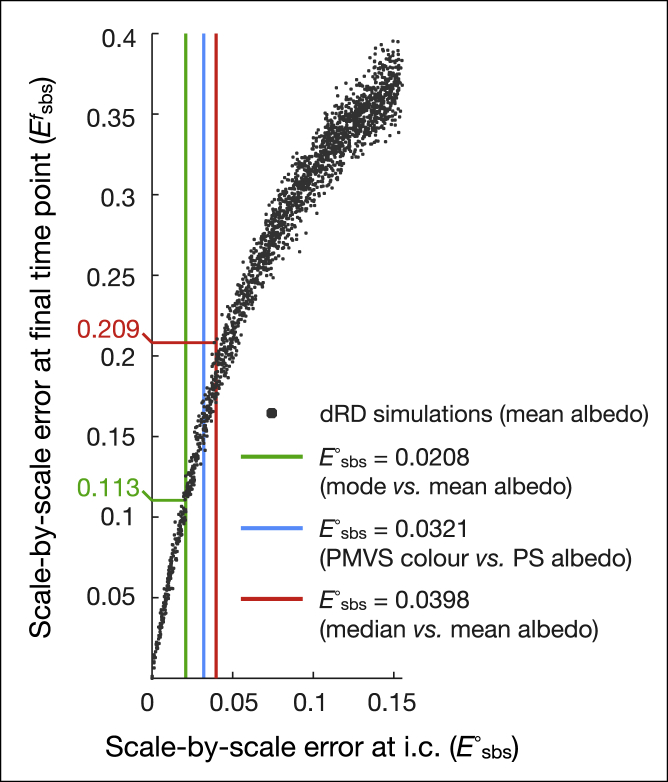
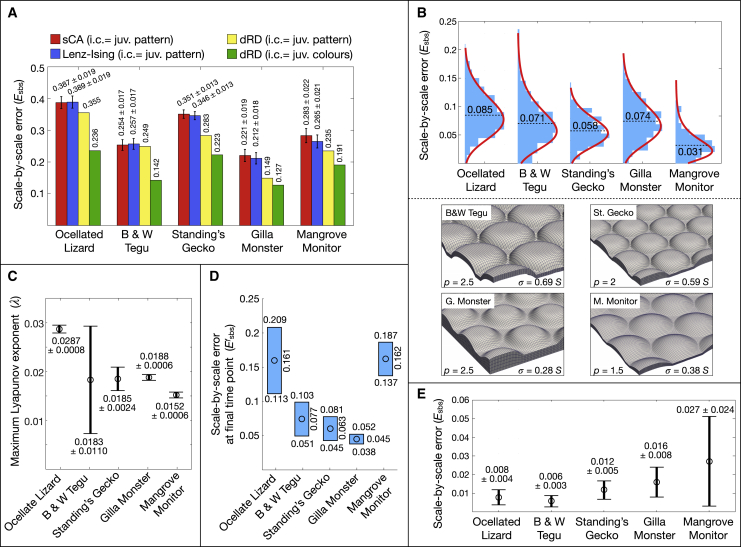
Skin color patterning in vertebrates emerges at the macroscale from microscopic cell-cell interactions among chromatophores. Taking advantage of the convergent scale-by-scale skin color patterning dynamics in five divergent species of lizards, we quantify the respective efficiencies of stochastic (Lenz-Ising and cellular automata, sCA) and deterministic reaction-diffusion (RD) models to predict individual patterns and their statistical attributes. First, we show that all models capture the underlying microscopic system well enough to predict, with similar efficiencies, neighborhood statistics of adult patterns. Second, we show that RD robustly generates, in all species, a substantial gain in scale-by-scale predictability of individual adult patterns without the need to parametrize the system down to its many cellular and molecular variables. Third, using 3D numerical simulations and Lyapunov spectrum analyses, we quantitatively demonstrate that, given the non-linearity of the dynamical system, uncertainties in color measurements at the juvenile stage and in skin geometry variation explain most, if not all, of the residual unpredictability of adult individual scale-by-scale patterns. We suggest that the efficiency of RD is due to its intrinsic ability to exploit mesoscopic information such as continuous scale colors and the relations among growth, scales geometries, and the pattern length scale. Our results indicate that convergent evolution of CA patterning dynamics, leading to dissimilar macroscopic patterns in different species, is facilitated by their spontaneous emergence under a large range of RD parameters, as long as a Turing instability occurs in a skin domain with periodic thickness. VIDEO ABSTRACT.

Keywords: Lenz-Ising model; Turing patterns; cellular automaton; convergence; development; evolution; lizards; reaction-diffusion; scales; skin color patterns.


Conflict of interest statement

Declaration of interests The authors declare no competing interests.

Figures

Figure 1
Figure 1
Acquisition of skin-scale color texture in five lizard species (A) The five species investigated here (top, image of an adult individual; middle, close up on the adult pattern) belong to divergent squamate lineages (bottom, phylogenetic cladogram). (B) A large dorsal skin patch (white outline in left panel) is photographed from different orientations and under different directions of incident illumination to generate high-resolution microgeometry (normal map, central panels, is shown for the small rectangular region framed in the left panel) and color texture (albedo, right panels) at multiple time points ti. The individual shown in the left panel is TL1. (C) The filtered curvature field (shading) allows identifying scale centers that are then used for building a Voronoi diagram, identifying scale boundaries (red lines), and scale lattice connectivity. (D) Matching of scales across time points produces a space-time network of scales; white lines show one scale with one of its six neighbors shifting color from green to black between time points t1 and tn. See also Figure S6.
Figure 2
Figure 2
Prediction of neighborhood statistics in ocellated lizard individual TL1 (A) Projections on the principal component planes PC1-PC2 (top) and PC1-PC3 (bottom) of the 16D nearest-neighbor error vectors (in comparison with the observed adult pattern, black star) of patterns simulated with sCA (red ellipse and red shading), Lenz-Ising (blue), and dRD (yellow) models; interactive 3D graphs in PC1-PC2-PC3 space available as Data S1. Red ellipse, blue ellipse, and yellow spot show adult patterns simulated from the observed juvenile pattern (black diamond), whereas red, blue, and yellow shadings show adult patterns simulated from random patterns (gray area) as initial condition. The green spot shows the adult dRD-pattern simulated from the juvenile colors shown in (B) (rightmost panel). Ellipses and border of shadings indicate 1% density isolines. (B) Different initial conditions used for simulations; their localization in PC1-PC2-PC3 space is shown with the corresponding geometrical symbols. (C) Adult patterns simulated with different initial conditions (i.c.): juvenile (juv.) pattern (=scale colors thresholded to green or black) and juvenile colors (col.) are both shown in (B). Similar results are obtained for individual TL2 (Figure S2; Data S2). See also Figure S1 and Table S4.
Figure 3
Figure 3
Prediction of neighborhood statistics in four additional species (A) Projections on the PC1-PC2 plane of the 16D nearest-neighbor error vectors (in comparison with observed adult pattern, black stars) of patterns simulated with sCA (red ellipse and shading), Lenz-Ising (blue), and dRD (yellow) models in black and white tegu (SM1), Standing’s gecko (PS1), Gila monster (HS1), and mangrove monitor (VI1). Red ellipses, blue ellipses, and yellow spots show adult patterns simulated from the observed juvenile pattern (black diamonds), whereas red, blue, and yellow shadings show patterns simulated from random patterns (gray areas) as initial condition. The green spots show the dRD-pattern simulated from the juvenile color shown in (B). (B) Left: observed juvenile patterns and colors. Center: adult patterns simulated with juvenile (juv.) pattern (=scale colors thresholded to green or black) or juvenile colors as initial condition (i.c.). Right: observed adult patterns. Ellipses and border of shadings indicate 1% density isolines. See also Tables S3 and S4 and Figure S3.
Figure 4
Figure 4
Prediction of scale-by-scale patterns in ocellated lizard individual TL1 (A) Simulated adult patterns with low neighborhood errors do not show particularly low scale-by-scale errors (Esbs) within the distribution of simulated patterns: red and blue spots indicate zero-error patterns (in the PC1-PC2 plane, left) among the 5,000 simulated with sCA and Lenz-Ising, respectively. Ellipses in left panel are 1% density isolines of neighborhood error vectors whereas the Gaussian distributions in the central panel are the Esbs probability density functions. The adult patterns simulated from the juvenile pattern or juvenile colors (yellow and green spots, respectively) exhibit statistically smaller Esbs (p values shown in central panel) than the sCA and Lenz-Ising probability density functions. Right: no correlation is observed between neighborhood error and scale-by-scale error; red points and blue points are 5,000 simulations with sCA and Lenz-Ising, respectively. (B) Simulated adult patterns (corresponding to red, blue, yellow, and green spots in A); scales whose color is erroneous (in comparison with observed adult, rightmost pattern) are indicated in yellow. (C) Histogram (mean ± SD) comparing scale-by-scale errors of adult patterns simulated with different models. Similar results are obtained for individual TL2 (Figure S2). See also Figure S5.
Figure 5
Figure 5
Heterogeneity in skin thickness variation affects RD predictability (A) Top: ocellated lizard dorsal 3D skin patch reconstructed using HREM; d and dm are, for each value of (x,y), the skin thickness and black pixel lowest depth, respectively. Bottom: heatmap of normalized dm versus normalized d; orange dots indicate, for each value of d/maxd, the boundary (yellow arrow) at the 75th percentile in the corresponding distribution (white profile); orange line, second-order polynomial smooth fit across the orange dots. (B) Example of an hexagonal 3D lattices of super-Gaussian bumps (mean distance among neighboring scales S is from HREM data; σ and p are Gaussian parameters in the equation on top) with hc (height for each bump) and he (for each edge) are sampled from N(h¯c,σc) and N(h¯e,σe), where h¯c,e and σc,e are means and variances, respectively. The skin domain restricted to chromatophores (turquoise) is computed using the mapping dm(d); see text for details. (C) Histogram of domain thickness of the 3D lattice shown in (B) after optimizing σ, p, h¯c,e, and σc,e to obtain a profile (red) highly similar to the HREM data histogram (blue). (D) Histogram of scale-by-scale error (in comparison with the pattern simulated with a reference homogeneous 3D domain of identical Gaussian bumps, i.e., σc=σe=0 ) in adult patterns simulated on 1,000 heterogeneous 3D domains similar to the one shown in (B). The fitted generalized extreme-value distribution (red line) indicates that heterogeneity in skin thickness variation produces a mean Esbs8.5%. Inset shows examples of patterns generated with four heterogeneous domains (red dots indicate scales with wrong color, and numbers refer to their Esbs value in the histogram).
Figure 6
Figure 6
Scale-by-scale error due to juvenile color measurement uncertainty Plot of the scale-by-scale error at the final (adult) time point versus error at initial condition (i.c.) for the 2,000 simulations shown in Figure S4 (Lyapunov spectrum analysis). At initial (juvenile) condition, median albedo (red line) or mode albedo (green) or mean RGB colors (blue) give differences of scale colors (against mean albedo) that generate 11.3%–20.9% scale-by-scale error at the adult stage.
Figure 7
Figure 7
Residual unpredictability and measurement uncertainties (A) Scale-by-scale errors (mean ± SD) of adult patterns simulated with different stochastic and RD models in five lizard species: green columns represent the residual unpredictability of the RD model with juvenile (juv.) colors at initial condition (i.c). (B) Top: distribution and mean (dotted lines) of scale-by-scale error caused by heterogeneity in skin thickness variation (distributions generated as in Figure 5D) in five species of lizards. Lower panels show the reference hexagonal lattices of 3D super-Gaussian bumps with optimized p and σ (p = 1 and σ = 0.28S for ocellated lizard). S = mean distance among neighboring scales on a real skin patch of the corresponding species. Heterogeneity in skin thickness variation generates a mean unpredictability of 8.5%, 7.1%, 5.8%, 7.4%, and 3.1% in ocellated lizard, tegu, gecko, Gila monster, and monitor, respectively. (C) Mean and SD of Lyapunov exponent (computed as in Figure S4) for five species of lizards. (D) Range (circles indicate middle of ranges) of scale-by-scale error (at adult time point) obtained with simulations initiated with juvenile colors differing by a small amount Esbs within the range CmodeCref,CmedianCref, where Cref, Cmode, and Cmedian are the mean, mode, and median albedos of juvenile colors. Uncertainties in juvenile color measurements generate a mean unpredictability of 16.1%, 7.7%, 6.3%, 4.5%, and 16.2% in ocellated lizard, tegu, gecko, Gila monster, and monitor, respectively. (E) RD is robust to parameters variation in all five species: scale-by-scale error (mean ± SD) is computed from 5,000 simulations with parameters uniformly sampled in a range covering ±10% of the RD parameter normalization factor estimated during Bayesian optimization.

Comment in

References

    1. Nakamasu A., Takahashi G., Kanbe A., Kondo S. Interactions between zebrafish pigment cells responsible for the generation of Turing patterns. Proc. Natl. Acad. Sci. USA. 2009;106:8429–8434. doi: 10.1073/pnas.0808622106. - DOI - PMC - PubMed
    1. Inaba M., Yamanaka H., Kondo S. Pigment pattern formation by contact-dependent depolarization. Science. 2012;335:677. doi: 10.1126/science.1212821. - DOI - PubMed
    1. Frohnhöfer H.G., Krauss J., Maischein H.M., Nüsslein-Volhard C. Iridophores and their interactions with other chromatophores are required for stripe formation in zebrafish. Development. 2013;140:2997–3007. doi: 10.1242/dev.096719. - DOI - PMC - PubMed
    1. Hamada H., Watanabe M., Lau H.E., Nishida T., Hasegawa T., Parichy D.M., Kondo S. Involvement of Delta/Notch signaling in zebrafish adult pigment stripe patterning. Development. 2014;141:318–324. doi: 10.1242/dev.099804. - DOI - PMC - PubMed
    1. Singh A.P., Schach U., Nüsslein-Volhard C. Proliferation, dispersal and patterned aggregation of iridophores in the skin prefigure striped coloration of zebrafish. Nat. Cell Biol. 2014;16:607–614. doi: 10.1038/ncb2955. - DOI - PubMed

Publication types

LinkOut - more resources