. 2022 Dec 1:264:119749.
doi: 10.1016/j.neuroimage.2022.119749. Epub 2022 Nov 13.

Late dominance of the right hemisphere during narrative comprehension

Affiliations

Late dominance of the right hemisphere during narrative comprehension

Vahab Youssofzadeh et al. Neuroimage. .

Abstract

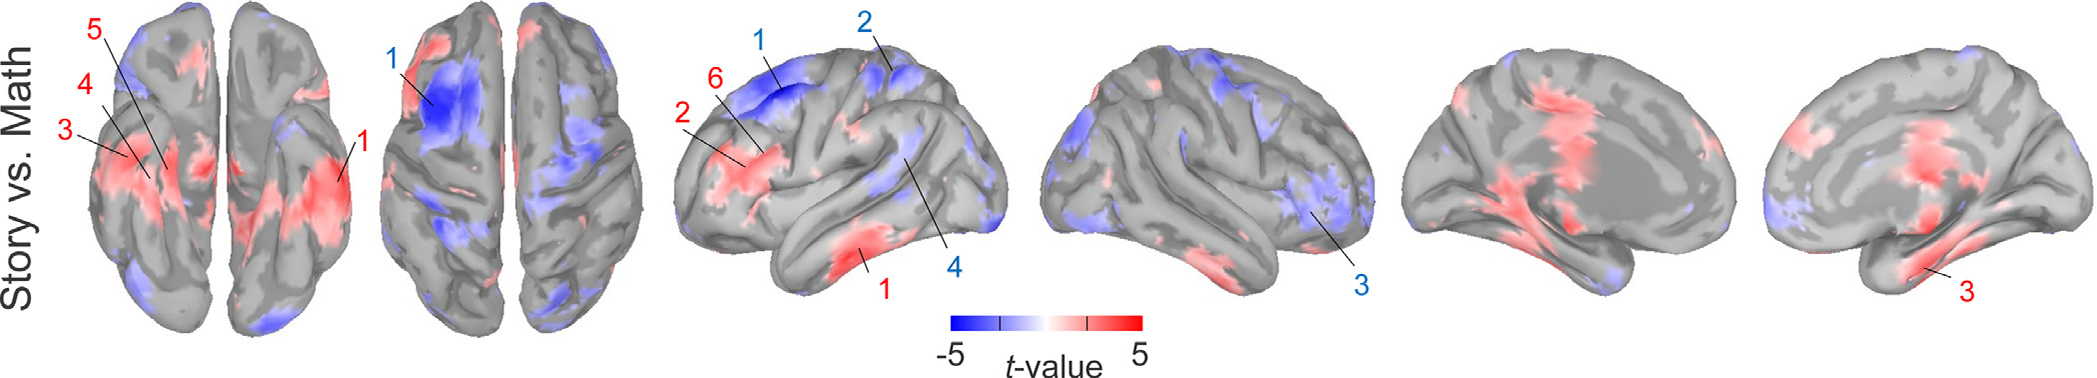
PET and fMRI studies suggest that auditory narrative comprehension is supported by a bilateral multilobar cortical network. The superior temporal resolution of magnetoencephalography (MEG) makes it an attractive tool to investigate the dynamics of how different neuroanatomic substrates engage during narrative comprehension. Using beta-band power changes as a marker of cortical engagement, we studied MEG responses during an auditory story comprehension task in 31 healthy adults. The protocol consisted of two runs, each interleaving 7 blocks of the story comprehension task with 15 blocks of an auditorily presented math task as a control for phonological processing, working memory, and attention processes. Sources at the cortical surface were estimated with a frequency-resolved beamformer. Beta-band power was estimated in the frequency range of 16-24 Hz over 1-sec epochs starting from 400 msec after stimulus onset until the end of a story or math problem presentation. These power estimates were compared to 1-second epochs of data before the stimulus block onset. The task-related cortical engagement was inferred from beta-band power decrements. Group-level source activations were statistically compared using non-parametric permutation testing. A story-math contrast of beta-band power changes showed greater bilateral cortical engagement within the fusiform gyrus, inferior and middle temporal gyri, parahippocampal gyrus, and left inferior frontal gyrus (IFG) during story comprehension. A math-story contrast of beta power decrements showed greater bilateral but left-lateralized engagement of the middle frontal gyrus and superior parietal lobule. The evolution of cortical engagement during five temporal windows across the presentation of stories showed significant involvement during the first interval of the narrative of bilateral opercular and insular regions as well as the ventral and lateral temporal cortex, extending more posteriorly on the left and medially on the right. Over time, there continued to be sustained right anterior ventral temporal engagement, with increasing involvement of the right anterior parahippocampal gyrus, STG, MTG, posterior superior temporal sulcus, inferior parietal lobule, frontal operculum, and insula, while left hemisphere engagement decreased. Our findings are consistent with prior imaging studies of narrative comprehension, but in addition, they demonstrate increasing right-lateralized engagement over the course of narratives, suggesting an important role for these right-hemispheric regions in semantic integration as well as social and pragmatic inference processing.

Keywords: Beta band power decrements; Language; Magnetoencephalography; Math; Narrative comprehension; Story.


Conflict of interest statement

Declaration of Competing Interest The authors have declared that no competing interests exist.

Figures

Figure 1.
Figure 1.
The Story-Math task. The story-math task consists of two runs, each interleaving 7 blocks of the story and 15 blocks of the math tasks, with an average block duration of 14–24 and 2–13 seconds for story and math blocks, respectively. The story blocks present participants with brief auditory stories (5–9 sentences) adapted from Aesop’s fables (www.aesopfables.com), followed by a 2-alternative forced-choice question that asks participants about the topic of the story. The math task consisted of auditorily presenting addition and subtraction problems that the subjects responded to. Task difficulty was adjusted to maintain a response accuracy of ~ 75%.
Figure 2.
Figure 2.
Beta-power decrements relative to baseline during story and math-problem presentation. The maps represent the t-values for the beta decrement of the story (first row) and math conditions (second row) identified by the DICS beamformer source analysis. The t-values were obtained from a one-sample t-test of beta-band relative source powers against a null hypothesis. Source activations (t-values for beta-power decrements) with pFWE < 0.05 are displayed on an inflated template (MNI-152) with dark representing sulci and gray representing gyri. The t-values and MNI coordinates of the local activation peaks in specific areas are reported in Table 2. T-values greater than 4.3 and 3.4 are shown for the story and math task responses, respectively.
Figure 3.
Figure 3.
Comparison between story and math beta power decrements. Areas, where Story-beta-decrements > Math-beta-decrements (red) and Math-beta-decrements > Story-beta-decrements (blue) based on a two-sided paired t-test of beta power changes are displayed using a diverging color scale. T-values greater than absolute 3.5 are shown. Corresponding t-values and MNI coordinates of activation peaks within the numbered regions are reported in Table 3.
Figure 4.
Figure 4.
Cortical engagement for five temporal windows defined over the story presentation, relative to the math problem presentation periods. The cortical maps represent beta power decrements for five intervals of the first, second, third, fourth, and fifth temporal windows of the story presentation condition relative to the math condition. Corresponding t-values and MNI coordinates of the local activation peaks are reported in Table 4. The contrasting condition, math blocks, is shown in Fig. 2. All five story intervals were contrasted against the same time-averaged math response shown in Fig. 2.
Figure 5.
Figure 5.
Beta-power decrements of regions significantly engaged in any of the five intervals of story comprehension relative to math. (a) Regions were identified from a union of suprathreshold engagement with a half-maximum t-value of the corresponding source maps and intersected with the Harvard-Oxford atlas ROIs. A total of 60 (30×2) cortical parcels from the Harvard-Oxford atlas were identified. The selected regions were 1. STG, post, 2. MTG, ant, 3. MTG, post, 4. Temporal-occipital MTG, 5. ITG, ant, 6. ITG, post, 7. Temporal-occipital ITG, 8. Insula., 9. parahippocampal g, ant, 10. Parahippocampal g, post, 11. Temporal fusiform g, ant, 12. Temporal fusiform g, post, 13. Temporal-occipital fusiform g, 14. Central opercular cortex, 15. Planum polare, 16. Heschl’s g, 17. Temporal pole, 18. STG, ant, 19. Supramarginal g, 20. Angular g, 21. Parietal operculum, 22. LOC, 23. Lingual g, 24. Occipital fusiform g, 25. Frontal pole, 26. Ventromedial prefrontal cortex, 27. Frontal orbital cortex, 28. Frontal opercular cortex, 29. IFG pars triangularis, 30. IFG pars opercularis. (b). Beta power decrements are summarized in the left and right hemispheres (c) and 30 selected regions.
Figure 6.
Figure 6.
Laterality indices of regions involved in the five selected time intervals of story comprehension relative to math. (a) Beta-power-decrement laterality indices are summarized in 30 selected regions and (b) the whole cortex. Laterality analysis was conducted on the selected regions shown in Fig. 5A. The negative and positive asymmetry index values represent right and left hemispheric dominance, respectively.

References

    1. AbdulSabur NY, Xu Y, Liu S, Chow HM, Baxter M, Carson J, Braun AR, 2014. Neural correlates and network connectivity underlying narrative production and comprehension: a combined fMRI and PET study. Cortex 57, 107–127. doi:10.1016/j.cortex.2014.01.017. - DOI - PubMed
    1. Andres M, Michaux N, Pesenti M, 2012. Common substrate for mental arithmetic and finger representation in the parietal cortex. Neuroimage 62, 1520–1528. doi:10.1016/j.neuroimage.2012.05.047. - DOI - PubMed
    1. Armeni K, Willems RM, van den Bosch A, Schoffelen J-M, 2019. Frequency-specific brain dynamics related to prediction during language comprehension. Neuroimage 198, 283–295. doi:10.1016/j.neuroimage.2019.04.083. - DOI - PubMed
    1. Arsalidou M, Pawliw-Levac M, Sadeghi M, Pascual-Leone J, 2018. Brain areas associated with numbers and calculations in children: Meta-analyses of fMRI studies. Dev. Cogn. Neurosci. 30, 239–250. doi:10.1016/j.dcn.2017.08.002. - DOI - PMC - PubMed
    1. Arsalidou M, Taylor MJ, 2011. Is 2+2=4? Meta-analyses of brain areas needed for numbers and calculations. Neuroimage 54, 2382–2393. doi:10.1016/j.neuroimage.2010.10.009. - DOI - PubMed

Publication types