. 2022 Nov 29;9(6):ENEURO.0396-22.2022.
doi: 10.1523/ENEURO.0396-22.2022. Print 2022 Nov-Dec.

Fast Synaptically Activated Calcium and Sodium Kinetics in Hippocampal Pyramidal Neuron Dendritic Spines

Affiliations

Fast Synaptically Activated Calcium and Sodium Kinetics in Hippocampal Pyramidal Neuron Dendritic Spines

Kenichi Miyazaki et al. eNeuro. .

Abstract

An accurate assessment of the time course, components, and magnitude of postsynaptic currents is important for a quantitative understanding of synaptic integration and signaling in dendritic spines. These parameters have been studied in some detail in previous experiments, primarily using two-photon imaging of [Ca2+]i changes and two-photon uncaging of glutamate. However, even with these revolutionary techniques, there are some missing pieces in our current understanding, particularly related to the time courses of synaptically evoked [Ca2+]i and [Na+]i changes. In new experiments, we used low-affinity, linear Na+ and Ca2+ indicators, laser fluorescence stimulation, and a sensitive camera-based detection system, combined with electrical stimulation and two-photon glutamate uncaging, to extend measurements of these spine parameters. We found that (1) almost all synaptically activated Na+ currents in CA1 hippocampal pyramidal neuron spines in slices from mice of either sex are through AMPA receptors with little Na+ entry through voltage-gated sodium channels (VGSCs) or NMDA receptor channels; (2) a spectrum of sodium transient decay times was observed, suggesting a spectrum of spine neck resistances, even on the same dendrite; (3) synaptically activated [Ca2+]i changes are very fast and are almost entirely because of Ca2+ entry through NMDA receptors at the time when the Mg2+ block is relieved by the fast AMPA-mediated EPSP; (4) the [Ca2+]i changes evoked by uncaging glutamate are slower than the changes evoked by synaptic release, suggesting that the relative contribution of Ca2+ entering through NMDA receptors at rest following uncaging is higher than following electrical stimulation.

Keywords: AMPA; NMDA; calcium; sodium; spine.


Conflict of interest statement

The authors declare no competing financial interests.

Figures

Figure 1.
Figure 1.
[Ca2+]i and [Na+]i changes in a dendritic spine evoked by a bAP and by synaptic stimulation. A, Top, Fluorescence image of a dendritic segment with an ROI and the position of the stimulating electrode marked. Middle, Difference image (between the times at the ends of the double arrow in B) of the [Ca2+]i change (ΔF) evoked by synaptic stimulation (first arrow at the bottom of B). The ROI was positioned over the location of the [Ca2+]i change. Bottom, Difference image of the [Na+]i change. The location of the change is the same as the location of the [Ca2+]i change. The length of both the calcium and sodium spots was 0.8 μm (FWHM). The color bars on the side show the range of values in the image from maximum to minimum. These color bars also apply to Figures 2 and 7. B, [Ca2+]i and [Na+]i changes at the ROI in response to an intrasomatically evoked bAP and two synaptic stimuli; the second synaptic response was suprathreshold. [Na+]i increases are shown downward because SBFI fluorescence decreases with increasing [Na+]i. C, Responses to the same stimuli with 100 μm APV added to the ACSF. The [Na+]i changes were almost unaffected but most of the [Ca2+]i increase was blocked, leaving only a small signal (red arrow).
Figure 2.
Figure 2.
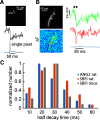
Sodium transients in dendritic spines and the axon initial segment. A, SBFI fluorescence transient detected by a single pixel (red box) covering an area of 0.4 × 0.4 μm2 in the axon initial segment (AIS) in response to an intrasomatically evoked AP (blue trace). The rise time of the signals was <2 ms (the frame interval of the camera) and was easily detected without averaging or filtering. B, An example of two spine signal with fast (4.1 ± 1.2 ms) and moderate (31.7 ± 17.2 ms) Na+ half recovery times activated by the same extracellular stimulus (calculated from exponential fits to the transients). Fluorescence signals from the two ROIs on a mouse pyramidal neuron and the corresponding somatic electrical recording are shown. C, Distribution of half decay times of spine Na+ transients in response to single synaptic stimuli. Measurements were made from 20 mouse spines (57 traces) using SBFI, 20 rat spines (43 traces) using SBFI, and 14 rat spines (36 traces) using ING-2. Half decay times were binned in 10-ms groups and normalized to the peak number for each protocol. The distributions were similar among the three groupings. Recordings with ING-2 from Miyazaki and Ross (2017).
Figure 3.
Figure 3.
The effect of APV (100 μm) on synaptically evoked Ca2+ transients in dendritic spines. APV reduced the magnitude to 0.33 ± 0.09% of control (p = 0.00,006) and half decay times from 30.2 ± 8.6 to 18.7 ± 9.2 ms (p = 0.003) but had no significant effect on the rise times (91% of control; p = 0.5). Changes for each of ten spines are shown.
Figure 4.
Figure 4.
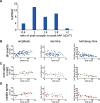
Magnitudes and time courses of synaptically evoked Ca2+ transients. A, Histogram of the number of traces with different values for the ratio of the synaptic [Ca2+]i increase to the [Ca2+]i increase evoked by a bAP at the same spine location. Events were binned in five groups (n = 40 trials from 24 spines). B, Distributions of the ΔF/F magnitudes, 10–90% rise times, and half decay times of synaptically evoked Ca2+ transients in spines as a function of the somatically recorded EPSP amplitude. All parameters were measured using 150 μm OGB-5N. No correction was made for background fluorescence (n = 58 total trials from 20 spines). C, Distribution of signals where only one active spine was visible in the camera field (16 trials from single activated spines in the field of view from 10 spines). D, Distribution of signals from the subset of responses from clearly visible spines (16 trials from 8 spines from 8 cells). The dashed lines in each panel show the best linear fits to the data. In most of these cells, the amplitude of the EPSP suggests that multiple axons were stimulated. The responses in one cell where only a single presynaptic fiber was activated is shown in Extended Data Figure 4-1.
Figure 5.
Figure 5.
Synaptic Ca2+ currents analyzed by deconvolution of the Ca2+ transients using three indicators of different Kd values. A, Left, bAP-evoked Ca2+ transient detected with fluo-5F used as the kernel in the deconvolution. Center, Responses with and without NBQX of synaptically evoked Ca2+ transients, using fluo-5F. In NBQX the response is smaller and slower. Right, Deconvolution of the synaptic responses using the bAP-evoked kernel. The largest response is in the first 10 ms after synaptic stimulation, and this component is blocked by NBQX. Arrows indicate 20 and 40 ms after the peak of the calcium current. B, Normalized histogram of the Ca2+ currents in the two conditions binned in 20-ms groups. Most of the effect of NBQX is in the first bin (0–10 ms; n = 5). C, Histogram of the effect of NBQX on the first 20 ms of the synaptic response, analyzed with the three indicators. The effects were similar (OGB-5N, n = 7; fluo-5F, n = 8; OGB-1, n = 2).
Figure 6.
Figure 6.
The effect of NBQX on synaptically evoked Ca2+ transients detected with indicators of different Kd values. A, Examples of responses with and without NBQX. The effect of NBQX is greatest when OGB-5N was used. All records are single trials except the recording of NBQX on the OGB-5N cell (average of 3 traces). The effect of NBQX on the somatically recorded EPSP is shown below. B, Histogram of the effect of NBQX on the amplitudes of the synaptic transients detected with the three indicators. The fractional reduction is greater with OGB-5N than with fluo-5F (p = 0.004) or with OGB-1 (p = 0.001; OGB-5N, 150 μm, n = 5; fluo-5F, 300 μm, n = 5; OGB-1, 50 μm, n = 5).
Figure 7.
Figure 7.
Time courses of Ca2+ transients evoked by uncaging MNI-glutamate on a dendritic spine detected with 150 μm OGB-5N. A, Image of a dendritic segment with a targeted spine indicated with a red arrow. A 1-ms flash at 720 nm generated a small EPSP and a calcium transient from the red ROI. The image in the inset shows the same segment without the ROI to make the spine clearer. The pseudocolor difference image (between the times at the ends of the black arrow) shows that the [Ca2+]i increase was only over the spine. B, Enlargement of a part of an image of a fluorescent bead excited by an 800-nm two-photon flash. Each pixel is 0.2 μm. The FWHM of a profile through the image (data not shown) was 0.7 μm. C, Cumulative frequency of rise times from many synaptically activated (n = 63) and uncaging (n = 16) calcium transients. D, Similar cumulative frequencies of half decay times. There is a clear difference between the two profiles.

Similar articles

Cited by

References

    1. Allen C, Stevens CF (1994) An evaluation of causes for unreliability of synaptic transmission. Proc Natl Acad Sci U S A 91:10380–10383. 10.1073/pnas.91.22.10380 - DOI - PMC - PubMed
    1. Araya R, Nikolenko V, Eisenthal KB, Yuste R (2007) Sodium channels amplify spine potentials. Proc Natl Acad Sci U S A 104:12347–12352. 10.1073/pnas.0705282104 - DOI - PMC - PubMed
    1. Beaulieu-Laroche L, Harnett MT (2018) Dendritic spines prevent synaptic voltage clamp. Neuron 97:75–82.e3. 10.1016/j.neuron.2017.11.016 - DOI - PubMed
    1. Bloodgood BL, Sabatini BL (2005) Neuronal activity regulates diffusion across the neck of dendritic spines. Science 310:866–869. 10.1126/science.1114816 - DOI - PubMed
    1. Bloodgood BL, Sabatini BL (2007) Nonlinear regulation of unitary synaptic signals by CaV(2.3) voltage-sensitive calcium channels located in dendritic spines. Neuron 53:249–260. 10.1016/j.neuron.2006.12.017 - DOI - PubMed

Publication types

LinkOut - more resources