

Pathways explaining racial/ethnic and socio-economic disparities in incident all-cause dementia among older US adults across income groups
- PMID: 36379922
- PMCID: PMC9666623
- DOI: 10.1038/s41398-022-02243-y
Pathways explaining racial/ethnic and socio-economic disparities in incident all-cause dementia among older US adults across income groups
Abstract
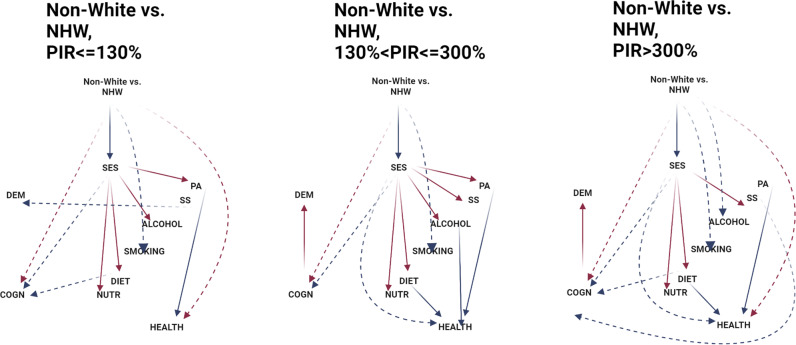
Differential racial and socioeconomic disparities in dementia incidence across income groups and their underlying mechanisms remain largely unknown. A retrospective cohort study examining all-cause dementia incidence across income groups was conducted linking third National Health and Nutrition Examination Surveys (NHANES III) to Centers for Medicare and Medicaid Services-Medicare data over ≤26 y of follow-up (1988-2014). Cox regression and generalized structural equations models (GSEM) were constructed among adults aged≥60 y at baseline (N = 4,592). Non-Hispanic Black versus White (NHW) adults had higher risk of dementia in age and sex-adjusted Cox regression models (HR = 1.34, 95%CI: 1.15-1.55, P < 0.001), an association that was attenuated in the SES-adjusted model (HR = 1.15, 95%CI: 1.01-1.34, P = 0.092). SES was inversely related to dementia risk overall (per Standard Deviation, HR = 0.80, 95% CI:0.69-0.92, P = 0.002, Model 2), mainly within the middle-income group. Within the lowest and middle-income groups and in socio-economic status (SES)-adjusted models, Mexican American participants were at lower all-cause dementia risk compared with their NHW counterparts. GSEM models further detected 3 pathways explaining >55% of the total effect of SES on dementia risk (Total effect = -0.160 ± 0.067, p = 0.022), namely SES→LIFESTYLE→DEMENTIA (Indirect effect (IE) = -0.041 ± 0.014, p = 0.004), SES→LIFESTYLE→COGN→DEMENTIA (IE = -0.006 ± 0.001, p < 0.001), SES→COGN→DEMENTIA(IE = -0.040 ± 0.008, p < 0.001), with the last two remaining significant or marginally significant in the uppermost income groups. Diet and social support were among key lifestyle factors involved in socio-economic disparities in dementia incidence. We provide evidence for modifiable risk factors that may delay dementia onset differentially across poverty-income ratio groups, underscoring their importance for future observational and intervention studies.
© 2022. This is a U.S. Government work and not under copyright protection in the US; foreign copyright protection may apply.
Conflict of interest statement
The authors declare no competing interests.
Figures
References
Publication types
MeSH terms
LinkOut - more resources
Full Text Sources
Medical
